Economics IB HL - Unit 1 - Microeconomics - Government intervention
1/44
There's no tags or description
Looks like no tags are added yet.
Name | Mastery | Learn | Test | Matching | Spaced | Call with Kai |
|---|
No study sessions yet.
45 Terms
What is an indirect tax?
It is taxes on spending to buy particular goods and services, paid indirectly to the government by the seller
What are four reasons why governments impose indirect taxes?
They provide the government with revenue needed to finance government expenditures
can be used to improve the allocation of resources when there are negative externalities
can be used to reduce the quantity of imports into a country
For goods that are harmful they can be used to decrease consumption
What is a specific tax?
this tax is a specific amount imposed per unit of the good.
What affect does a specific tax have on the supply curve?
This results in a parallel shift of the S curve left and upwards.
what is an ad valorem tax?
this tax is a percentage of the price of the good.
How does an ad valorem tax affect the supply curve?
this results in an S curve that is steeper than the previous curve because the amount of tax increases as P increases
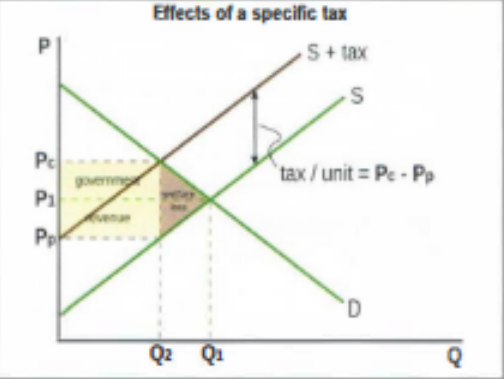
Using this diagram explain the effects of a specific tax on market outcomes
So the New equilibrium quantity is lower at Q2. Also the new equilibrium P - which is paid by the consumer has increased to Pc. the new P received by the producer is lower at Pp.

Using the same diagram what are the effects of a specific tax on stakeholders.
Consumers - lose: they pay a higher price and buy fewer goods
Producers - lose: they receive a lower P and sell a lower Q so their revenue falls from P1 x Q1 to Pp x Q2
Workers - lose: less is produced, therefore some people are made redundant.
Government - win: they gain tax revenue = yellow shaded area - tax per unit x Q2
Society - loses: because there is a resource misallocation because Q2 < Q1 and so there is welfare loss = brown triangle.
in a free market with no government intervention, demand is given by Qd = 16 - 2P and supply by Qs = -8 + 4P. The government imposes an indirect tax on good Z of $3 per unit. Using this information calculate the market outcomes and effects on stakeholders of this tax.
FIND equilibrium P and Q before tax
16-2P = -8 +4P → P = $4, Q = 8 units
Plot the D and S curves and find their point of intersection
FIND after tax equilibrium
after tax Qs = c + d (P-T) so Qs = -8 +4 (P - 3 ) = after tax = -20 +4P
To find the new price paid by consumers work out new equilibrium P
16 - 2P = -20 +4P = P = $6 Q = 4 units
To find price received by producers do Pc - t = 6 - 3 = Pp = $3

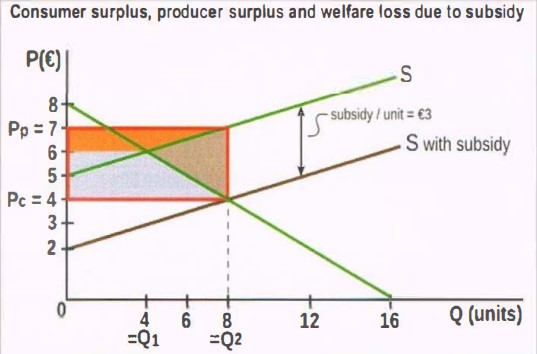
Using the information gathered from last flashcard and using this diagram calculate the effects on stakeholders and on consumer expenditure
Consumer expenditure - Before tax = 4 × 8 = $32. After tax = 6 × 4 = $24. Consumer expenditure decreased by $8
Producer revenue - Before tax 4 × 8 = $32. After tax = 3 × 4 = $12. Producer revenue decreased by $20
Government tax revenue - tax per unit x number of units sold = 3 × 4 = $12. Government gained $12 revenue
Consumer Surplus (=area under D curve above P paid by consumers): Before tax =($8 - $4) x 8 /2 = $16. After tax = 4 ×2=8/2 = $4. Consumers are worse off because surplus decreased by $12
Producer surplus (=area above S curve under P received by producers): Before tax = 2 × 8 = 16/2 = $8. After tax 4/2 = $2. Producers are worse off as producer surplus decreased by $6
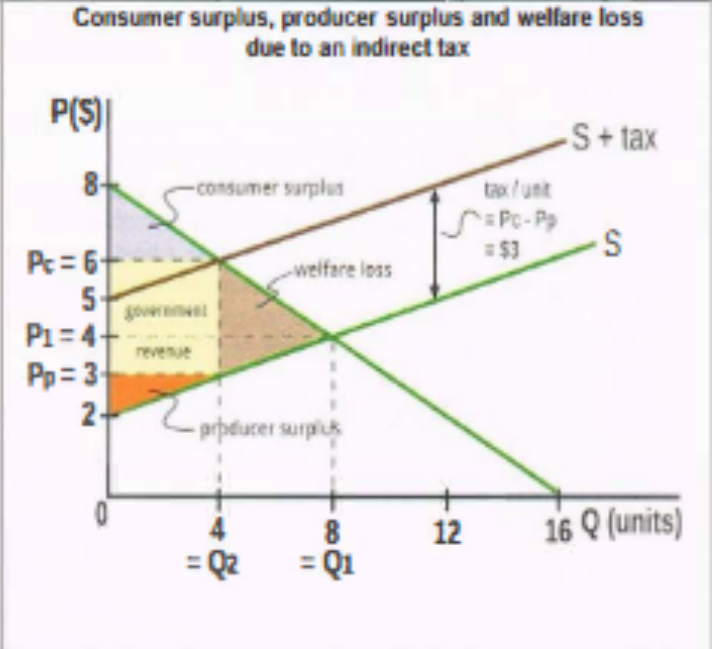
Using the same diagram what would be the welfare loss to society
Benefits are lost to society because of resource misallocation.
The welfare loss = 6-3 × 8-4 = 12/2 = $6 = brown traingle
How would you calculate welfare loss?
Pc - Pp x Q1 - Q2/ 2
What is the tax incidence?
the particular group bearing the burden of a tax.
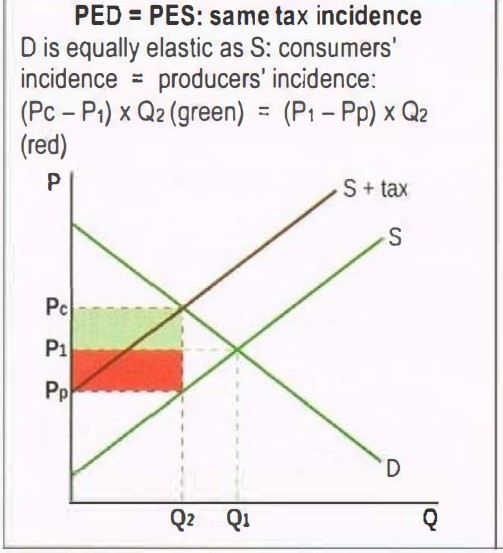
If PED = PES who has the tax incidence?
it is the same on consumers and producers
What is the tax incidence if PED > PES
tax incidence is greater on producers
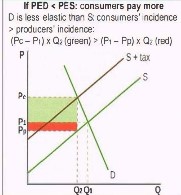
What is the tax incidence if PED < PES
tax incidence is greater on consumers
Show on a diagram the tax incidence when PED = PES
D is equally elastic as S: consumers’ = producers’ incidence.

Show on a diagram the tax incidence when PED > PES AND EXPLAIN what it means
D is more elastic than S: consumers incidence is less than producers incidence so producers pay more
What does it mean and explain what the tax incidence is when PED < PES?
D is less elastic than S: consumers’ incidence > producers’ incidence
What is a subsidy?
it is a payment by the government to firms in order to lower costs and price, and increase supply
What are six reasons why government grant subsidies?
used to increase firms revenues
used to support particular firms or industries
used to lower the prices of particular goods or services for consumers
can be used to encourage the consumption of goods that are considered to be desirable for society e.g. education
can be used to lower the price of particular goods in order that they sell more in export markets.
used to improve the allocation of resources when there are positive externalities.

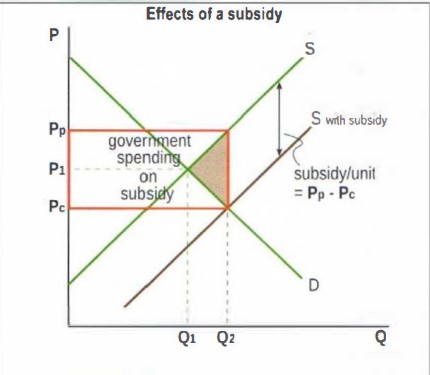
Using this diagram explain the market outcomes of a subsidy
A subsidy results in a parallel shift of the S curve to the right: the vertical distance between the initial S curve and the after-subsidy S curve. The new equilibrium Q is higher at Q2. New equilibrium P, which is P paid by the consumer, is lower at Pc. New P received by the producer is higher at Pp.
using the same diagram explain the effects on stake holders
consumers gain: they pay a lower P and buy a higher Q.
producers gain: receive a higher P and sell a higher Q so revenue increases
Workers gain: more is produced therefore some unemployed find jobs
Government loses: it must pay the subsidy = bold red triangle = subsidy per unit x Q2, with negative effects on government budget
society loses: high-cost producers are protected by the higher price, leading to inefficiency. government spending on subsidy has opportunity costs. there is resource misallocation over production and welfare loss. Brown triangle.

how to calculate the new S curve after subsidy?
Qs = c + d (P+s)
what and how do you calculate producer surplus?
It is the area above the S curve and under Price received by producers
In this diagram what is the producer surplus before the subsidy?
1 × 4 = 4/2 = $2
What are price controls?
It is government intervention in the market involving the setting of price ceilings or price floors.
What is a price ceiling?
A maximum price on a good set by the government that is below the equilibrium price of the market. Resulting in a shortage.
Why governments impose price ceilings?
To make some necessities affordable to poor people, food products and rental prices.
What are the consequences of price ceilings for the market and the economy?
Shortages because the price ceiling does not let P adjust to its equilibrium value Pe
Since the price no longer fulfils its signalling and incentive functions other methods are needed to distribute the goods. This can be waiting lines, first come first served etc.
Can result in buyers re-selling the good illegally at higher prices because there are some buyers who are unsatisfied.
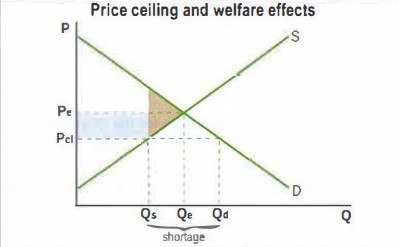
Using this diagram help explain the welfare effects of price ceilings
There is an inefficient resource allocation - where there is an under allocation of resources since less is produced than Qe.
There is also welfare losses for society. That is the brown shaded triangle. This is where Qs of the good is produced and consumer rather than Qe.
Also because there is a fall in price the grey highlighted area highlights the gain in consumer surplus.
What are the consequences of price ceilings for consumers?
Consumers who are able to buy the good at the lower price gain but those who can’t because of the shortage lose.
What are the consequences of price ceilings for workers
some workers lose their jobs due to lower output produced
What are the consequences of max price on producers?
Producers lose because they sell a lower quantity and because they receive a lower price.
What are price floors?
This is a minimum price on a good set by the government that is above the equilibrium price of the market.
Why governments impose price floors?
The minimum P is above equilibrium to firstly
support farmers incomes by increasing the price they receive for their products
support wages of low-skilled workers by increasing them above the market equilibrium point.
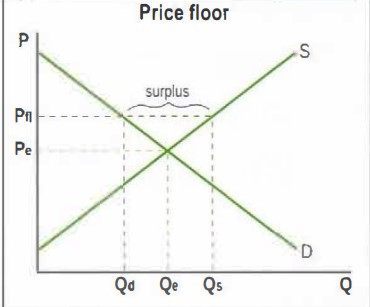
Draw a diagram with a price floor
here
What are the consequences of agricultural price floors for the economy?
There is a surplus (excess supply) The price floor does not let P fall to Pe so results in surplus as at the min price Qd<Qs
The higher price allows firms with high costs of production to not cut costs and so becoming inefficient
Governments have to buy the surplus to maintain the price floor and so this involves budget expenditures with opportunity costs
inefficient resource allocation because more is produced than the consumers want.
The welfare loss is the brown shaded area
What are the consequences of agricultural price floors for stake holders?
Consumers lose as they pay a higher price for a lower quantity
Producers gain because they receive a higher price and sell a larger quantity.
Workers gain because more output is produced therefore there will be an increase in employment
The government loses as it must pay for the purchase of the surplus out of its budget. It might also then have to store which costs money, or export which means also paying subsidies
Stakeholders in other countries lose because if excess supply is exported, leading to an increase in global supply so lowering the global prices so negatively effecting farmers in other countries .
What is a minimum wage?
A minimum price of labour set by the government to protect low skilled workers to ensure they can achieve basic living standards/
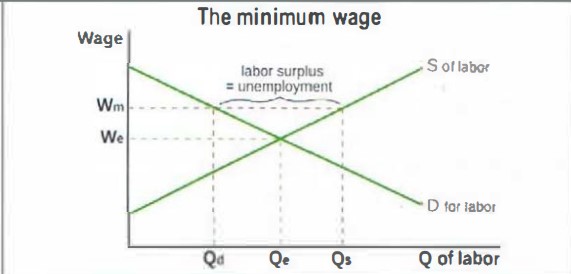
Draw an explain a diagram showing a minimum wage in the labour market.
The minimum wage Wm, does not allow the price of labour to adjust to its equilibrium value. This results in a surplus of labour. excess supply. This is unemployed labour
Three consequences of minimum wages for the economy
There may be some illegal workers who will agree to work for lower wages because of the unemployment.
There is a misallocation of resources in the labour market
What are the consequences of min wage for stakeholders?
Workers - those who receive the min wage benefit but those who become unemployed lose
Firms - may be stuck with unskilled labour and paying min wage so higher costs of production
Consumers - Higher COP means a left shift in S curve resulting in higher P and lower Q so consumers lose.
how would you calculate government expenditure to purchase surplus when there is a price floor
Price floor x amount of surplus