Econ 201 UMD
 Call Kai
 Learn
Learn Practice Test
 Spaced Repetition
 Match
Match Flashcards
 Knowt Play
1/119

There's no tags or description
Looks like no tags are added yet.
Name | Mastery | Learn | Test | Matching | Spaced | Call with Kai | Chat |
|---|
No analytics yet
Send a link to your students to track their progress
120 Terms
Economics
the study of how best to allocate scarce resources among competing uses.
Microeconomics
is the study of how households and firms make decisions and how they interact in markets.
Macroeconomics
the study of economy-wide phenomena, including inflation, unemployment, and economic growth
Assumptions
simplify the complex world, make it easier to understand.
models
to study economic issues. It is a highly simplified representation of a more complicated reality.
positive statements
which attempt to describe the world as it is
scientific method
the dispassionate development and testing of theories about how the world works
normative statements
which attempt to prescribe how the world should be, this is a value judgment, cannot be confirmed or refuted.
Which can be refuted, positive or normative statements?
Positive statements can be confirmed or refuted, normative statements cannot
Positive Statements
describes a relationship, could use data to confirm or refute
Must a statement be true in order to be a positive statement?
Nope
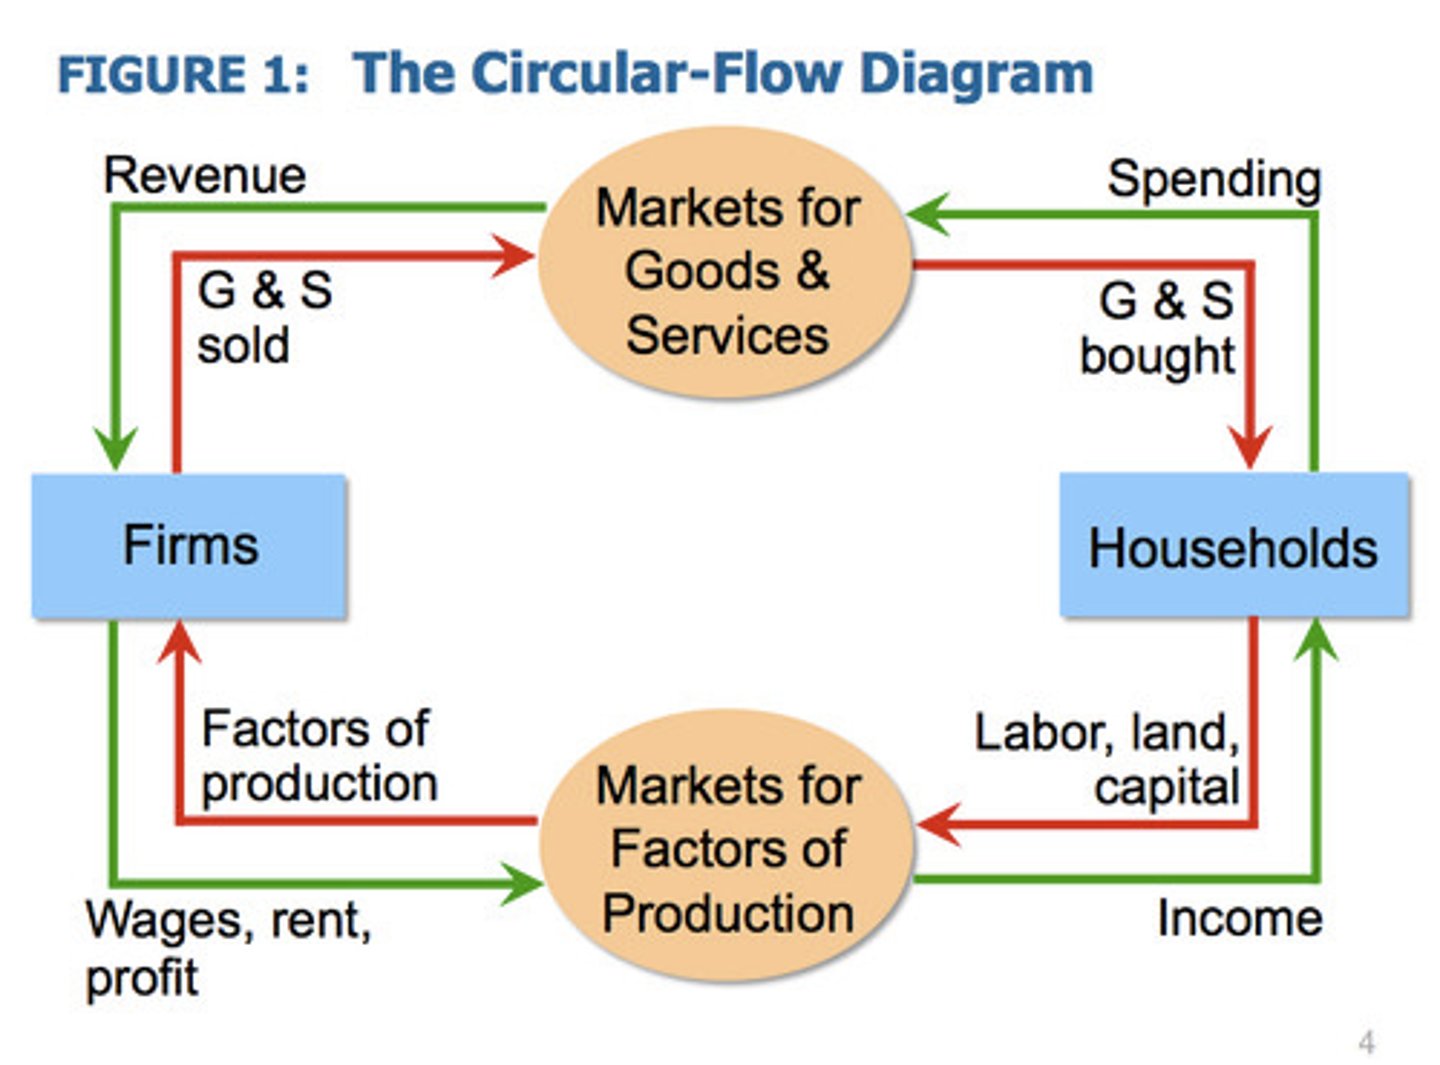
The Circular-Flow Diagram
A visual model of the economy, shows how dollars flow through markets among households and firms.
Factors of Production
are the resources that the economy uses to produce goods & services. They include:
- labor - land - capital (buildings & machines used in production)
The Production Possibilities Frontier
A graph that shows the combinations of two goods the economy can possibly produce given the available resources and the available technology.
Points on the line of the PPF are?
- possible - efficient: all resources are fully utilized
Points under the line (to the left) of the PPF are?
- possible
- not efficient: some resources underutilized (e.g., workers unemployed, factories idle)
Points above the line (to the right) of the PPF are?
-not possible
opportunity cost
of an item is what must be given up to obtain that item
Moving along a PPF involves
shifting resources (e.g., labor) from the production of one good to the other.
The PPF slope tells us
The slope of the PPF tells you the opportunity cost of one good in terms of the other
Economic growth shifts the PPF ..
outwards
Why may a PPF be bow shaped?
-when different workers have different skills, different opportunity costs of producing one good in terms of the other
-when there is some other resource, or mix of resources with varying opportunity costs
Demand schedule
A table that shows the relationship between the price of a good and the quantity demanded.
Quantity demanded
is the sum of the quantities demanded by all buyers at each pric
Demand Curve Shifters (5)
-# of buyers
-income
-prices of
related goods
-tastes
-expectations
Price...causes a movement
along the D curve
No. of buyers ...shifts the D curve
Income ...shifts the D curve
Price of related goods ...shifts the D curve
Tastes ...shifts the D curve
Expectations ...shifts the D curve
An increase in the number of buyers causes
an increase in quantity demanded at each price, which shifts the demand curve to the right.
Demand for a normal good
is positively related to income. An increase in income causes increase in quantity demanded at each price, shifting the D
curve to the right.
Demand for an inferior good
is negatively related to income. An increase in income shifts D curves for inferior goods to the left
substitutes
if an increase in the price of one causes an increase in demand for the other
complements
an increase in the price of one causes a fall in demand for the other.
The Demand Function
Qxd = f(Px ; PY , M, H,)
-Qxd = quantity demand of good X.
-Px = price of good X. - PY = price of a related good Y.
• Substitute good.
• Complement good.
-M = income.
• Normal good.
• Inferior good.
-H = any other variable affecting demand.
quantity supplied
of any good is the amount that sellers are willing and able to sell at alternative prices.
Law of supply
the claim that the quantity supplied of a good rises when the price of the good rises, other things equal
Supply schedule
A table that shows the relationship between the price of a good and the quantity supplied.
Supply Curve Shifters (4)
-input prices
-technology
-# of sellers
-expectations
What happens to the supply curve when there is a fall in prices
A fall in input prices makes production more profitable at each output price, so firms supply a larger quantity at each price, and the S curve shifts to the right.
What happens to the supply curve when there is new technoloy
A cost-saving technological improvement has same effect as a fall in input prices, shifts the S curve to the right.
What happens to the supply curve when there is an increase in quantity supplied.
An increase in the number of sellers increases the quantity supplied at each price, shifts the S curve to the right.
What happens when a firm expects the price of the good it sells to rise in the future.
-The firm may reduce supply now, to save some of its inventory to sell later at the higher price.
-This would shift the S curve leftward.
The Supply Function
QxS = f(Px; W, H,)
QxS = quantity supplied of good X.
- Px = price of good X
- W = price of inputs (e.g., wages)
- H = other variable affecting supply.
Equilibrium
P has reached
the level where quantity supplied
equals quantity demanded
Equilibrium price
The price that equates quantity supplied with quantity demanded
Equilibrium quantity
The quantity supplied and quantity demanded at the equilibrium price
Surplus
when quantity supplied is greater than quantity
demanded
what reduces the surplus.
-Facing a surplus,
sellers try to increase sales by cutting the price.
-This causes QD to rise
Surplus
-Prices continue to fall until market reaches equilibrium.
Shortage:
when quantity demanded is greater than quantity supplied
what reduces the shortage.
-Facing a shortage, sellers raise the price,
causing QD to fall
-Prices continue to rise until market reaches equilibrium.
Three Steps to Analyzing Changes in Equilibrium
1. Decide whether event shifts S curve,
D curve, or both.
2. Decide in which direction curve shifts.
3. Use supply-demand diagram to see
how the shift changes equilibrium P and Q.
How the CPI Is Calculated
1. Fix the "basket." The Bureau of Labor Statistics (BLS) surveys consumers to determine what's in the typical consumer's "shopping basket."
2. Find the prices. The BLS collects data on the prices of all the goods in the basket.
3. Compute the basket's cost. Use the prices to compute the total cost of the basket.
4. Choose a base year and compute the index. The CPI in any year equals
5. Compute the inflation rate. The percentage change in the CPI from the preceding period. 100 x cost of basket in current year cost of basket in base year
CPI this year - CPI last year CPI last year
Inflation rate x 100%
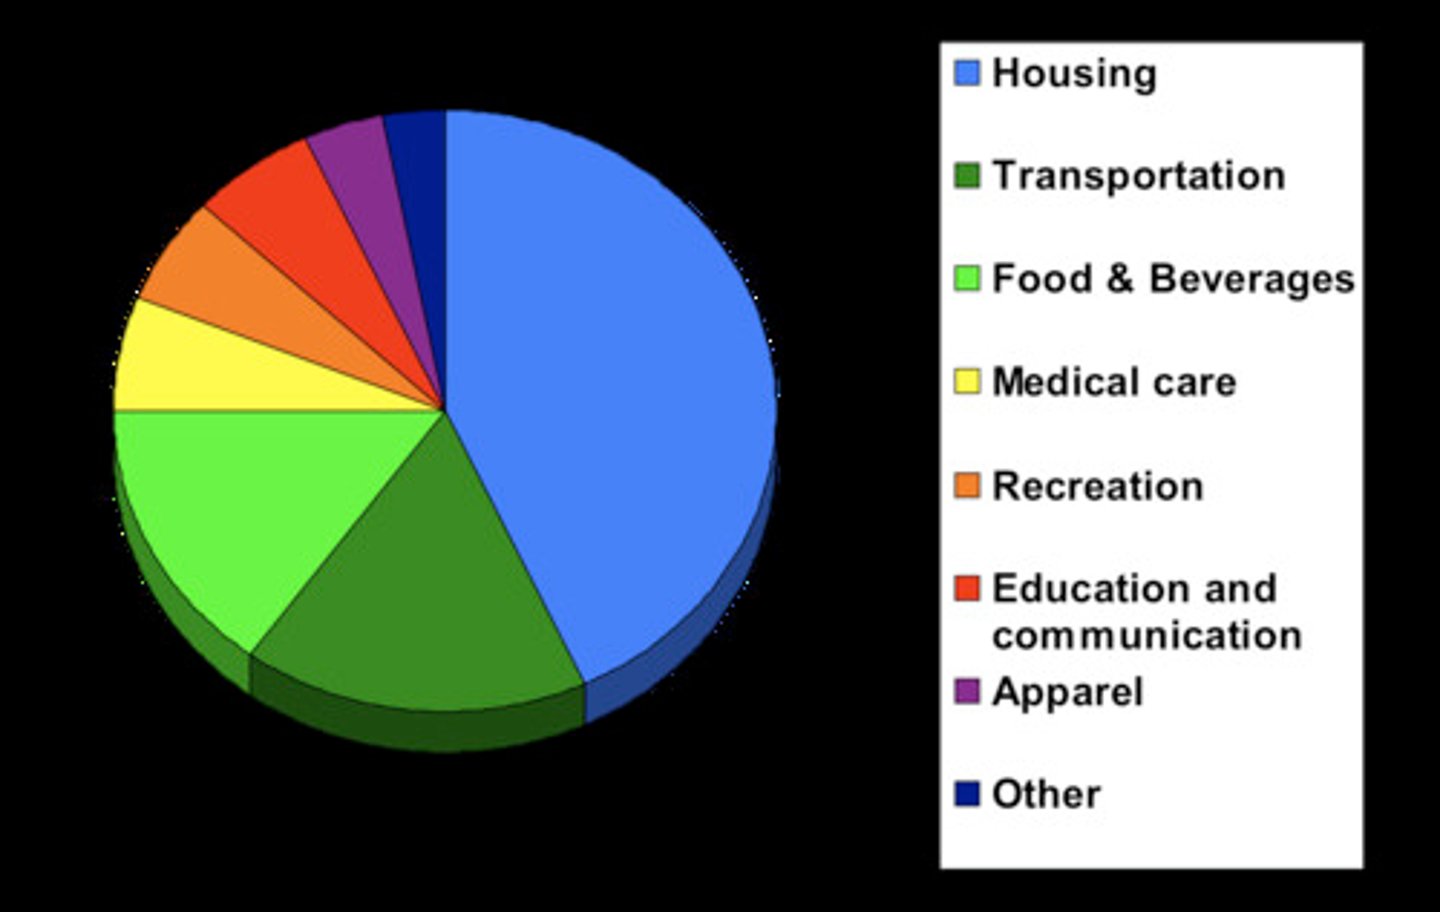
What's in the CPI's Basket?
Substitution Bias
-Over time, some prices rise faster than others.
-Consumers substitute toward goods that become relatively cheaper.
-The CPI misses this substitution because it uses a fixed basket of goods.
-Thus, the CPI overstates increases in the cost of living.
Problems with the CPI:
-Substitution Bias
-Introduction of New Goods
-Unmeasured Quality Change
Introduction of New Goods
-The introduction of new goods increases variety, allows consumers to find products that more closely meet their needs.
-In effect, dollars become more valuable.
-The CPI misses this effect because it uses a
fixed basket of goods.
-Thus, the CPI overstates increases in the cost of living.
Unmeasured Quality Change
-Improvements in the quality of goods in the
basket increase the value of each dollar.
-The BLS tries to account for quality changes
but probably misses some, as quality is hard to measure.
-Thus, the CPI overstates increases in the cost of living.
Contrasting the CPI and GDP Deflator
Imported consumer goods:
-included in CPI
-excluded from GDP deflator
Capital goods:
-excluded from CPI
-included in GDP deflator (if produced domestically)
The basket:
-CPI uses fixed basket
-GDP deflator uses basket of
currently produced goods & services
-This matters if different prices are changing by different amounts.
Comparing Dollar Figures from Different Times
Amount in today's dollars = Amount in year T
dollars x Price level today / Price level in year T
A dollar amount is indexed for inflation
if it is automatically corrected for inflation by law or in a contract
Real vs. Nominal Interest Rates
The nominal interest rate:
-the interest rate not corrected for inflation -the rate of growth in the dollar value of a
deposit or debt
The real interest rate:
-corrected for inflation
-the rate of growth in the purchasing power of a deposit or debt
RIR (real interest rate) formula
Real interest rate = (nominal interest rate) - (inflation rate)
employed
aid employees, self-employed,
and unpaid workers in a family business
unemployed
people not working who have
looked for work during previous 4 weeks
labor force
the total # of workers, including the employed and unemployed
Unemployment rate ("u-rate"):
% of the labor force that is unemployed
Unemployment rate ("u-rate"):
% of the labor force that is unemployed
u-rate = 100 x # of unemployed / labor force
Labor force participation rate: % of the adult population that is in the labor force
labor force participation rate = 100 x
labor force / adult population
What Does the U-Rate Really Measure?
The u-rate is not a perfect indicator of joblessness
or the health of the labor market:
• excludes discouraged workers
• does not distinguish between full-time and
part-time work, or people working part time because full-time jobs are not available.
• Also, some people may misreport their work
status in the BLS survey.
Despite these issues, the u-rate is still a very
useful barometer of the labor market & economy.
Seasonal unemployment
is the unemployment due to
seasonal changes in employment or labor supply.
Frictional unemployment
is the brief periods of
unemployment experienced by people moving between jobs or into the labor market. Demand and skill are present.
Structural unemployment
is the unemployment caused
by a mismatch between the skills of job seekers and the requirements of available jobs.
Cyclical unemployment
is the unemployment
attributable to the lack of job vacancies - i.e., to an inadequate level of aggregate demand.
• the deviation of unemployment from its
natural rate
• associated with business cycles, which we'll
study in later chapters
The natural rate of unemployment
• the normal rate of unemployment around which
the actual unemployment rate fluctuates
Govt employment agencies:
give out information about job vacancies to speed up the matching of workers with jobs
Public training programs:
aim to equip workers displaced from declining industries with the skills needed in growing industries
Explaining Unemployment
1. Minimum-Wage Laws
2. Unions
3. Efficiency Wages
Minimum-Wage Laws
-The min. wage may exceed the eq'm wage
for the least skilled or experienced workers, causing unemployment.
-But this group is a small part of the labor force, so the min. wage can't explain most
unemployment.
Union
a worker association that bargains with
employers over wages, benefits, and working conditions
-The typical union worker earns 20% higher
wages and gets more benefits than a nonunion worker for the same type of work.
Insiders
workers who remain employed,
they are better off
Outsiders
workers who lose their jobs,
they are worse off
What happens when the union raises the wage above equilibrium?
When unions raise the wage above eq'm, quantity of labor demanded falls and unemployment results
What happens when outsiders go to non-unionized labor markets?
Some outsiders go to non-unionized labor markets, which increases labor supply and reduces wages in those markets.
What are two implications of Unions?
• Union members' average earnings are higher than non-union members' average
earnings.
• The difference between union and non-union wages are higher in industries that are more heavily unionized than in less heavily unionized industries.
Are unions good or bad from economic standpoint?
-Critics:Unions are cartels. They raise wages above eq'm,
which causes unemployment and/or depresses wages in non-union labor markets.
-Advocates: Unions counter the market power of large firms,
make firms more responsive to workers' concerns.
efficiency wages
firms voluntarily pay above-equilibrium wages to boost worker productivity
efficiency wage theories (4)
Worker health
Worker turnover
Worker quality
Worker effort
Worker health
-In less developed countries, poor nutrition is a common problem. Paying higher wages allows workers to eat better, makes them healthier, more productive.
Worker turnover
-Hiring & training new workers is costly. Paying high wages gives workers more incentive to stay, reduces turnover.
Worker quality
-Offering higher wages attracts better job applicants,
increases quality of the firm's workforce.
Worker effort
-Workers can work hard or shirk. Shirkers are fired if caught. Is being fired a good deterrent?
Depends on how hard it is to find another job.
If market wage is above eq'm wage, there aren't
enough jobs to go around, so workers have more incentive to work not shirk.
Shock
Technological progress has shifted labor demand from unskilled to skilled workers in recent decades.
Effect in Europe
Higher unemployment, due to generous govt benefits for unemployed workers and strong union presence.
The natural rate hypothesis
-Changes in aggregate demand affect output and employment only in the short run.
-In the long run, the economy returns to the levels of output, employment, and unemployment described by the classical model.
Hysteresis
the long-lasting influence of history on variables such as the natural rate of unemployment.
What effect does a Negative shocks have on the economy?
may increase un,
so economy may not fully recover
Hysteresis: Why negative shocks may increase the natural rate
-The skills of cyclically unemployed workers may
deteriorate while unemployed, and they may not find a job when the recession ends.
-Cyclically unemployed workers may lose their influence on wage-setting; then, insiders (employed workers) may bargain for higher wages for themselves.
Result: The cyclically unemployed "outsiders" may become structurally unemployed when the recession ends.
Policy Responses:
1. Stop raising the (nominal) minimum wage.
2. Regulate unions (just like other monopolies are
regulated) to reduce unions' impact on wages.
3. Reduce the generosity of unemployment insurance
benefits.
4. Implement government employment agencies to
increase the accessibility of information about job
vacancies and available workers.
5. Increase public funding to help retrain workers
displaced from jobs in declining industries.
Gross Domestic Product (GDP)
-measures total income of everyone in the economy.
-GDP also measures total expenditure on the
economy's output of g&s.
-For the economy as a whole,
income equals expenditure
because every dollar a buyer spends is a dollar of income for the seller.
Gross Domestic Product (GDP) Is...
the market value of all final goods & services produced within a country in a given period of tim
Final goods:
intended for the end user
Intermediate goods:
used as components or ingredients in the production of other goods
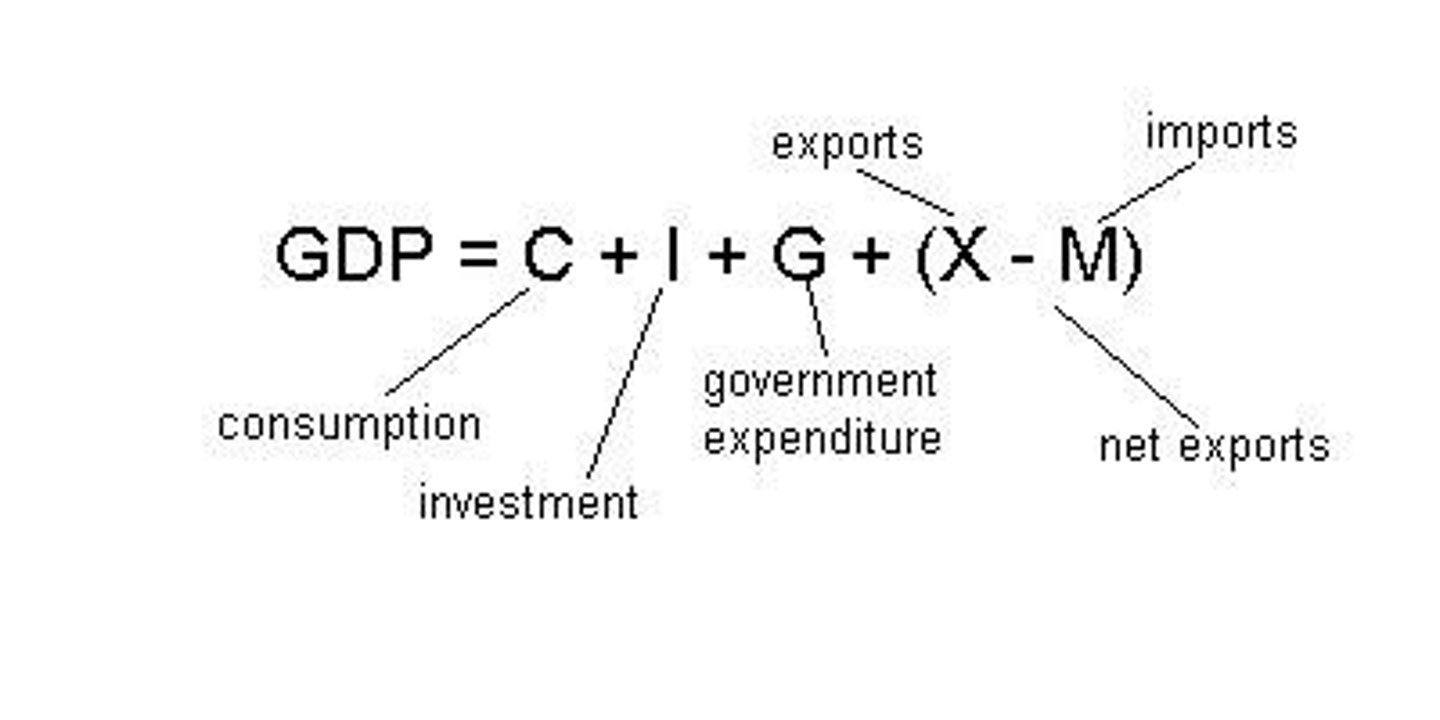
The Components of GDP (4)
-Consumption (C)
-Investment (I)
-Government Purchases (G)
-Net Exports (NX)
Consumption (C)
-is total spending by households on g&s.
-Note on housing costs:
-For renters, consumption includes rent payments.
-For homeowners, consumption includes the imputed rental value of the house, but not the purchase price or mortgage payments.