Econometrics
1/47
There's no tags or description
Looks like no tags are added yet.
Name | Mastery | Learn | Test | Matching | Spaced |
|---|
No study sessions yet.
48 Terms
What is an example of a research question in Labour Ecoomics
Does Obtaining a Master’s Degree increase future wages
What is the difference between causation and correlation
Correlation is co-movement, causation means one variable impacts another
What is an example of a “counterfactual”
The birthweight of a baby if the mother had not smoked
What is “centris paribus” is econometrics
Holding all other factors constant while changing one
Why are randomized controlled trials (RCTs) often considered the gold standard to detect causal effects
They change one random variable while holding the others constant
What is the difference between a sample and a population distribution
A population sample includes all distributions while a sample is based on the subset
Which is an example of a discrete variable
Number of Children
Which data set consists solely of observations taken at a single point in time?
Cross-Sectional Data
Which of these best describes a histogram
A method to display the contribution of continuous variables
What is the purpose of summarizing a distribution?
To describe key features like central tendency and dispersion
What does the central limit theorem (CLT) state
The sampling distribution of the mean approaches a normal distribution
What happens to the mean and median if there is a very large outlier
The mean is more effected than the median
If X and Y are independent, it means that
Learning the value of one tells you nothing about the other
Id X and Y are positively related, what does this imply about the conditional expectatio E(Y|X)
As X increases, E(Y|X) increases

2.5
What is the main idea behind binning when calculating conditional means
To group X values into bins and calculate the average of Y within the bin
In linear regression, if we add a control variable Z, what does the coefficient B1 on the X variable represent
The part of the relationship between X and Y that is not explained by Z
What does the simple linear regression model explain
The dependent variable in terms of the explanatory variable
What does the R² value measure in a regression model
Fraction of total variation in outcome (y) explained by regression
Which of the following statements about R² is TRUE
It measures the goodness-of-fit but does not imply causality
What does the assumption of homoskedasticity imply
The variance of the error term doesn’t depend on the explanatory variable
What happens if the zero conditional mean assumption does not hold
OLS estimates are biased
The OLS regression can be estimated even if an explanatory variable has no variation in the sample
False
Given the OLS regression, which of the following best represents the defiiion of a residual for the i-th observation
The difference between yi and the predectied yi(hat) from the OLS regression
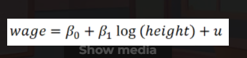
Using the following simple OLS regression, we want to analyze the impact of height on wage the proposed model is…
Linear in parameters and nonlinear in variable
What is the main reason behind using multiple regression instead of a simple linear regression model
It allows to account for multiple explanatory variables
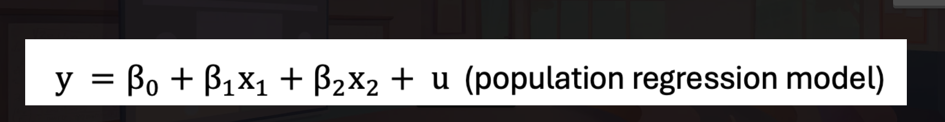
The population regression model is given and E(u|x1,x2) = 0, if x2 is omitted, this causes a bias. When is the Bias 0
a. when the omitted variable x2 has no effect on y that is if b2 =0
b. when the omitted variable x2 is uncorrelated with x1 (e.g: cov(x1,x2) = 0)
c. When the omitted variable x2 is included in the regression model again
d. all of the above
All of the above
When does omitting x2 lead to a bias of B1(hat). Assuming that E(u|x1, x2)=0 still holds
a. when B2 > 0 and cov(x1,x2)>0
b. when B2 < 0 and cov(x1,x2) > 0
c. when B2 > 0 and cov(x1, x2) < 0
d. none of the above options
a. When B2 > 0 and Cob (x1,x2) > 0
What happens to the sim of squared residuals (SSR) when more explanatory variables are added to the regression model
SSR decreases as predicted values get closer to actual values
Why is the zero conditional mean assumption important in multiple regression
It allows for a causal interpretation of the estimated regression coefficients
What does the assumption of homoskedasticity imply in a multiple regression model
The error term’s variance is constant across all explanatory values
What does the Gauss-Markov Theorem state about the OLS estimators under assumptions MLR1-MLR5
They are the best linear unbiased estimators
In statistical hypothesis testing, what does the null hypothesis(H0) represent
A claim that the parameter equals a specific hypothesized value, typically zero
In statistical hypothesis testing, it is possible to accept the null hypothesis (H0) or the alternate hypothesis (H1)
No, we do not accept hypotheses— we either reject H0 or fail to reject it
What is the importance of the normality assumptuon in regression analysis
It is necessary for valid hypothesis testing, especially in small samples
True or false: For the purposes of statistical inference, the assumption of normality can be replaced by a large sample size
True
In statistical hypothesis testing, what does the t-statistic measure
How many standard error the estimated coefficient is away from the hypothesis value
What does the F-test evaluate in a regression model
Whether multiple coefficients are jointly significant
What does a low p-value (eg: < 0.05) indicate in hypothesis testing
Strong evidence against the null hypothesis
How are the p-value and t-statistic related
A higher t-statistic generally leads to a lower p-value
What does a confidence interval represent?
A range of values where the population parameter is likely to be found
What value does a dummy variable typically take to indicate the presence of a characteristic
Any number between 0 and 1
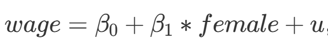
In the model shown above, what does B1 represent
The average wage difference between females and males
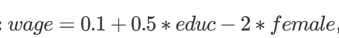
Given the model above, what is the predicted wage for a man with 12 years of education
6.1
if male = 1 - female, what kind of issue does this cause in a regression if both variables, male and female, are included
Perfect colinearity
Why should you avoid dummy variables for all categories of a qualitative variable
it causes the dummy variable trap

In the interaction model above what is the return to education for females
sig1 + sig_int

In a linear probability model with an outcome y, a slope coefficient of -0.03 for x means. An increase in x…
… by once unit reduces the probability that y occurs by 3 percentage points