1B.5-6-7-8
1/34
There's no tags or description
Looks like no tags are added yet.
Name | Mastery | Learn | Test | Matching | Spaced |
|---|
No study sessions yet.
35 Terms
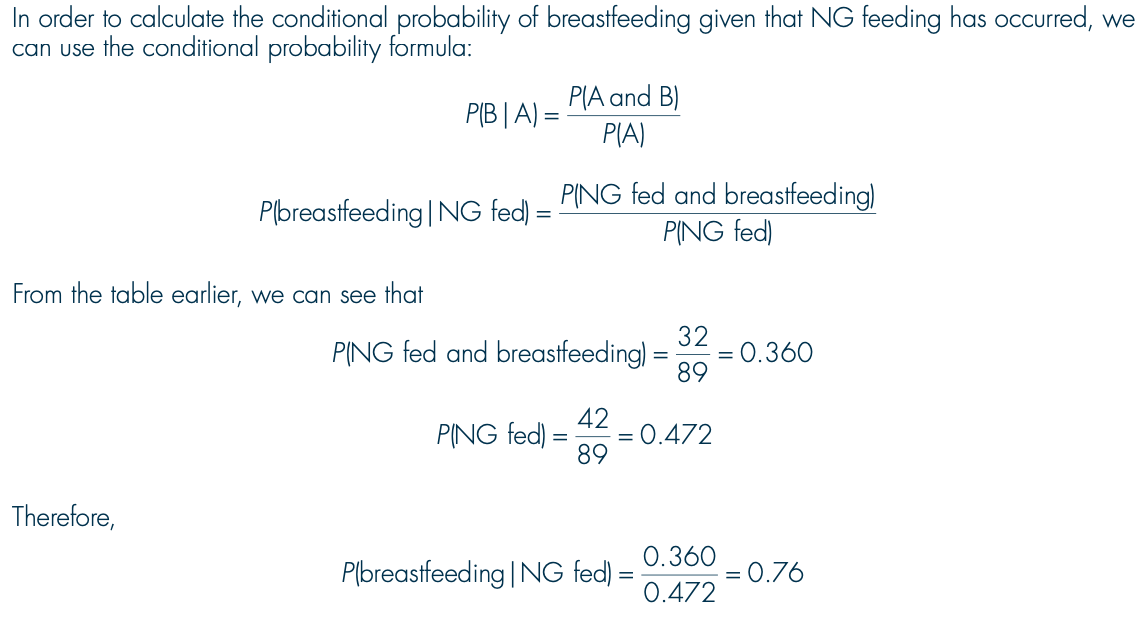
What notation is used for the probability of event B occurring given event A has occurred?
P(B|A)
How do you calculate the probability that an event (B) will occur given that another event (A) has already occurred?
P(A and B) = P(A)× P(B|A)
You need event A to have occurred, and then the condition of B.
In epidemiology, what does conditional probability help researchers evaluate?
How treatments or exposures influence the probability of outcomes (e.g., disease, mortality) and the performance of diagnostic tests.

In this breastfeeding study, what is the probability or “risk” that an infant was breastfeeding at discharge given NG tube feeding?
0.76
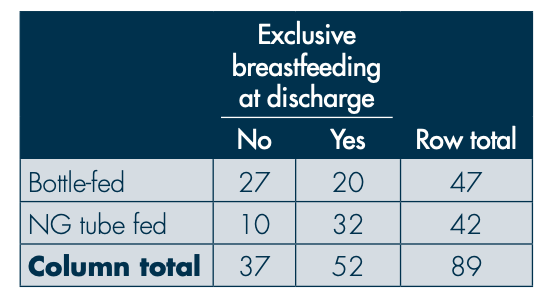
How is the ‘risk’ of breastfeeding among NG-fed infants computed from a 2×2 table?
Risk in statistical terms refers simply to the probability that an event will occur. Absolute Risk (AR) = the number of events (good or bad) in a treated (exposed) or control (nonexposed) group, divided by the number of people in that group. In this scenario, the number of NG-fed infants [exposed] who are breastfeeding at discharge [events] is 32, which needs to be divided by the total NG-fed infants of 42.
Risk = (Number NG-fed infants breastfeeding at discharge) ÷ (Total NG-fed infants) = 32/42 = 0.76
What term describes an arrangement of a variable’s values showing their frequencies?
A statistical distribution
Name the two parameters that fully describe a normal distribution.
Mean (μ) and variance (σ²)
Which theorem states that the sampling distribution of the mean is approximately normal regardless of population shape?
The Central Limit Theorem
What are the mean and variance of a standard normal distribution?
Mean = 0, Variance = 1
How do you convert a normally distributed variable x to a standard normal z-score?
z = (x – μ) ÷ σ
…where the z-score is a measure of how many standard deviations an x value is from the mean, μ= mean of the population of the x value and σ= standard deviation for the population of the x value
Approximately what percentage of observations lie within ±1 standard deviation of the mean in a normal distribution?
About 68%
Approximately what percentage of observations lie within ±1.96 standard deviations of the mean in a normal distribution?
95%
Approximately what percentage of observations lie within ±2.58 standard deviations of the mean in a normal distribution?
99%
Which discrete distribution models the number of successes in n independent trials with two possible outcomes?
The binomial distribution
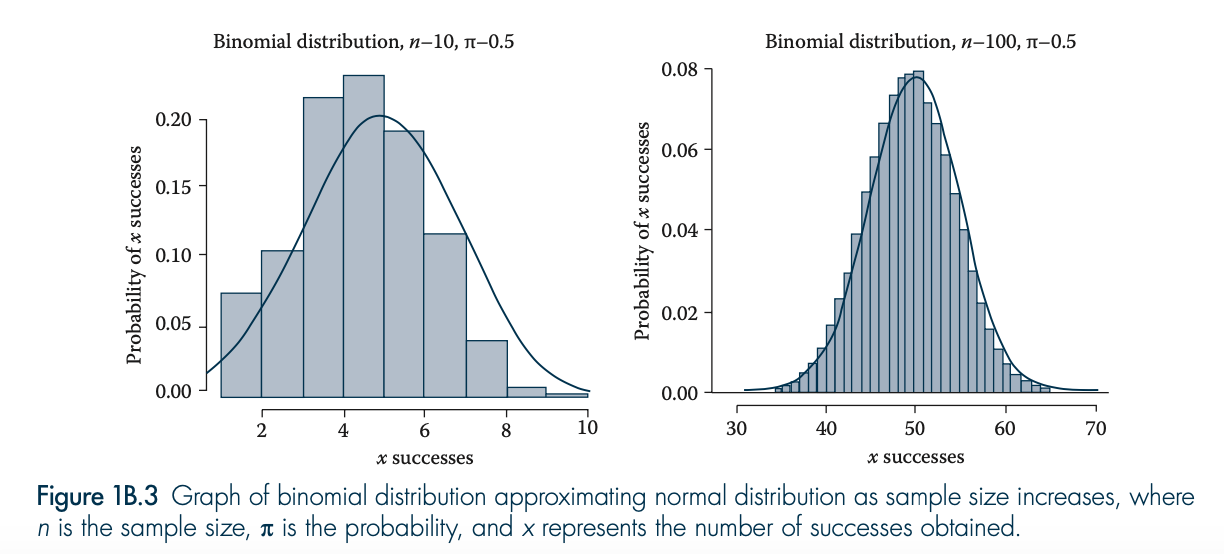
What parameters define a binomial distribution?
Sample size n and true probability π
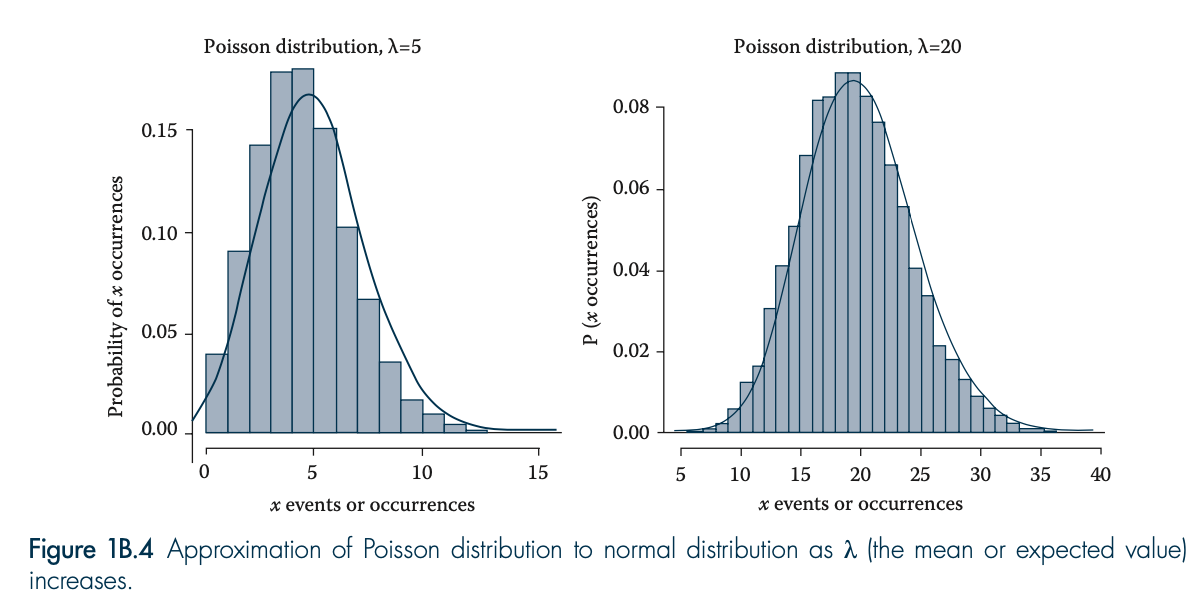
Which distribution models the count of independent events occurring over a fixed time period? Give an example.
The Poisson distribution e.g. rate of deaths due to myocardial infarction
The Poisson distribution leads to a prediction of randomly occurring events, so it allows for what?
It allows a determination to be made as to whether observed events are occurring randomly or not.
What 3 things does the Poisson distribution assume?
that the data are discrete,
that they occur at random,
that they are independent of each other.
In a Poisson distribution, how are mean, variance, and standard deviation related?
Mean = Variance (λ), and SD (σ) = √λ or therefore √mean
What do small and large sample Poisson distributions look like?
Small samples give asymmetrical distributions, and large samples approximate the normal distribution.
What characteristic is shared by both binomial and Poisson distributions regarding possible values?
They contain only non-negative integer values (no negatives).
Which distribution has heavier tails than the normal distribution and is used for small-sample mean inference?
The t-distribution (Student’s t)
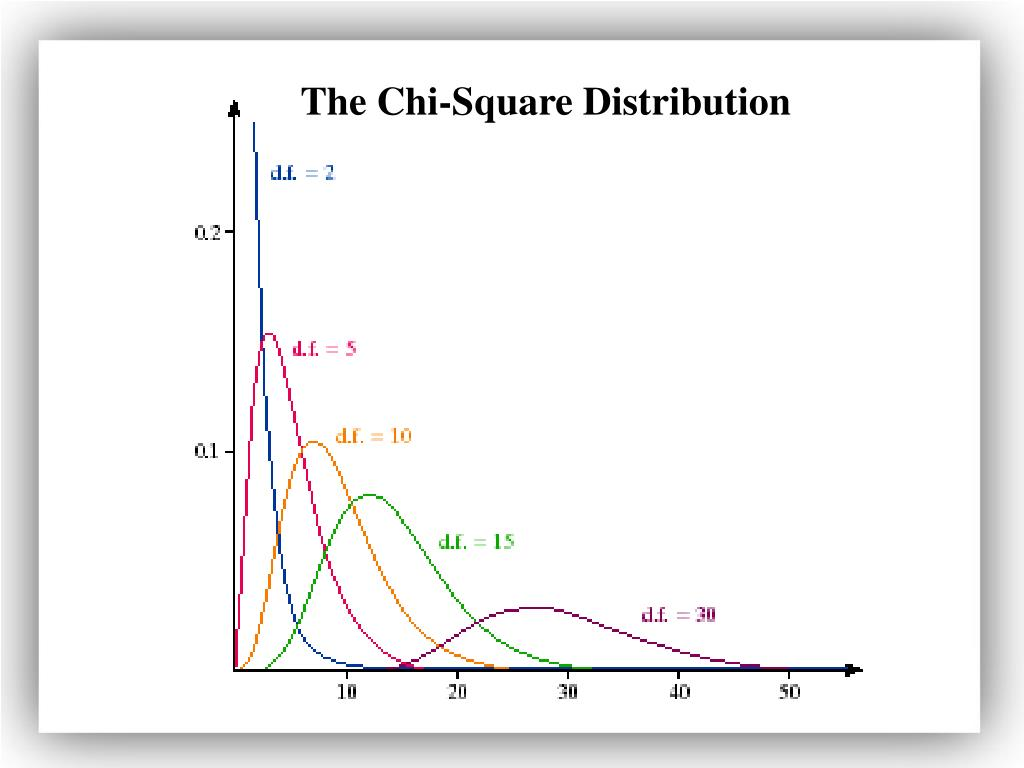
For what purpose is the chi-squared distribution commonly used?
Analysing categorical data (e.g., testing differences between observed and expected frequencies).
What shape is the chi-squared distribution, and what makes it change?
The shape is right- skewed, taking positive values.
With increasing degrees of freedom, it approximates the normal distribution.
When should you use Fisher’s exact test instead of chi-squared?
When any x values are less than 5 with fewer than 40 data points.
Which distribution is used in ANOVA to compare more than two means?
The f-distribution
What is a sampling distribution?
The theoretical frequency distribution of a statistic (e.g., mean, proportion) calculated from many samples of the same size.
What is the shape of the sampling distribution and statistic of choice for a continuous outcome variable?
Normal distribution
Mean
What is the shape of the sampling distribution and statistic of choice for a binary outcome variable?
Binomial (until the sample is large enough to become normal)
Proportion (or risk)
What is the shape of the sampling distribution and statistic of choice for a binary outcome over time variable?
Poisson (until the sample is large enough to become normal)
Rate
What requirement must be satisfied for inferences from a sample to a population to be valid?
The sample must accurately represent the population (i.e., be an unbiased random sample).
Which statistic measures how precisely a sample estimates a population parameter?
The standard error
Define standard error.
Standard error measures how precisely a population parameter (such as the mean, difference in means, or proportion) is estimated by the equivalent sample statistic
What are the two main methods of statistical inference derived from standard errors?
Estimation and hypothesis testing
Distinguish between a point estimate and an interval estimate.
A point estimate gives a single best value for a parameter; an interval estimate (e.g., confidence interval) expresses the uncertainty associated with a point estimate.