Data Mining 1
1/96
There's no tags or description
Looks like no tags are added yet.
Name | Mastery | Learn | Test | Matching | Spaced | Call with Kai |
|---|
No analytics yet
Send a link to your students to track their progress
97 Terms
Tabular Data
Data that’s found in a “table” format.
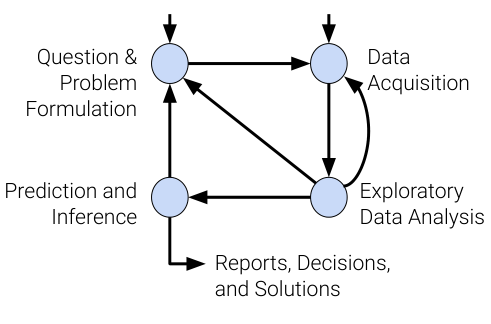
This is the:
Data Science Lifecycle
Tabular Row
A single observation with a group of features.
Tabular Column
A single feature of a group of observations.
pandas
A python library used to manipulate tabular data.
Similar to R.
Dataframe
A table defined by pandas.
Series
A single column of a table as defined by pandas.
Contains an object that holds an index and a value.
Given a series s, s[“a”] returns:
The value in s associated with index a.
Given a series s, s[[“a”,”c”]] returns:
A series that contains the rows in s that are associated with indices a and c.
Given a series s, s>0 returns:
A series that contains every index in s and a bool telling whether or not the value is >0.
Given a series s, s[s>0] returns:
A series that contains every row in s whose value is >0.
Dataframe Index
Defines where a particular row will appear in a dataframe.
Does not have to be numeric or unique.
Given a dataframe df, df.index wil return:
Returns every row from df associated with the index.
Given a dataframe df, df.columns returns:
The name of every column in df.
Given a dataframe df, df.shape returns:
The width and height of df.
Given a dataframe df, df.head(n) returns:
The first n rows from df.
Given a dataframe df, df.tail(n) returns:
The last n rows from df.
Given a dataframe df, df.loc[rows,cols] returns:
All rows specified in rows with only the columns specified in cols from df.
The difference between iloc and loc:
iloc uses the position of the column and row, while loc uses the identifier associated with the column and row.
Given a dataframe df, df[0:3] returns:
Every row from df associated with indices 0 to 3 inclusive.
Given a dataframe df, df[cols] returns:
Every row from df with only the columns specified in cols.
Given a dataframe df, df.loc[:9,:] returns:
The first 10 rows from df with every column included.
Given a dataframe df, df[[True,False,True]] returns:
The 1st and 3rd rows from df.
Given a dataframe df, df[(df[“Sex”]==”F”)] returns:
All rows from df where Sex is equal to F.
Given a dataframe df that has no column testCol, df[“testCol”]=testData will:
Add a column called testCol to df with the rows specified in testData.
Given a dataframe df, df[“col”]=df[“col”]−1 will:
Subtract 1 from every row in the column col from df.
Given a dataframe df, df.rename(columns=“oldCol“:newCol) returns:
A version of df where oldCol is instead called newCol.
Given a dataframe df, df.drop(“oldCol“,axis=”columns”) returns:
A version of df without oldCol.
Given a dataframe df, df.size returns:
The number of individual elements in df.
I.e. Width × Height.
Given a dataframe df, df.describe() returns:
A general summary of df.
Given a dataframe df, df.sample(n) returns:
A random sample of n rows from df without replacement.
Calling this again will not returns any of the same n rows.
Given a dataframe df, df[“col”].value_counts() returns:
How many times each value in col occurs.
Given a dataframe df, df[“col”].unique() returns:
The first occurance of every value in col from df.
Given a dataframe df, df[“col”].sort_values() will:
Sorts the values of col in numeric or alphabetical order.
Given a dataframe df, df.groupby(“Year“) will:
Group the rows in df by the data in Year.
Aggregate Function
A function that looks at more than one row/column at once.
Given a dataframe df, df.groupby(“Year“).agg(sum) returns:
The sum of each unique year in df.
Given a dataframe df, df.groupby(“Year”).size() returns:
The number of rows in df associated with every unique year.
Given a dataframe df, df.groupby(“Year”).count() returns:
Returns the number of values in each column with a non-missing value associated with every unique year.
Given a dataframe df and a command
df.groupby(col).filter(FUNC), what goes in FUNC?
A lambda function that returns either True or False.
Given a dataframe df, df.groupby(val) returns an object of type:
DataFrameGroupBy
Given a dataframe df, df.groupby(val).agg(func) returns an object of type:
DataFrame
Given two dataframes df1 and df2, pd.merge(left=df1,right=df2,left_on=”col1”,right_on=”col2”) returns:
A dataframe that merges df1 and df2 based on col1 and col2.
Given a series S, S.map(func) will:
Apply func to each element in S.
Probability
The frequency with which an event occurs in a collection of independent but identical tries.
P(A∣B) stands for:
The probability that A happens due to B happening.
P(A∣B)=
P(B)P(B∣A)×P(A)
Census
A complete count or survey of a population.
Population
The complete set of individuals being studied.
Survey
A set of questions or measurments.
Sample
A subset of the population.
Inference / Prediction
The act of drawing conclusions about a population based on a sample.
Sampling Frame
A subset of the population that could possibly be in a sample.
Selection Bias
Systematically excluding particular groups.
Response Bias
Respondants don’t always respond truthfully.
Population Parameter
A number that describes something about the population.
Sample Statistic
An estimate of the number computed on a sample.
Cenertal Limit Theorem
Given a sample is large enough, its distribution will always resemble a normal distribution and will be centered at the population mean.
Sample Space
All possible outcomes for some random event.
Until an experiment occurs a random variable:
Does not hold a value.
Probabilities
The chance that a random variable will take each possible value.
X∼F(p) means:
The random variable X has a distribution F with a parameter p.
Null Hypothesis
The “default” hypothesis given a scenario.
P-Value
The probability that a given hypothesis could occur.
Standard Deviation (SD) =
SampleSizePopulation SD
Square Root Law
Increasing the sample size by a factor will decrease the SD by the square root of the factor.
Convergence
When two or more series of values drift towards the same value.
Expectation
The weighted average of the possible values of a random variable.
The weights are the probabilities of the values.
Given X is a random variable and x is a possible value of X, Expectation =
all possible x∑xP(X=x)
Exploratory Data Analysis (EDA)
The process of iteratively asking and answering more questions about a dataset.
The EDA process:
Question
Investigate
Interpret
Repeat
Model
An idealized representation of a system.
Deterministic Physical Models
Laws that govern how the world works.
Reasons for building models:
To explain complex phenomena.
To make accurate predictions.
To make casual inferences.
Model Evaluation Statistics:
Error
Bias
Variance
Bias
How close a model is to the estimate (on average) to the parameter.
Variance
How spread out the estimate is.
Mean Squared Error (MSE) given θ^ =
E((θ^−θ)2)
Bias given θ^ =
E(θ^−θ)=E(θ^)−θ
Variance =
n1i=1∑n(xi−xˉ)2
Simple Linear Regression (y^) =
θ0+θ1x
The Modeling Process:
Choose a model.
Choose a loss function.
Fit the model.
Evaluate model performance.
Loss Function
Characterizes the cost / error / fit resulting from a particular choice of model and parameters.
Squared Loss / L2 Loss (L(y,y^)) =
(y−y^)2
Absolute Loss / L1 Loss (L(y,y^)) =
∣y−y^∣
Covariance =
n1i∑(yi−yˉ)(xi−xˉ)
Multiple Linear Regression (y^) =
θ0+θ1x1+…+θpxp
L2 Vector Norm given an nth dimensional vector =
i=1∑n(xi2)
Span
The set of all possible linear combinations between two columns of a matrix.
Deductive Reasoning
Reasoning based on nature / tradition.
Inductive Reasoning
Reasoning based on the observations made.
dxdz=
y^dz×dxy^
Multiple Linear Regression assumes that…
Every included parameter has no relationship.
Gradient Descent
Finding the lowest value by stepping in either direction based on the slope.
Given gradient descent and a learning rate α, xt+1=
xt−αdxdf(xt)
Gradient Descent stops after…
A fixed number of updates or the change in results is too low.
MSE for Linear Regression (R^(θ)) =
n1i=1∑n(yi−(θ0+θ1x))2