T-tests
1/10
There's no tags or description
Looks like no tags are added yet.
Name | Mastery | Learn | Test | Matching | Spaced | Call with Kai |
|---|
No analytics yet
Send a link to your students to track their progress
11 Terms
What is a t-test
Used to compare two means (or medians)
Not good for repeated comparisons (use ANOVA)
ex: performing 3 t-tests for same data
What are the types of t-tests
one sample t-test
student’s (unpaired) t-test
paired t-test
Describe one-sample t-test
Compares a sample mean to a given population mean
Requires normally distributed population and population mean is known
Population doesn’t need to be the overall population, can be a subset within the population
Sample SD won’t have a normal distribution because it is NOT a population SD
Still need two means (one is yours (sample) and the other is the population)
One sample is compared to a population
Is there a significant difference between the sample and population?
Can be one-tailed OR two-tailed
NEED:
Sample mean, sample SD, population mean, sample size (n), table of critical t-values or simple computer statistical program
Ex: The six students get scores of 67, 89, 77, 68, 83, 98. Can the professor be at least 95% certain that the mean score for the class on the test would be at least 70?
Sample = the 6 students
Population = the class
CLASS:
ONLY ONE THAT SAMPLE IS COMPARED TO THE POPULATION
compared to larger population/larger group/subset of larger group
sample mean vs population mean
Describe a student’s t-test
Compares two sample means. Therefore is a TWO sample t-test
Two sample groups
Is one sample mean significantly different from the other?
Requires two normally distributed but independent populations, population mean is unknown
Is there a difference between control group and experimental group
Needs:
Two sample, means, two sample SD, both sample sizes (n), & table of critical t-values or stats program
Ex: An experiment is conducted to determine whether a new gasoline additive can increase the gas mileage of SUVs. SUVs were chosen randomly and put into either the “additive” group or “no additive” group. Gas mileage was determined for the vehicles in each group
Sample 1= Additive group
Sample 2= no additive group
CLASS:
Comparing 2 samples to each other
looking at the same dependent variable in both samples (ONLY 2 SAMPLES)
Describe a paired t-test
Compares one set of measurements with a second set of measurements from the SAME sample (“goes together”)
Requires a set of paired observations from a normal population
More powerful than an unpaired because most extraneous values will be the same across both treatment conditions
Limited amount of growth or change in the extreme values (example: if you have a 90 can only get 10 more points on a test)
Compare the “before” and “after” of the same sample
Two sample groups
Ex: Does a week of tutoring help a group of students improve their scores on a calculus test?
Sample 1= Before tutoring
Sample 2= After tutoring
CLASS:
ONE SAMPLE @ 2 DIFFERENT POINTS IN TIME
before and after activity/research experiment
SAME SAMPLE at 2 different points in time
If there is 3 points in time (it is repeated measures ANOVA)
What are the 4 assumptions made when performing t-tests
Normal/gaussian distribution
Randomly sampled
Equal variances
Large sample with larger variances, test is less powerful
Concern if null is not rejected
If smaller sample has large variance, type 1 error increases
Concern if null is rejected
t-test with unequal variances can be modified to compensate (Welch corrected)
Data measured on interval or ratio scale
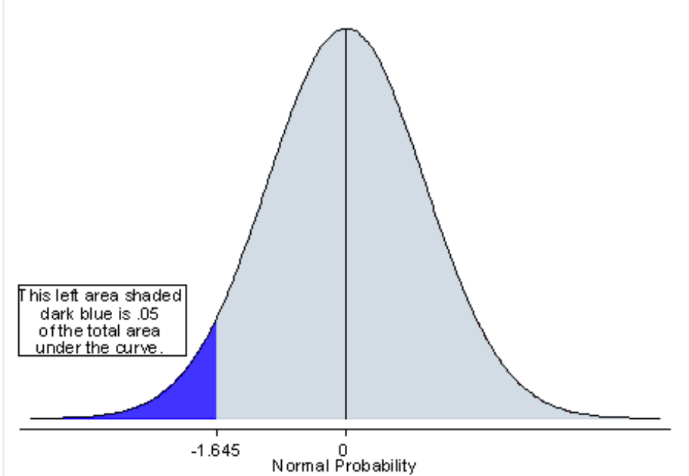
What is a one-tailed test
One-tailed = a directional hypothesis
Expect to see one group to shift in a particular direction
Put 0.05 on one side of the curve
More likely to make type 1 error
Because don’t travel as much from the start to 0.5 end
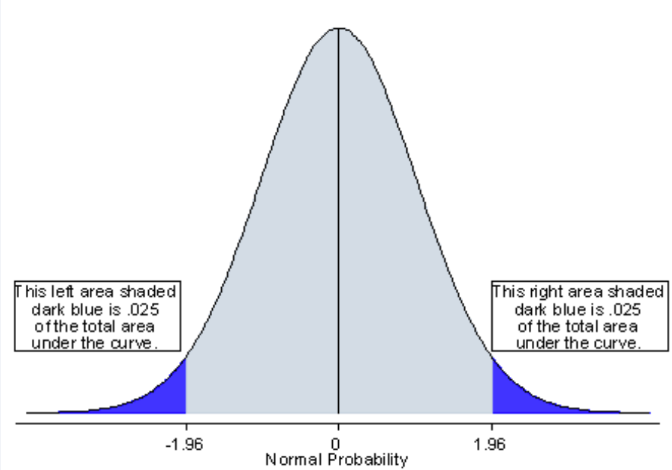
What is a two-tailed test
Two-tailed = more conservative than one-tailed because it takes a more extreme stat to reject null hypothesis
Splits the 0.5 on both sides of the curve
0.25 on each end of the curve
Bigger difference between 0 (start point) to the 0.25 region
What are some scenarios you would use a particular “tailed” test
One tailed test = must be specific reason why you would only expect a difference in one direction
Two tailed test = if there’s a possibility that the difference could be in either direction, even if hypothesis is directional
How do you interpret a p value in context to a research question
Alpha = 0.05
If P is less than 0.05, then results ARE significant
Null hypothesis rejected
If P is greater than 0.05, then results are NOT significant
Because too great of a chance to have a false positive
Null hypothesis accepted
Given a research question or scenario, pick the appropriate statistical test to analyze the data
think of examples from class
one-way = 1 sample in the study that will be compared to the population
student’s = 2 different samples (control and experimental) that are compared to each other
paired = 1 sample that is measured twice. Ex: the weight of a group “before” and “after” testing Ozempic