Gene set analysis, Polyploidy bioinformatics and single cell analysis
1/20
There's no tags or description
Looks like no tags are added yet.
Name | Mastery | Learn | Test | Matching | Spaced | Call with Kai |
|---|
No analytics yet
Send a link to your students to track their progress
21 Terms
Synonymous mutations
mutations in the genes that do not change the sequence of the protein. They accumulate over time and function as a molecular clock
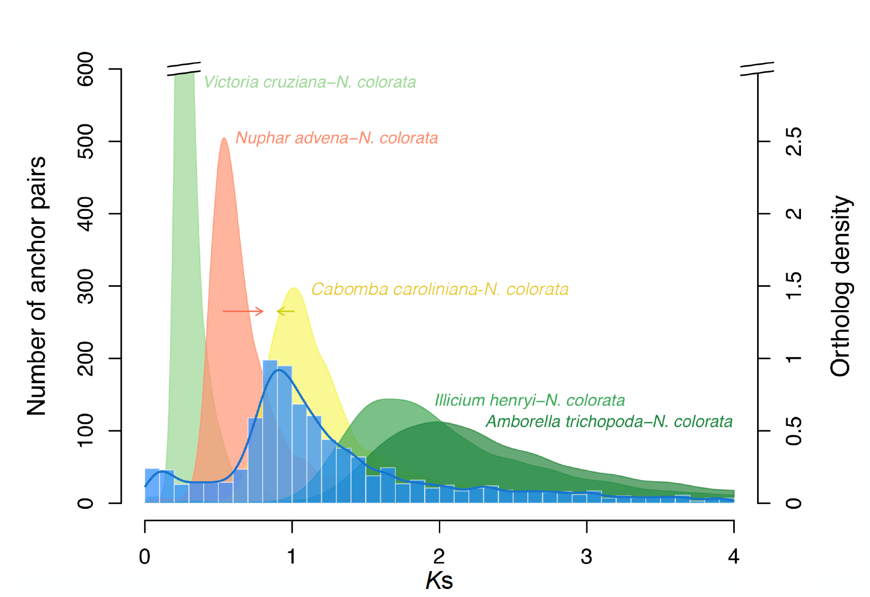
Ks distribution
histogram showing the number of duplicate gene pairs plotted against their Ks values (synonymous substitutions per synonymous site). Peaks in this distribution can signal large-scale duplication events, such as WGDs.
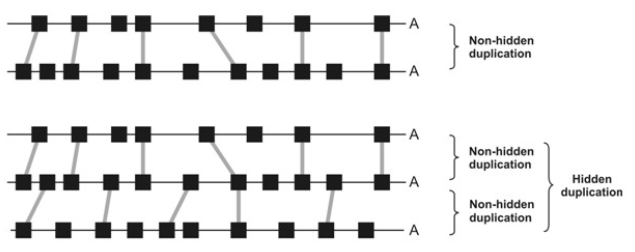
hidden duplications
highly degraded duplicated blocks within a genome. They are too eroded to be clearly recognized by directly comparing two duplicated segments. However, they can be detected when you introduce a third similar region from the same genome.
Ghost duplications
ancient duplications only visible through inter-species genome comparisons due to loss or rearrangement of internal duplication signals.
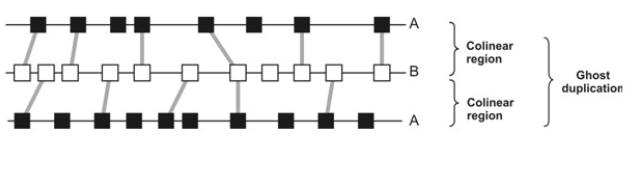
Double conserved synteny
Strong genomic signature for detecting ancient genome duplications, especially when internal evidence in one genome has eroded. Organism 1 (with a duplicated genome) and Organism 2 (without duplication). Over time, Organism 1 loses some duplicate genes in each copy. But when you compare Organism 1 to Organism 2, you notice that two regions in Organism 1 match the same region in Organism 2.
transitive homology
the idea that if segment A is homologous to segment B, and segment B is homologous to segment C, then segment A is also considered homologous to segment C — even if A and C no longer show strong similarity directly. This concept helps uncover ancient or highly diverged duplication events by connecting segments through intermediate links.
relative timing of WGD
Relative timing refers to determining the order of events without knowing their exact dates. In the context of genome duplications, it means figuring out whether a whole genome duplication (WGD) happened before or after the divergence of two species — for example, "the WGD occurred after species A and B split from a common ancestor."
It’s based on comparing Ks (synonymous substitution) values of paralogs (gene duplicates) and orthologs (genes between species) to place events in a timeline relative to each other, not in absolute years.
functional enrichment analysis
method used to determine whether a predefined set of genes shows statistically significant differences in expression across different conditions or treatments.
Gene Set Enrichment Analysis (GSEA)
Tool that calculate if functional enrichment analysis is statistically sifgnificant. For this the genes should be ranked on based on how much their expression differs between two conditions (control and treated) Best option
Fisher’s Exact Test and Hypergeometric Test
Tool that calculate if functional enrichment analysis is statistically sifgnificant. These tools can be used when no ranks are available.
Leading-edge subset
Small set of genes within a gene set that contribute the most to the Enrichment Score (ES).The Leading-edge genes are the genes that are closest to the peak of the Enrichment Score curve. Depending on where the peak falls (positive or negative ES), the Leading-edge subset consists of:
If the ES peak is positive, the Leading-edge genes are the genes before the peak in the ranked list (those that are most upregulated).
If the ES peak is negative, the Leading-edge genes are the genes after the peak in the ranked list (those that are most downregulated).
Molecular Signatures Database (MSigDB)
collection of gene sets that represent biological processes, pathways, or molecular functions. These gene sets are curated from scientific research and public databases. In Gene Set Enrichment Analysis (GSEA), MSigDB provides the gene sets you can use to see if a specific group of genes in your dataset is significantly upregulated or downregulated in your study.
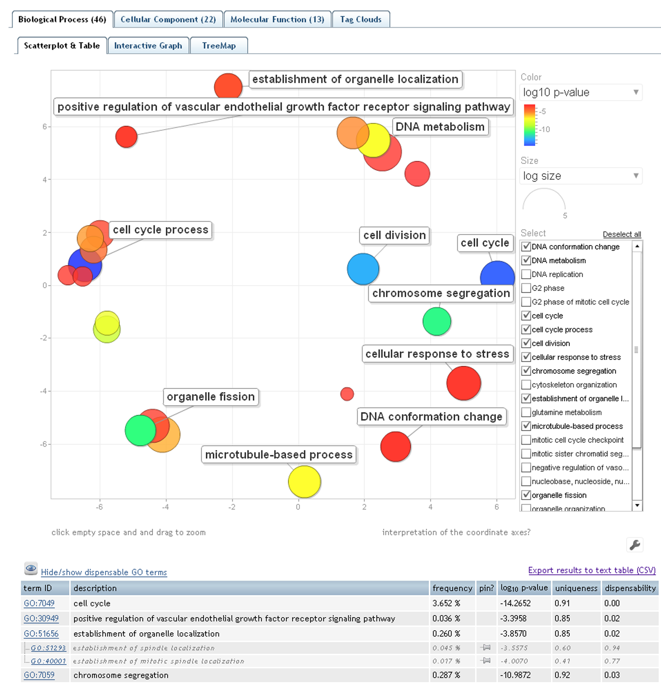
REVIGO
visualizes this non-redundant GO term set in multiple ways to assist in interpretation
i-CisTarget
Tool designed for transcription factor (TF) binding site enrichment analysis. It allows researchers to identify potential transcription factors that may regulate the genes in a gene set, based on their DNA sequence. It does so by comparing the promoter sequences of the genes in the set to a database of known transcription factor binding motifs.
TF2Network
it builds and visualizes transcription factor networks based on gene expression data and transcription factor target information.
Input: set of genes that is differentially expressed/involved in a process and the database contains data of known transcription factor-target gene relationships.
Advantages of plate-based sc-RNA-seq
It is better at finding rarer cell types, it can cover the full length of a transcript and thus find mutations.
Cell hashing
technique in single-cell RNA sequencing (scRNA-seq) that uses oligo-tagged antibodies to label cells from different samples with unique molecular barcodes. These labeled cells can then be pooled together in the same sequencing run. After sequencing, the barcodes allow researchers to identify the original sample of each cell, enabling multiplexing (combining multiple samples), detection of cross-sample contamination (multiplets), and significant cost savings by analyzing more samples in one experiment.
10x chromium
Tool where a barcoded bead will be enclosed in a water droplet in oil together with reverse transcriptase and 1 cell. The beads have nucleic acid seq: a cell barcode that is the same on the whole bead and a UMI that is unique. When RNA gets amplified to cDNA, reads with a different UMI (Unique Molecular Identifier) that map the same transcript came from a different RNA molecule. The same UMI => from the same original RNA molecule.
k-nearest neighbor algorithm
CellRanger mkfastq
Tool that demultiplexes data into FASTQ-files.
SoupX
tool that corrects for ambient RNA by first estimating ambient RNA in empty droplets