data analysis final
1/62
There's no tags or description
Looks like no tags are added yet.
Name | Mastery | Learn | Test | Matching | Spaced |
|---|
No study sessions yet.
63 Terms
What does DCOVA stand for?
Define Collect Organize Visualize Analyze
mark all true statements about logical causality and correlation
-correlation means that one variable changes or moves in a way that appears somehow connected to another
-even if it does not cause the change, either may describe the relationship between two or more variables
-logical causality means that one variable causes or determines another
classify this variable by type - “income level” - entries — low, medium and high
categorical-ordinal
classify this variable by type: religion, entries — christian, muslim, jewish, hindu, buddhist, other, none
categorical - nominal
classify this variable by type: number of appointments, values — 4,6,8,2,1,0,2
numerical, discrete
classify this variable by type: temperature f, values — 92, 84, 73, 67, 51, 49, 33, 19, 2, -3
numerical - continuous - interval
classify this variable by type: weight-kg entries — 12, 8, 10, 4, 2.6, 1.7, 0.1, 7.6
numerical - continuous - ratio
what is the difference between structured and unstructured data
structured data usually appears in tables of columns and rows, while unstructured normally does not
which term or notation applies to populations and which to samples
n and statistic: sample
N and parameter: population
the probability sampling technique where every item has the same, equal chance of being selected is called a
simple random sample
mark the probability sampling techniques, not the non probability
stratified, simple random, and systematic
when gathering a sample data via survey, it is a good practice to assume that the presumed responses of those who did not respond would be the same or very similar to those that did respond
false
the three numerical measures of central tendency are
mean, median, mode
match the measures with their definitions
-median: the number in the middle, or the number of values in the sample plus 1, divided by 2
-mode: the value in the sample that appears most frequently
-maximum: the largest value
-range: the difference between the largest value and the smallest
-mean: sum of the values in a sample divided but the number of values in the sample
-minimum: the smallest value
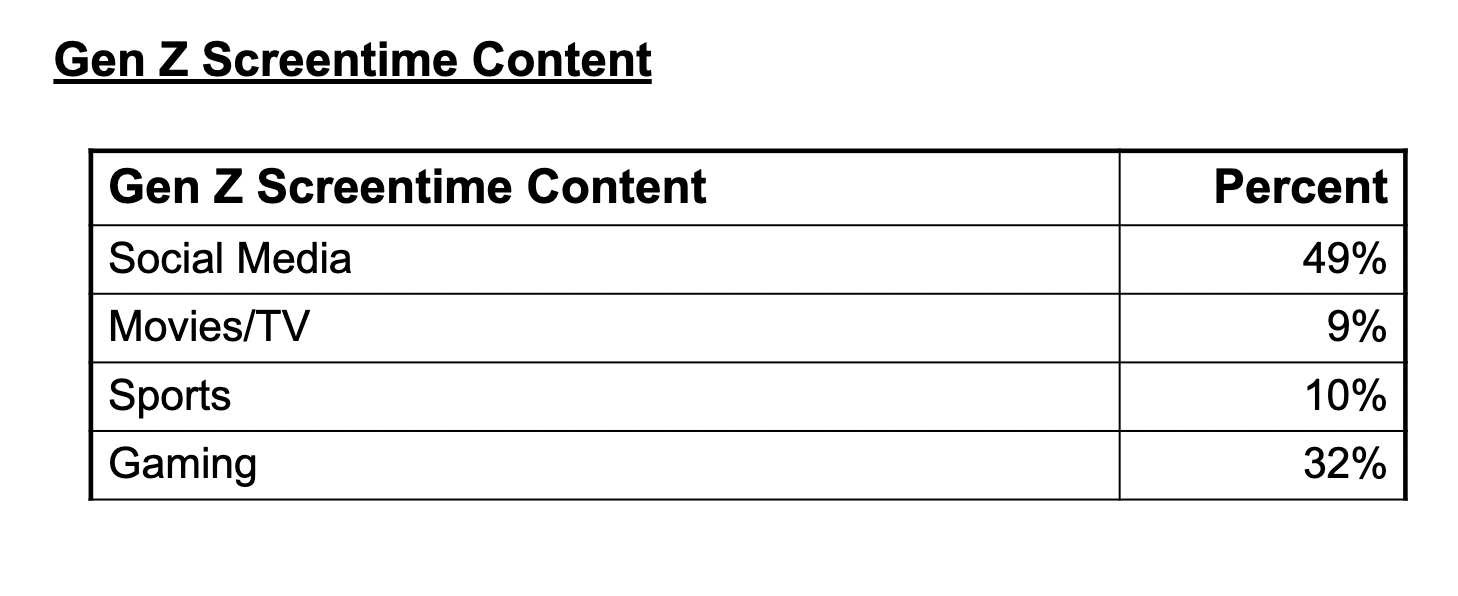
what type of table/chart is this?
summary table
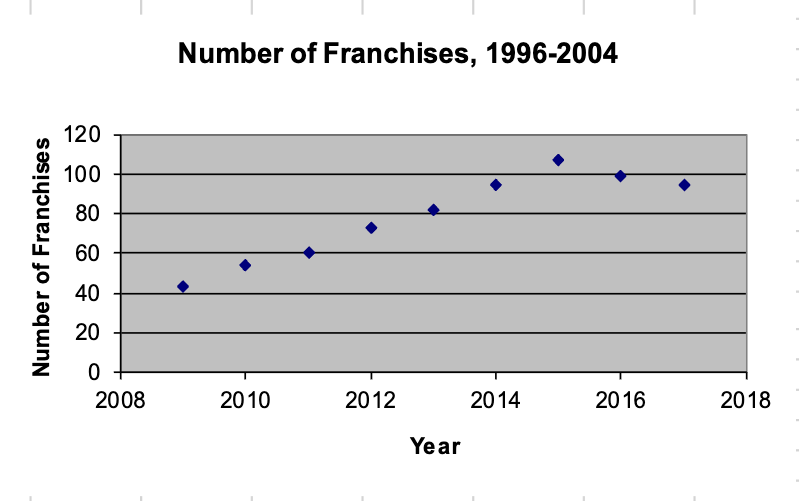
what type of table/chart is this?
time series plot
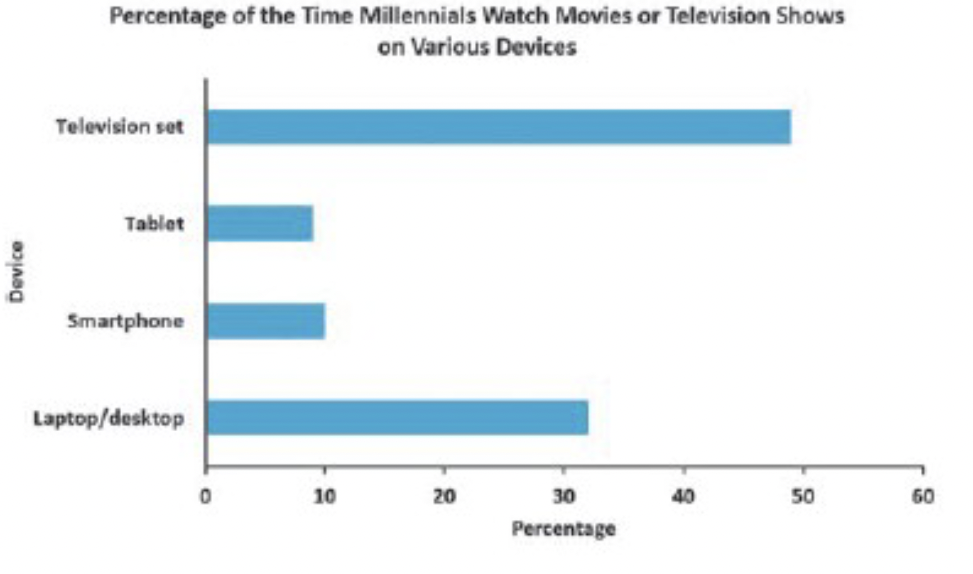
what type of table/chart is this?
bar chart
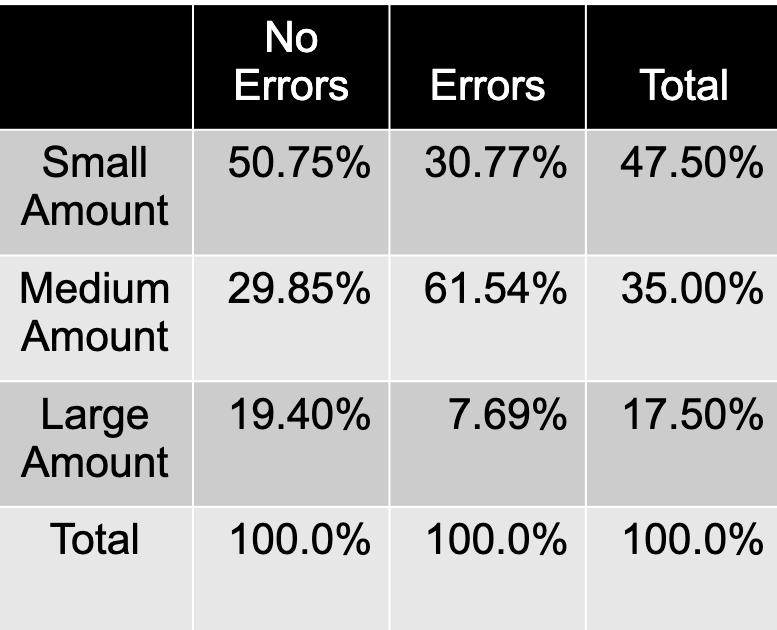
what type of table/chart is this?
contingency table
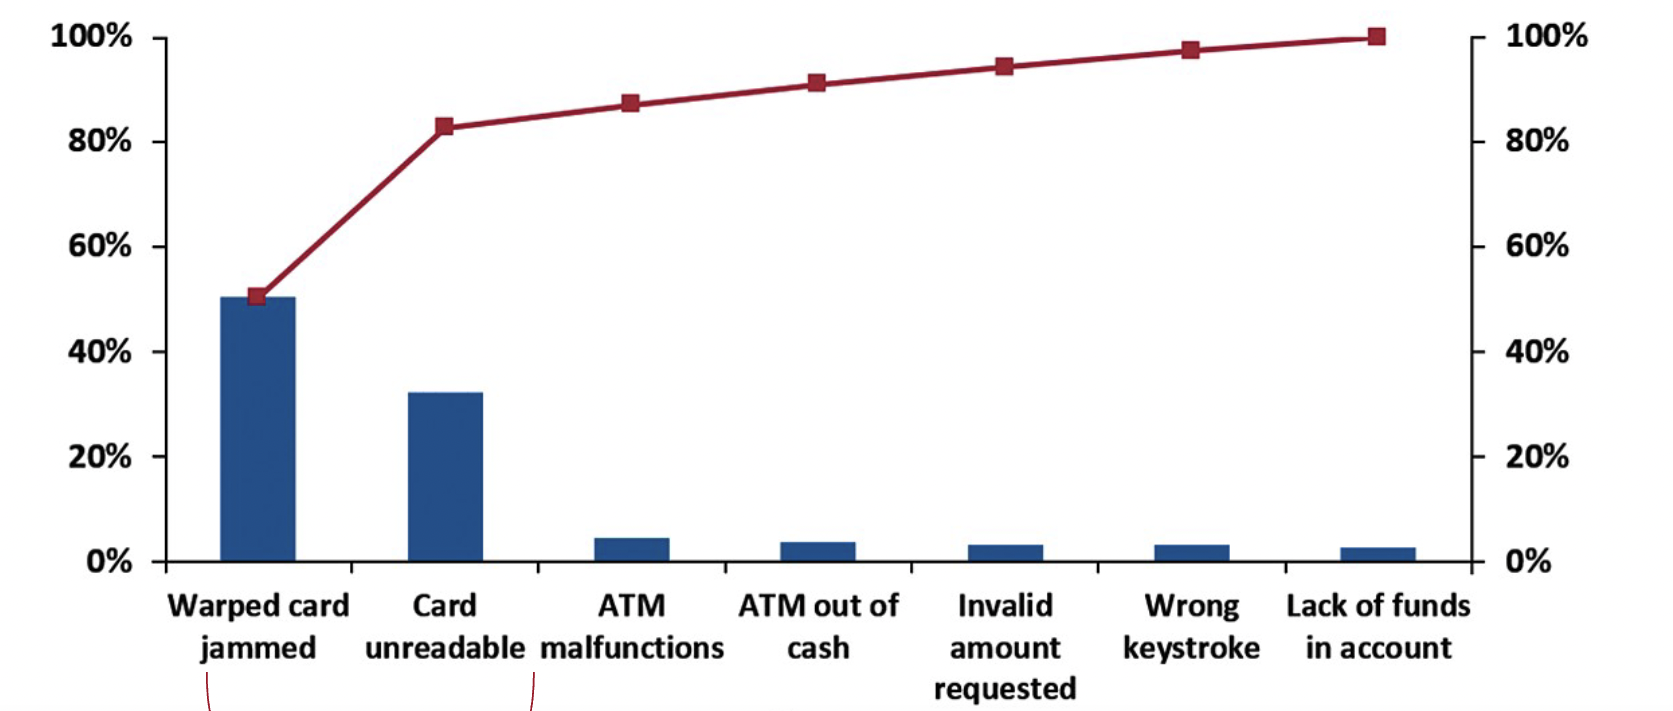
what type of table/chart is this?
pareto chart
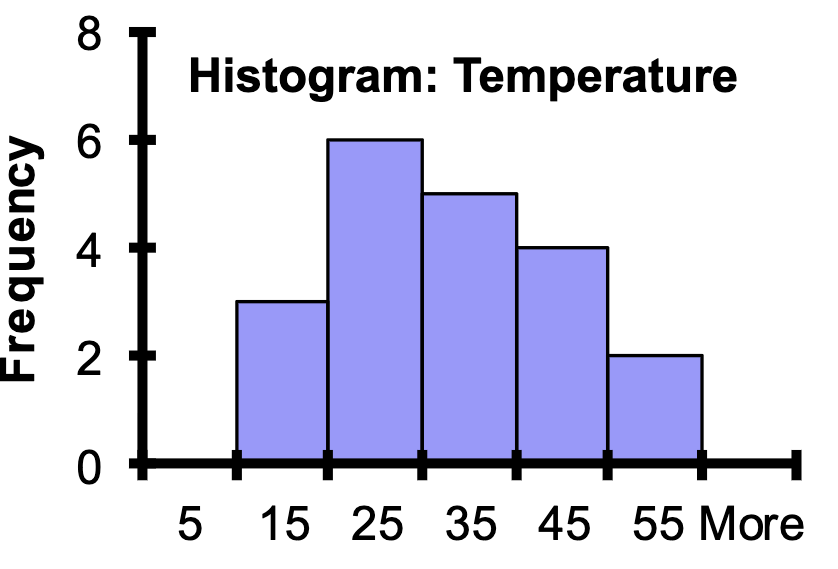
what type of table/chart is this?
histogram
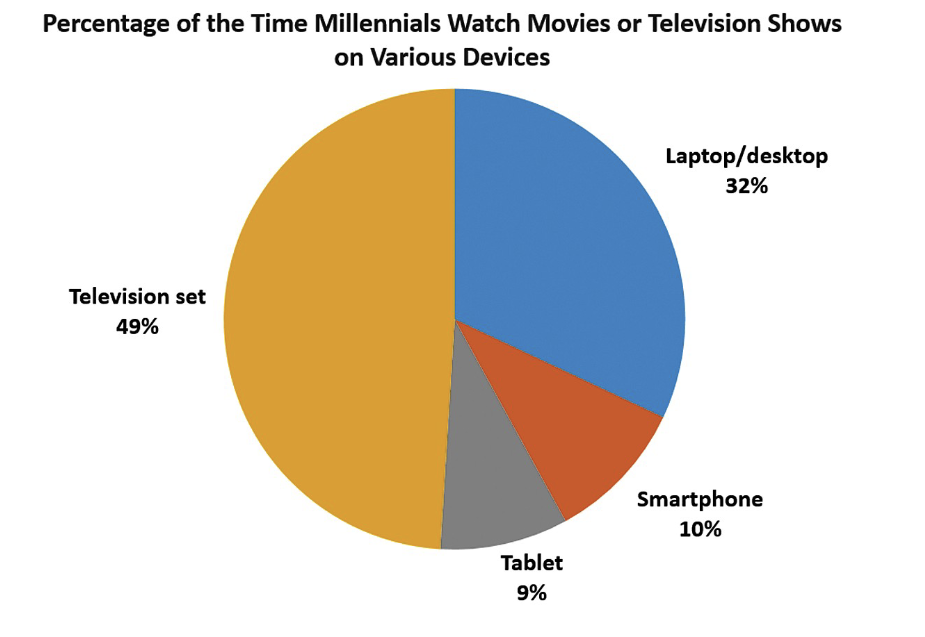
what type of table/chart is this?
pie chart
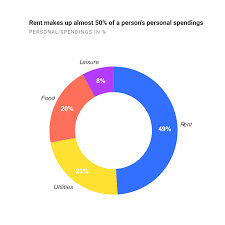
what type of table/chart is this?
donut chart
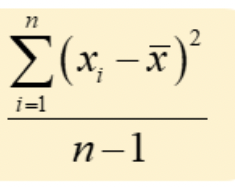
what formula is this used for?
sample variance
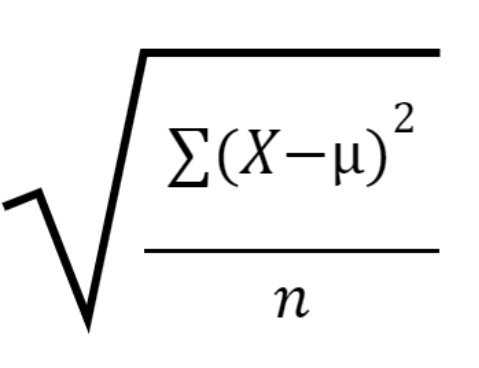
what formula is this used for?
population standard deviation
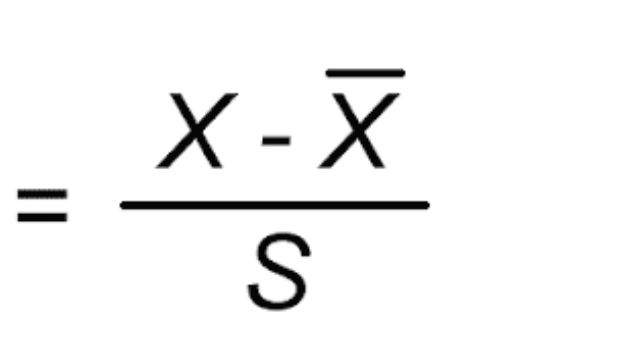
what formula is this used for?
z-score
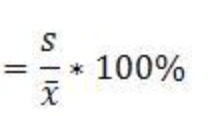
what formula is this used for?
coefficient of variation
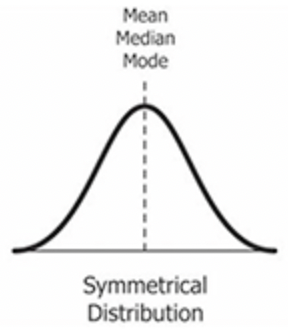
what is the appropriate skewness for this curve?
zero skew
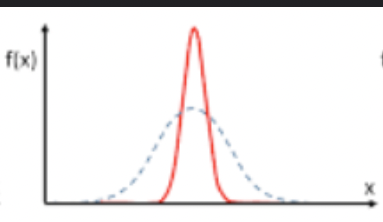
match the red curve with the appropriate skewness or kurtosis value
positive kurtosis
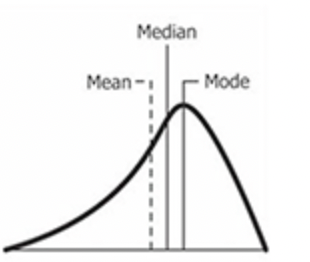
what is the appropriate skewness for this curve?
negative skew
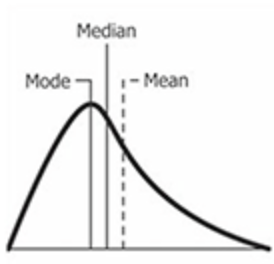
what is the appropriate skewness for this curve?
positive skew
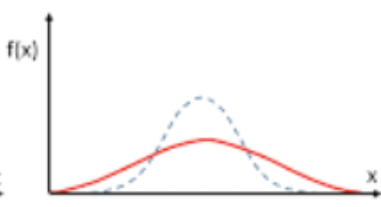
match the red curve with the appropriate skewness or kurtosis value
negative kurtosis
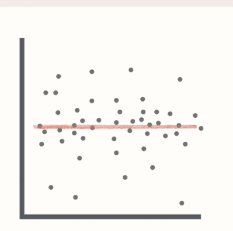
in this graph, is the coefficient of correlation between 0 and 1, between 0 and -1, or just 0
zero correlation
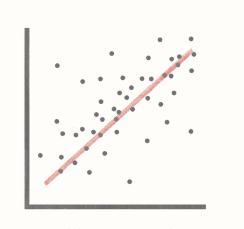
in this graph, is the coefficient of correlation between 0 and 1, between 0 and -1, or just 0
between 0 and 1
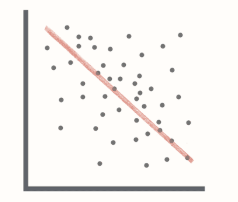
in this graph, is the coefficient of correlation between 0 and 1, between 0 and -1, or just 0
between 0 and -1
a goodie bag holds 8 ghirardelli dark chocolates and 6 smarties. each person in a group of 14 may choose one. What is an example of a simple event?
the second person choose a ghirardelli dark chocolate
A goodie bag holds 8 ghiradelli chocolates and 6 smarties. each person in a group of 14 may choose one. What is the complement if the first candy chosen being a ghiradelli dark chocolate?
the first candy selected being a smartie
a goodie-bag holds 8 ghirardelli dark chocolates (G) and 6 smarties (S). each person in a group of 14 may choose one. What does the sample space consist of?
G or S
In determining probability, a simple event has how many characteristics?
1
In determining probability, a joint event has how many characteristics?
2 or more
a sample of products coming off an assembly line are classified as defective or not defective.
the events are both mutually exclusive and collectively exhaustive
Cell phone users were asked if they sent 1000 or fewer text messages per month, more than 1000 text messages per month, or 2000 text messages per month
the events are only collectively exhaustive
A sample of registered voters in the US are all classified as either republican or democrat.
the events are mutually exclusive
a certain event has a probability of
1
an impossible event has a probability of
0
the sum of probabilities of all mutually exclusive and collectively exhaustive events in an event space is
1
venn
does not exist as a type of probability
subjective
based on a combination of an individual’s past experience, personal opinion and analysis
a priori
based on having full knowledge of all outcomes that can occur
empirical
based on observed data, without full knowledge of all the outcomes that can occur
counting rules are for
computing number of ways that a set of items can be arranged in order, calculating the number of possible outcomes in a sample space
Both permutations and combination counting rules calculate the number of ways a subset of x objects can be selected from a total number of n objects. the difference is that in combinations the order of the objects does not matter, and in permutations order does matter
true
Which probability distribution would you use to solve this problem?
The US Department of Transportation maintains statistics for mishandled bags per 1000 airline passengers. In September 2019, United mishandled 1.45 bags per 1000 passengers. What is the probability that in the same month, for a group of 1000 passengers, United will have mishandled no bags, one bag, or at least two bags?
poisson
Which probability distribution would you use to solve this problem?
A small town kept records on the incidence of traffic accidents per month. What is the expected number of accidents per month? What is the probability that there will be fewer than two accidents per month?
discrete
Which probability distribution would you use to solve this problem?
Home Depot has a system that tags online orders as correct or incorrect, based on the presence of errors in each order. the historical probability of a tagged order is 7.29%. what is the probability that in the next 30 orders, none are tagged, one is tagged, or at least two are tagged.
binomial
The normal distribution occurs regularly in both nature and in raw, unsampled business data, which explains the name
false
the distribution of the means of all samples taken from a population tends to hahe a normal distribution, no matter how skewed or irregular the population’s data distribution is
true
according to the central limit theorem, samples of 2-4 tend to have a distribution of means that is approximately normal, while those that have at least 30 tend to mirror the population’s particular distribution of data values
false
which excel guidebook would you use to complete the task below
a marketing researcher wants to estimate the mean amount spent on amazon.com by amazon prime member shoppers. suppose a random sample of 100 amazon prime member shoppers who recently made a purchase on amazon.com yielded a mean of 1,500 dollars and a standard deviation of 200 dollars. construct a 95% confidence interval estimate for the mean spending for all amazon prime member shoppers
CIE sigma unknown
which excel guidebook would you use to complete the task below
in a survey of 1003 adults complaints about restaurants, 732 complained about dirty or ill-equipped bathrooms and 381 complained about loud and distracting diners at other tables. construct a 95% confidence interval estimate of the population proportion of adults who complained about dirty or ill-equipped bathrooms
CIE proportion
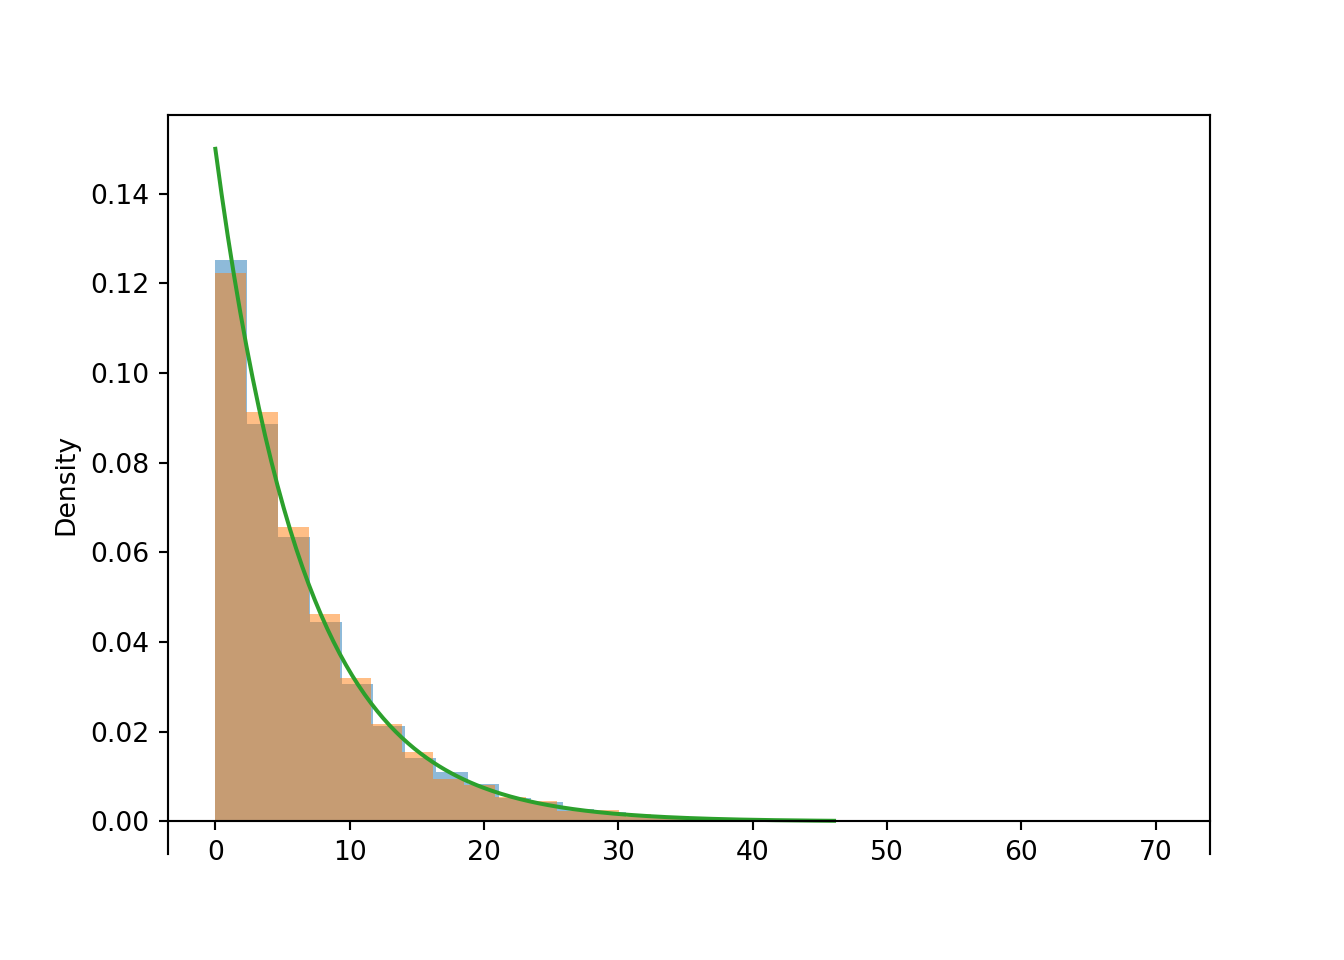
which kind of continuous probability distribution is this?
exponential
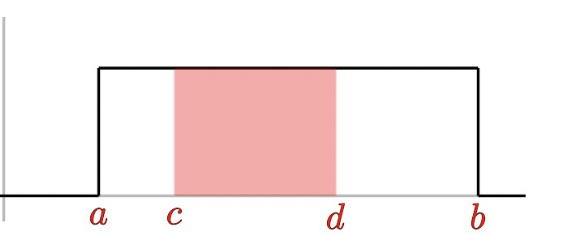
which kind of continuous probability distribution is this?
uniform
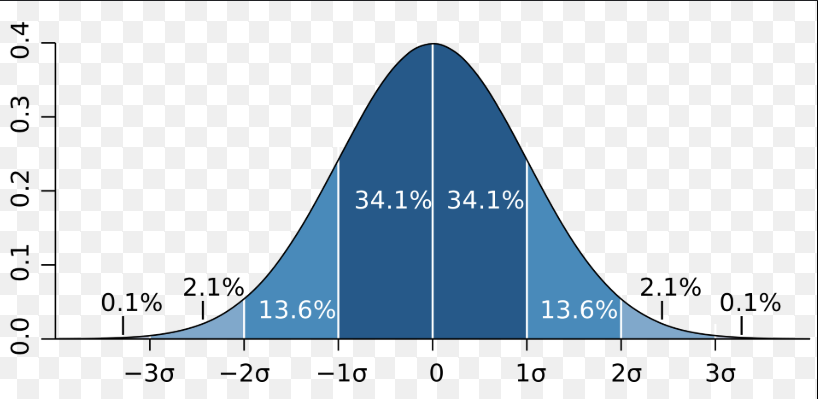
which kind of continuous probability distribution is this?
normal
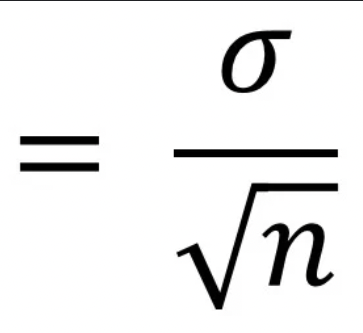
what formula is this?
standard error of the mean