CH 3 - Displaying data
1/12
There's no tags or description
Looks like no tags are added yet.
Name | Mastery | Learn | Test | Matching | Spaced |
|---|
No study sessions yet.
13 Terms
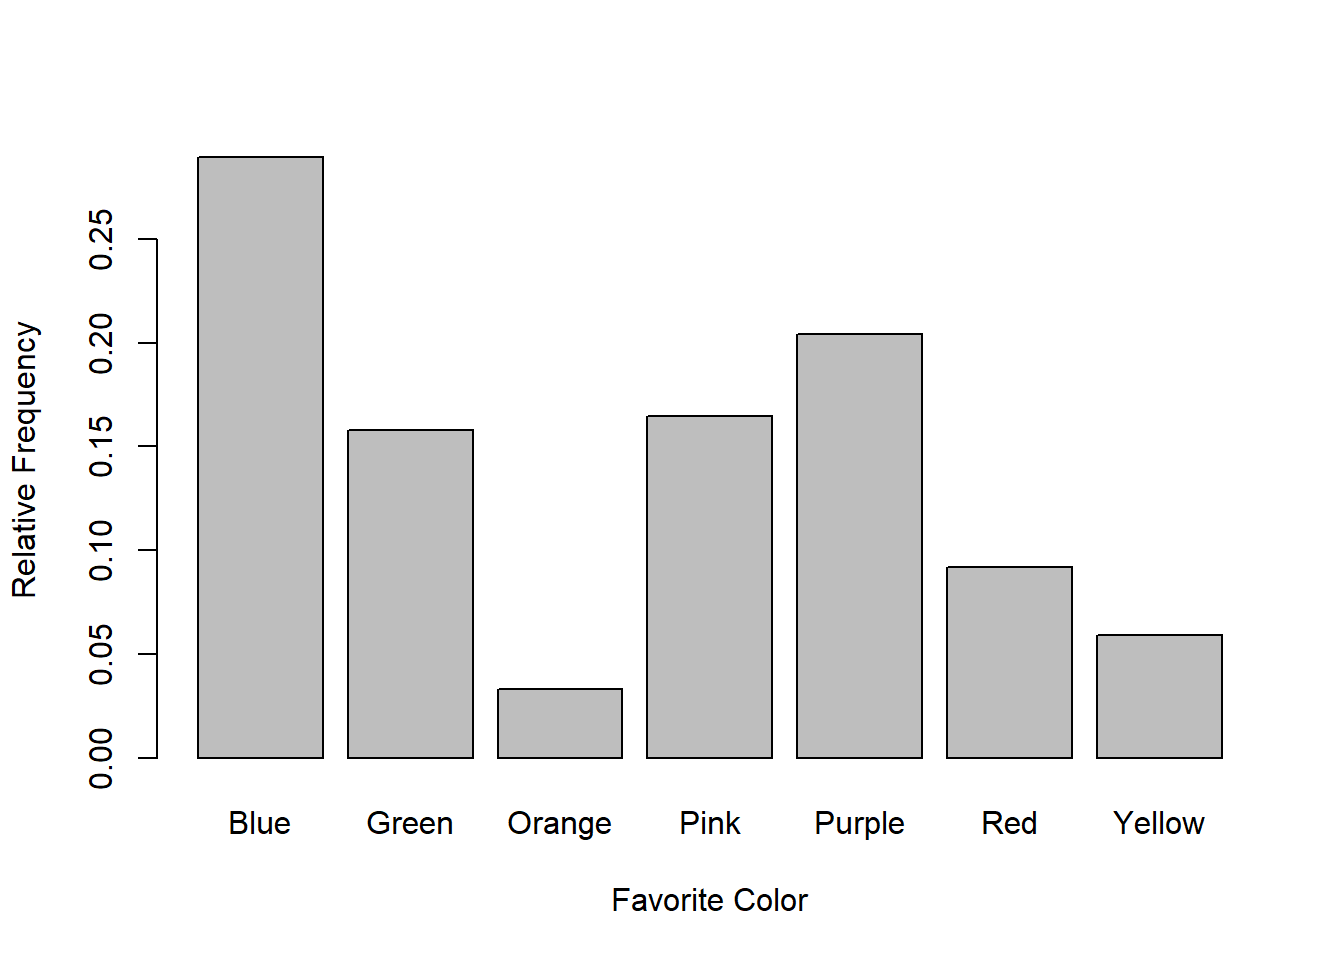
Frequency distribution
Graphical representation of the number of individuals in each category on the scale of measurement.
Real lower limit
lower bounds for an interval
(I.E a score equal to or greater than 1.895000 and less than 1.995000 would fall in the 1.90–1.99 interval)
real upper limit
upper bounds for an interval
(I.E a score equal to or greater than 1.895000 and less than 1.995000 would fall in the 1.90–1.99 interval)
midpoint
Center of an interval
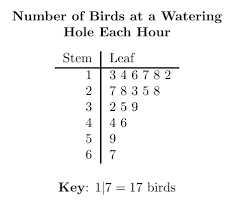
Stem and leaf display
technique used to classify either discrete or continuous variables. Used to organize data as they are collected
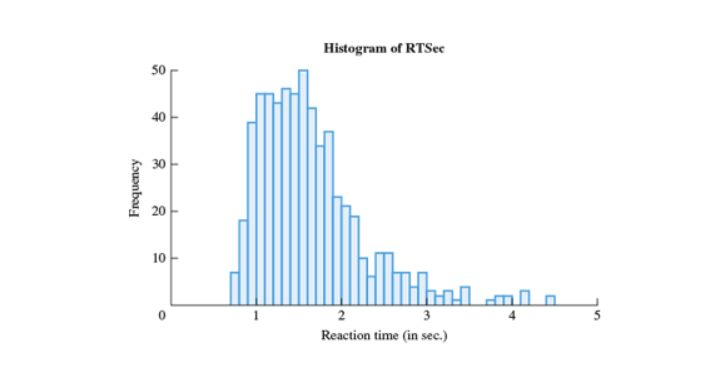
Histogram
diagram consisting of rectangles whose area is proportional to the frequency of a variable. Used to represent quantitative data
leading digits
Sometimes called the most significant digits, refers to digits at the beginning of a number
(I.E number 5200, the leading digit is 5, and the trailing digits are the two 0s)
Trailing digits
Also known a the less significant digits. the digits at the end of a number
(I.E number 5200, the leading digit is 5, and the trailing digits are the two 0s
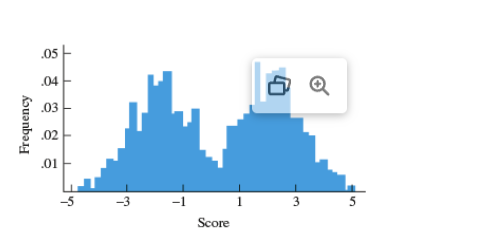
Binomial distribution
Distribution that has two ‘peaks’ that can be uneven
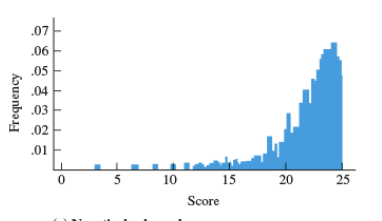
Negatively skewed
type of distribution in which more values are concentrated on the right side (tail) of the distribution graphtype of distribution in which most values are clustered around the left tail of the distribution
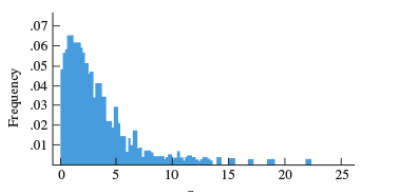
Positive skew
type of distribution in which most values are clustered around the left tail of the distribution
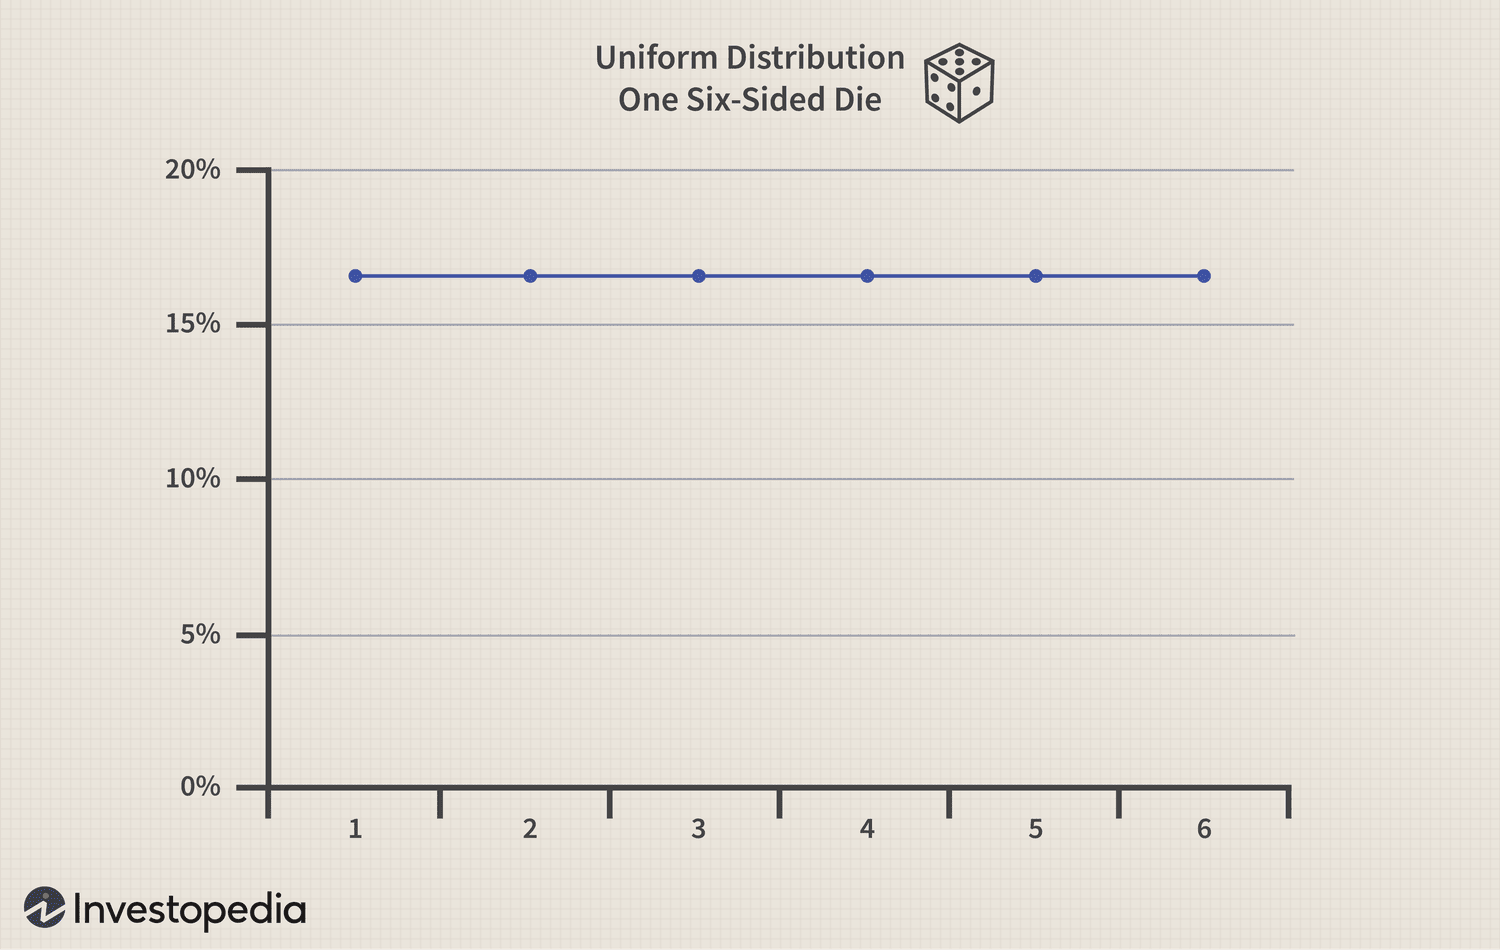
Uniform distribution
Distribution graph that has no peaks. probability of getting any value is the same
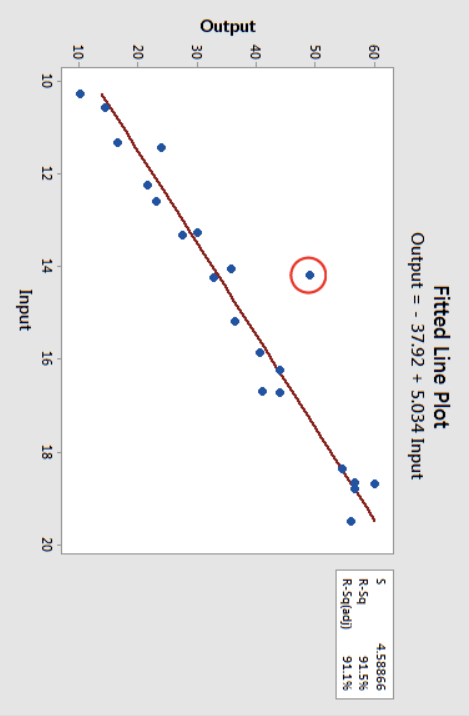
Outliers
A value that lies an abnormal distance from other values in a random sample from a population.