Week 3
1/36
There's no tags or description
Looks like no tags are added yet.
Name | Mastery | Learn | Test | Matching | Spaced | Call with Kai |
|---|
No analytics yet
Send a link to your students to track their progress
37 Terms
What is progress monitoring? How is it done? Discuss the differences between academic and behavioral intervention progress monitoring.
Definition: Progress monitoring is the regular, systematic assessment of a student’s performance to determine if an intervention is effective and whether adjustments are needed.
How It’s Done:
Baseline Data: Collect initial data before the intervention starts.
Regular Assessments: Use tools like Curriculum-Based Measures (CBMs) for academics or direct observations for behavior.
Graphing Results: Plot data to visualize trends and changes over time.
Decision-Making: Compare progress to goals; revise the intervention if progress is insufficient.
Academic vs. Behavioral:
Academic: Often uses CBMs (e.g., reading fluency passages, math computation probes) to track mastery of specific skills over time.
Behavioral: Relies on observational methods (event recording, interval recording, time sampling) to measure frequency or intensity of target behaviors.
Frequency of Data Collection: Academics may involve weekly or bi-weekly probes; behavior often requires daily or session-based observations.
There are two approaches to diagnostic assessment. Discuss both approaches. How are these approaches similar and how are they different?
Two Approaches:
Curriculum-Based Assessment (CBA) for Instructional Design
Evaluates student skills within current classroom content.
Guides teachers to adjust instruction based on performance in real-time.
Brief Experimental Analysis (BEA)
Uses short, single-case designs to compare baseline performance to multiple mini-interventions quickly.
Identifies the most effective strategy by measuring immediate gains.
Similarities:
Both focus on specific student needs.
Both provide data to inform intervention selection.
Both rely on frequent, targeted measures.
Differences:
CBA aligns with ongoing classroom instruction, often over a longer period.
BEA is more rapid and compares several interventions in a short timeframe.
CBA looks at broader curriculum alignment; BEA zeroes in on a specific skill or problem.
Describe five different ways that psychological-educational evaluation reports can be written to provide instructionally relevant information to improve a child’s functioning.
Organize by Problem-Solving Process
Align the report with the steps of problem definition, analysis, intervention, and evaluation, so teams can easily follow recommended actions.
Highlight Skills the Student Demonstrates Successfully
Emphasize what the student can do, offering a positive basis for intervention planning.
Focus on Observable Behaviors and Skills
Avoid vague references to “potential” or “capability.” Instead, discuss specific actions the student does or does not perform.
Include Graphical Progress Monitoring Data
Present data in charts or graphs to show baseline performance, intervention phases, and growth.
Provide Explicit, Realistic Recommendations
Offer practical strategies tied directly to observed needs, such as sample interventions, timelines, and roles for teachers and parents.
Discuss the importance of coaching in the intervention process. What are aspects of effective coaching?
Importance of Coaching:
Builds teacher capacity and fidelity by offering real-time support.
Bridges the gap between theory and practice, ensuring interventions are delivered accurately.
Aspects of Effective Coaching:
Modeling: The coach or consultant demonstrates the intervention with students or another teacher.
Observations: The coach observes the teacher implementing the strategy, noting strengths and areas for improvement.
Immediate Feedback: Timely, constructive feedback helps refine skills and maintain treatment integrity.
Collaboration: The teacher and coach work together to solve problems and adjust interventions as needed.
Ongoing Support: Periodic check-ins, follow-up sessions, and additional demonstrations help sustain gains over time.
Why is it essential to have skills beyond the intervention itself?
Even a well-designed Evidence-Based Intervention (EBI) requires the ability to design, implement, and analyze its outcomes effectively. Adequate skills ensure that the intervention is delivered with fidelity and adjusted based on student data.
What are the three main skill areas necessary for successful interventions?
Intervention Skills – related to selection, design, and implementation (plus coaching and collaboration with teachers). Assessment Skills – using evidence-based methods to diagnose and monitor student needs. Analysis Skills – collecting, presenting, and interpreting data to evaluate student progress.
What do “Intervention Skills” involve in school-based practices?
They include selecting and designing interventions, implementing them with proper coaching and modeling, and collaborating with teachers through a structured problem-solving framework.
How does coaching enhance intervention fidelity?
Coaching provides direct and indirect support through modeling, classroom observations, and immediate feedback. It builds teacher capacity and ensures that interventions are implemented consistently and effectively.
What is the role of modeling in intervention delivery?
Modeling involves demonstrating the intervention (live, with another teacher, or via video) so that the teacher or practitioner can replicate the process independently and receive feedback to ensure accuracy.
What are intervention scripts and why are they important?
Intervention scripts are detailed, step-by-step guidelines for executing an intervention. They promote treatment integrity by allowing multiple implementers (e.g., teachers, parents) to deliver the intervention consistently and enable role play to troubleshoot challenges.
How do implementation checklists support intervention delivery?
Checklists serve as direct observation forms that record whether each step of the intervention is executed. They provide ongoing data on fidelity and inform feedback sessions to improve implementation.
What are intervention-oriented assessment reports?
These reports organize data around the problem-solving process. They detail what skills a student demonstrates versus struggles with, include progress monitoring (often in graph format), and offer explicit, realistic recommendations for intervention adjustments.
Why are rewards used in school interventions, and what should be considered?
Rewards can boost academic productivity and engagement when used effectively. However, it’s important to ensure they’re delivered in a balanced manner, avoid satiation, and are selected based on the student’s needs—sometimes using noncontingent reinforcement (NCR) or behavioral contingencies.
Define Noncontingent Reinforcement (NCR) and provide an example.
NCR delivers reinforcement on a fixed schedule independent of student behavior. For instance, a student might receive praise or a preferred item every five minutes as determined by a functional behavior assessment, regardless of behavior occurrence.
What distinguishes behavioral contingencies from NCR?
In behavioral contingencies, reinforcement is contingent upon the student performing the target behavior (e.g., staying at their desk to earn a token), making access to rewards directly linked to performance.
What pitfalls might arise with contingency-based strategies?
Potential issues include teacher resistance due to increased workload, the risk of rewards losing their appeal over time (satiation), and challenges in choosing between individual versus class-wide delivery methods.
Why are assessment skills critical to effective intervention?
They ensure that student challenges are accurately identified so that interventions can be tailored and progress can be monitored. This data-driven approach helps determine the effectiveness of interventions.
What are the two primary approaches to diagnostic assessment mentioned in the notes?
Curriculum-Based Assessment for Instructional Design (CBA) – evaluates a student’s performance in current curriculum areas. Brief Experimental Analysis (BEA) – uses single-case designs to quickly compare baseline and intervention performance to identify effective strategies.
What are Curriculum-Based Measures (CBM) and their purpose?
CBMs are standardized assessments used to gather baseline data and monitor academic skills (like reading, writing, or math) throughout the intervention. They inform intervention planning and track progress over time.
What is progress monitoring in the context of interventions?
Progress monitoring is the frequent assessment of a student’s academic or behavioral performance to determine if an intervention is effective. It guides decisions to continue, modify, or end an intervention.
Describe two common methods for collecting behavioral data.
Group Event Recording: Tallying the number of times a behavior occurs for a group during an observation period. Group Interval Recording: Recording whether each student is exhibiting a behavior at predetermined intervals to approximate frequency.
What is interrater reliability and why is it important?
Interrater reliability measures the consistency between different observers. An agreement of 80% or higher is generally required to ensure that the behavioral data collected is reliable and valid.
What do “Analysis Skills” entail for intervention success?
They involve reviewing and interpreting data—including observational notes and test scores—to evaluate changes in student performance. Effective analysis supports data-based decision making regarding the intervention.
How are graphs used in the analysis of intervention data?
Graphs organize and display data collected during baseline and intervention phases, making it easier to see trends, compare performance levels, and determine if the intervention is achieving its intended effect.
What is a time-series graph and what are its key elements?
A time-series graph displays data points over time. Its key elements include: Y-axis: Displays frequency, percentages, or scores. X-axis: Represents time intervals. Condition Line: Connects data points to show changes from baseline to intervention phases.
What aspects should be considered when interpreting a graph of intervention data?
Consider the level (average performance), trend (slope of change), variability (consistency of data), and immediacy (speed of response after the intervention).
Summarize the steps involved in evaluating an intervention using data analysis.
The process includes collecting baseline data, implementing the intervention, regularly monitoring progress through assessments, graphing the collected data (e.g., time-series graphs), and interpreting the results (level, trend, variability, immediacy) to guide further decision making.
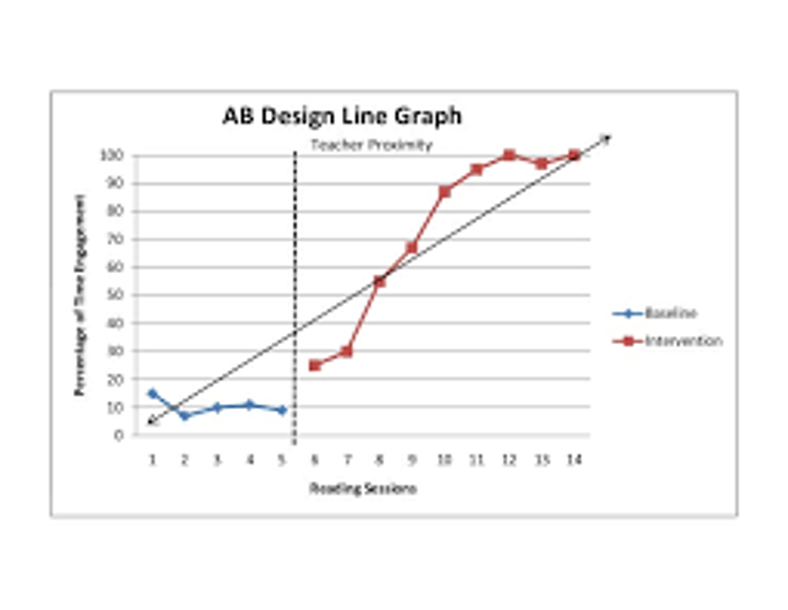
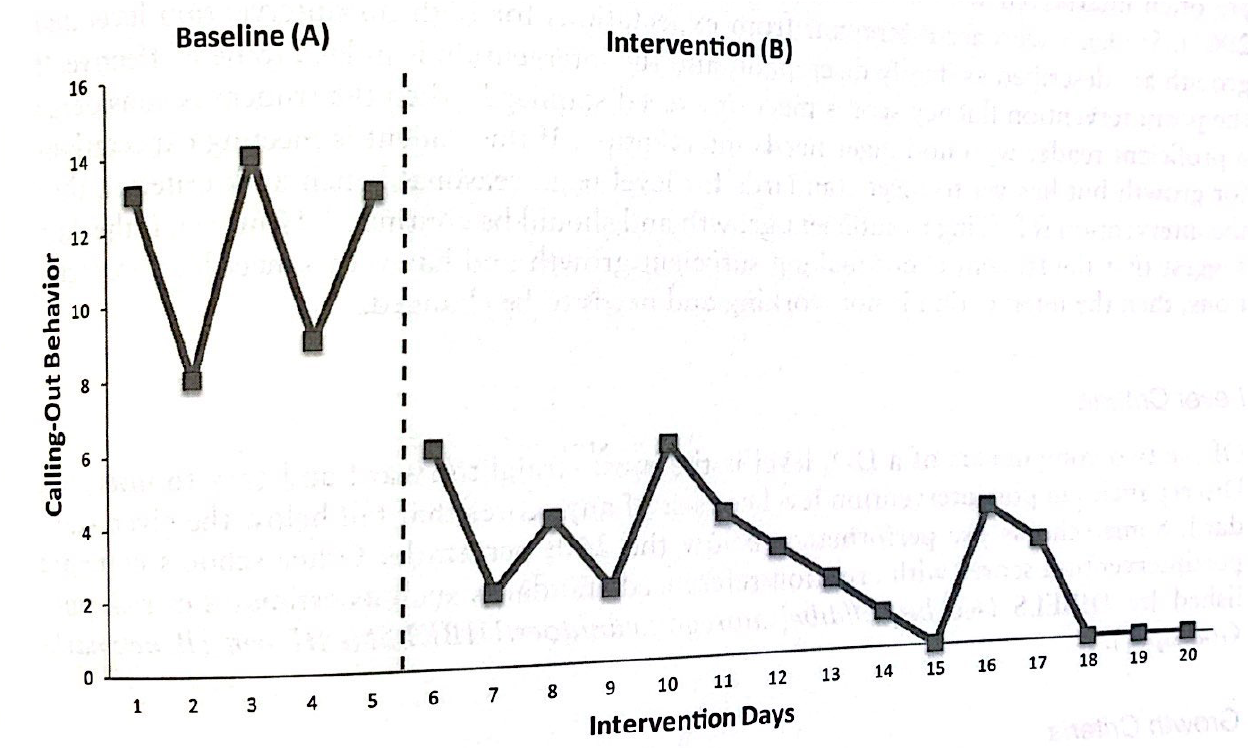
AB Design line graph for recording behavior at baseline and then the behavior during the intervention
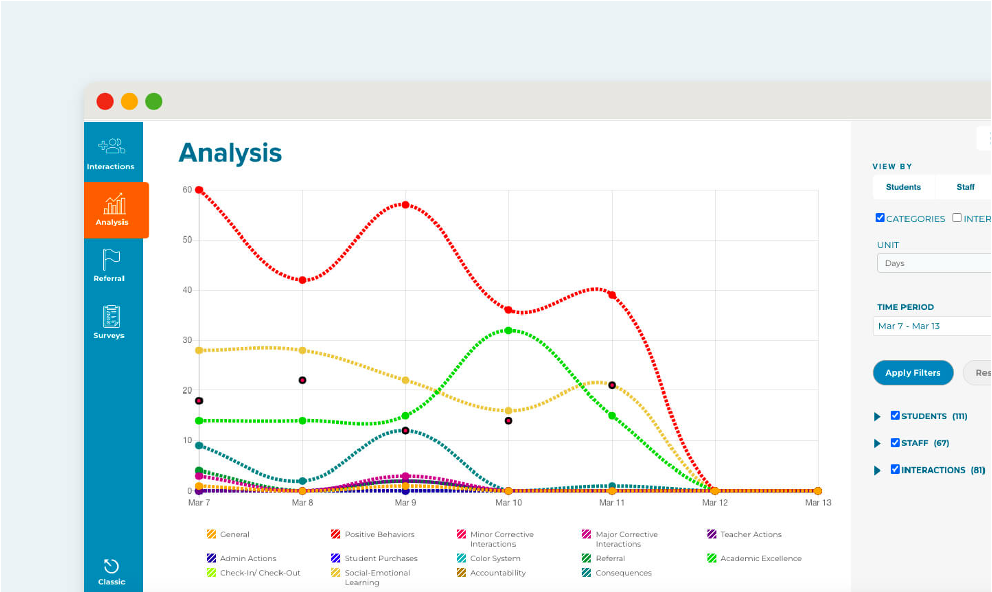
Time Series Graph Multiple
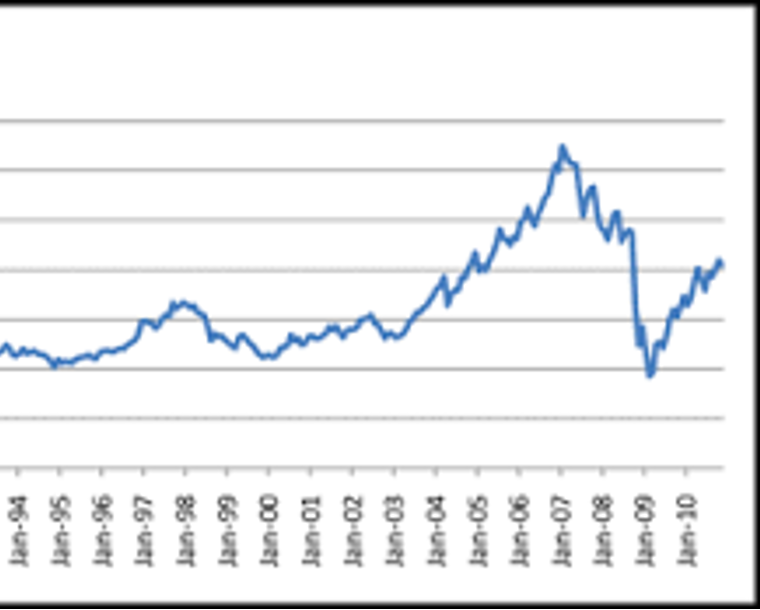
Time Series Graph
Time-Series Graph (Sample)
he most commonly utilized graph for behavior is called a time-series graph
Time-series graphs depict change in one or more target behaviors over time
Essential components of time-series graphs:
Y-axis (vertical) – frequency, percent, score, etc.
X-axis (horizontal) – time
Condition line –line drawn parallel to the y-axis, which connects data points and denotes change from baseline to intervention phase
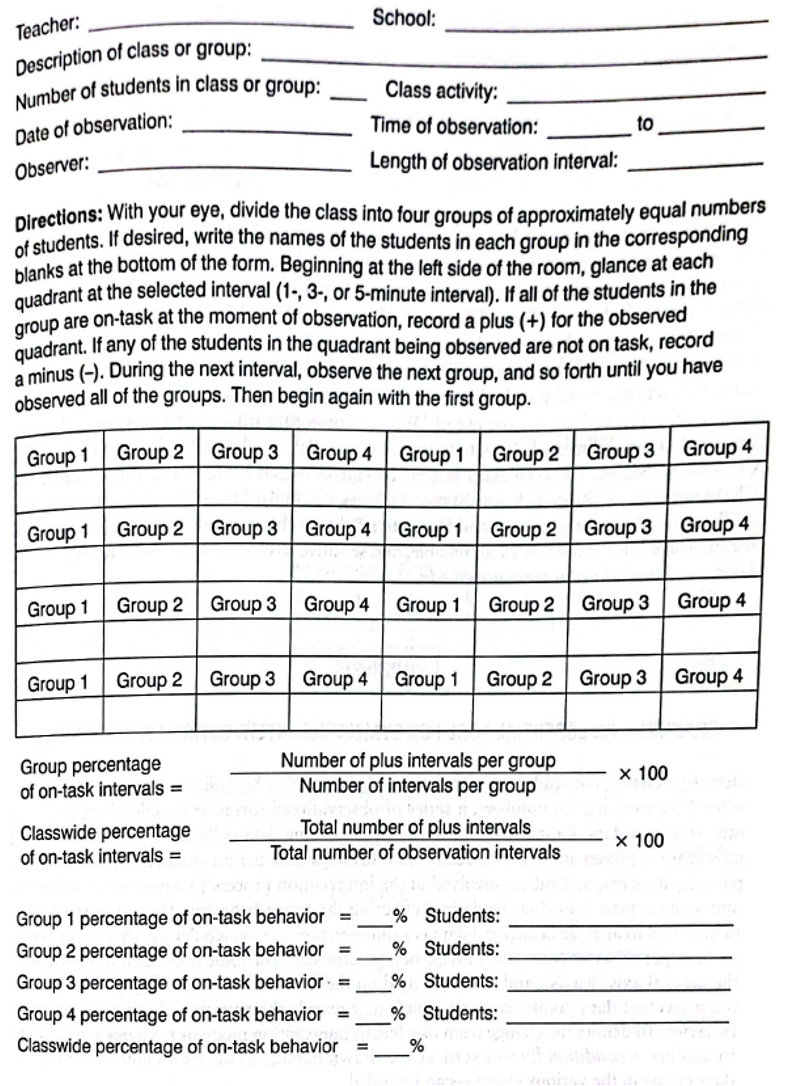
Group Time Sampling – designed to sample the behavior of student groups at predetermined intervals, such as every 3 or 5 minutes
This allows the observer to analyze which groups are engaging in behaviors more than others (i.e., which group is more off-task than the others)
Results can help inform classroom organization and instructional routines
Sample form (p. 83)
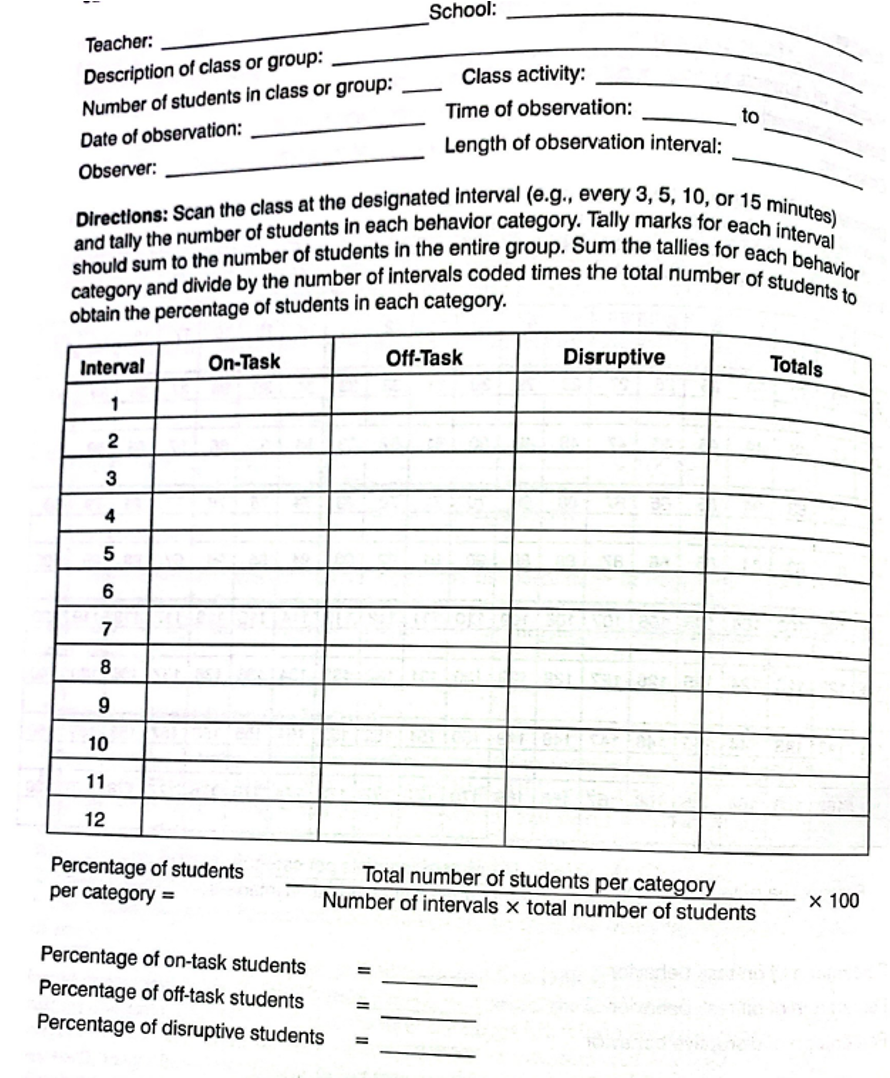
Classwide Scanning – a version of momentary time sampling which involves rapidly surveying an entire classroom and tallying the number of students in each of the several mutually exclusive behavioral categories at the moment of observation
Different from typical momentary time sampling because the intervals are considerably longer (i.e., every 3, 5, 10, or 15 minutes instead of seconds)
Longer intervals allow for a more systematic and less intrusive approach to data collection
Generates percentages of students who are falling into each behavioral category
Sample form p. 82
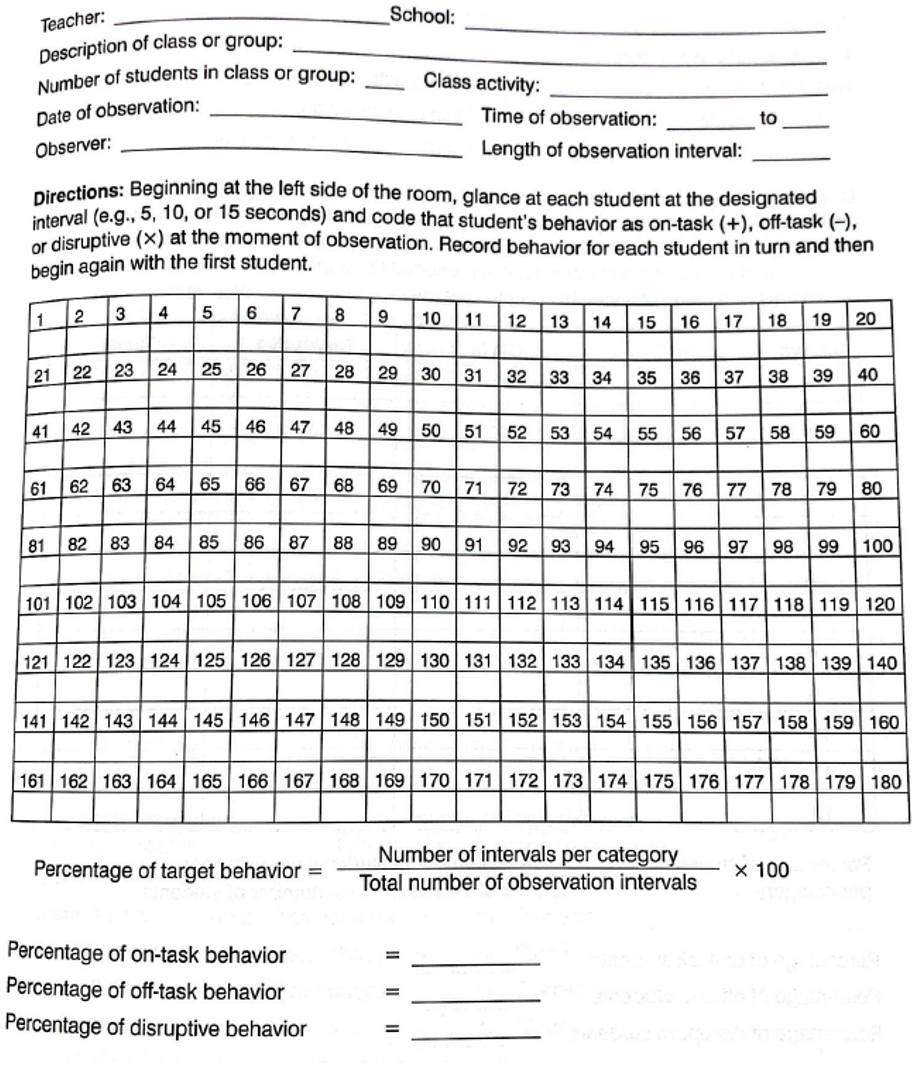
Group Interval Recording – designed for consecutively recording the behavior of every student in a class or group at predetermined intervals (i.e., every 10 seconds, 30 seconds, 60 seconds, etc.)
Observer records whether each student is exhibiting a specific behavior (i.e., on-task, disruptive behavior, etc.)
Generates frequency approximation data for the whole group
Sample form (p. 81)
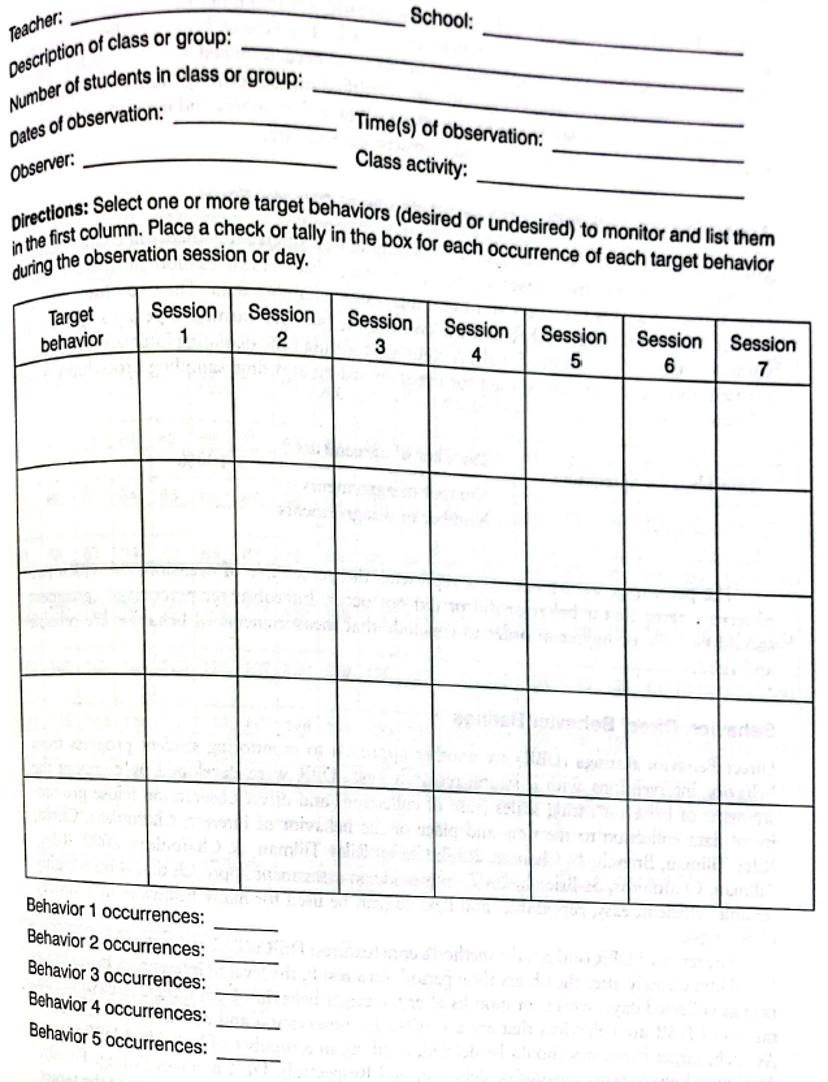
Group Event Recording – designed to monitor the frequency of occurrence of one to five positive and/or negative target behaviors for an entire class
Generates frequency data for a whole group
Sample form (p. 79)
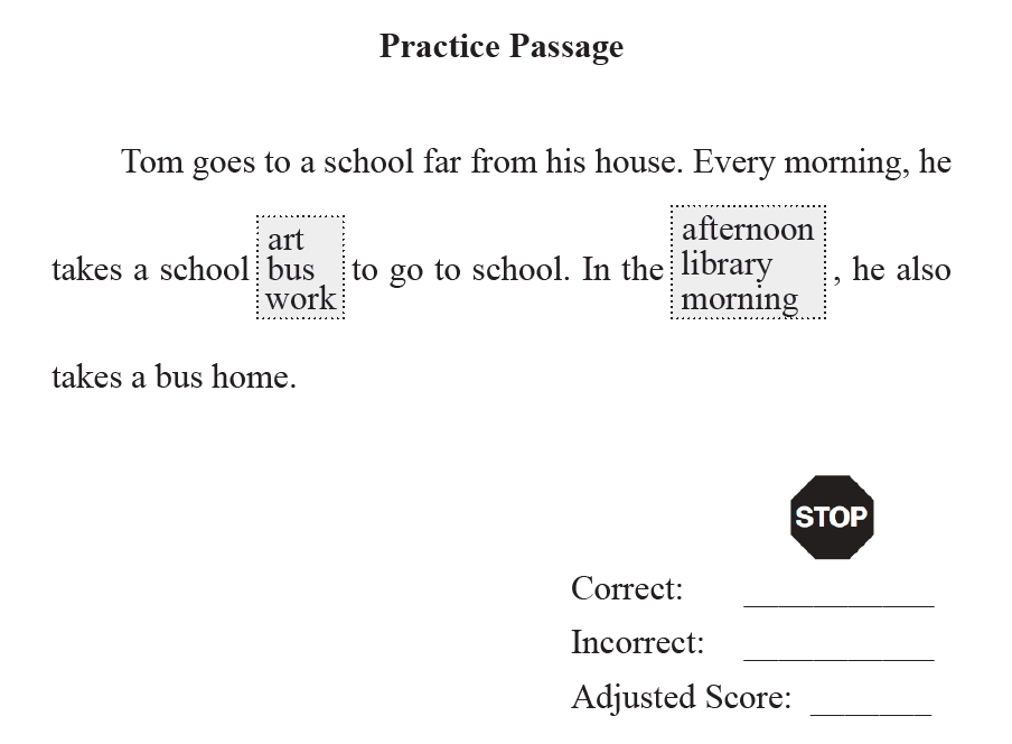
DIBELS – Maze Reading Fluency
(Second Grade)
Example of CBMs
CBMs are often used to assess and progress monitor reading skills
Oral reading fluency – read words/letters accurately aloud
Maze reading fluency – read silent and input correct missing words (from a list)
Reading comprehension
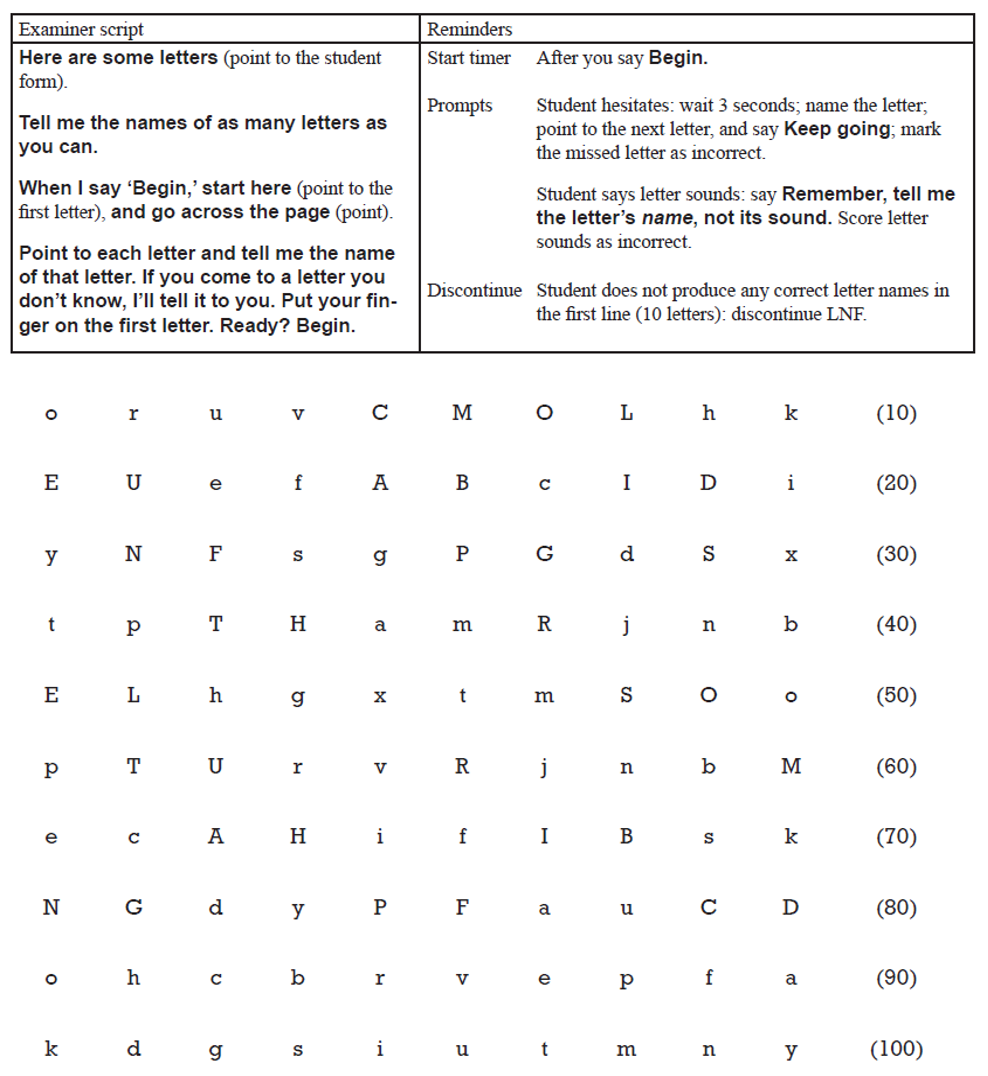
DIBELS – Letter Naming Fluency (Kindergarten)
Example of CBMs
CBMs are often used to assess and progress monitor reading skills
Oral reading fluency – read words/letters accurately aloud
Maze reading fluency – read silent and input correct missing words (from a list)
Reading comprehension