Psychological Research--stats and types of studies
1/40
There's no tags or description
Looks like no tags are added yet.
Name | Mastery | Learn | Test | Matching | Spaced | Call with Kai |
|---|
No analytics yet
Send a link to your students to track their progress
41 Terms
Mean
The average in a set of numbers
Median
The middle number in a set of numbers
Mode
Most frequently re-occuring number in a set of numbers
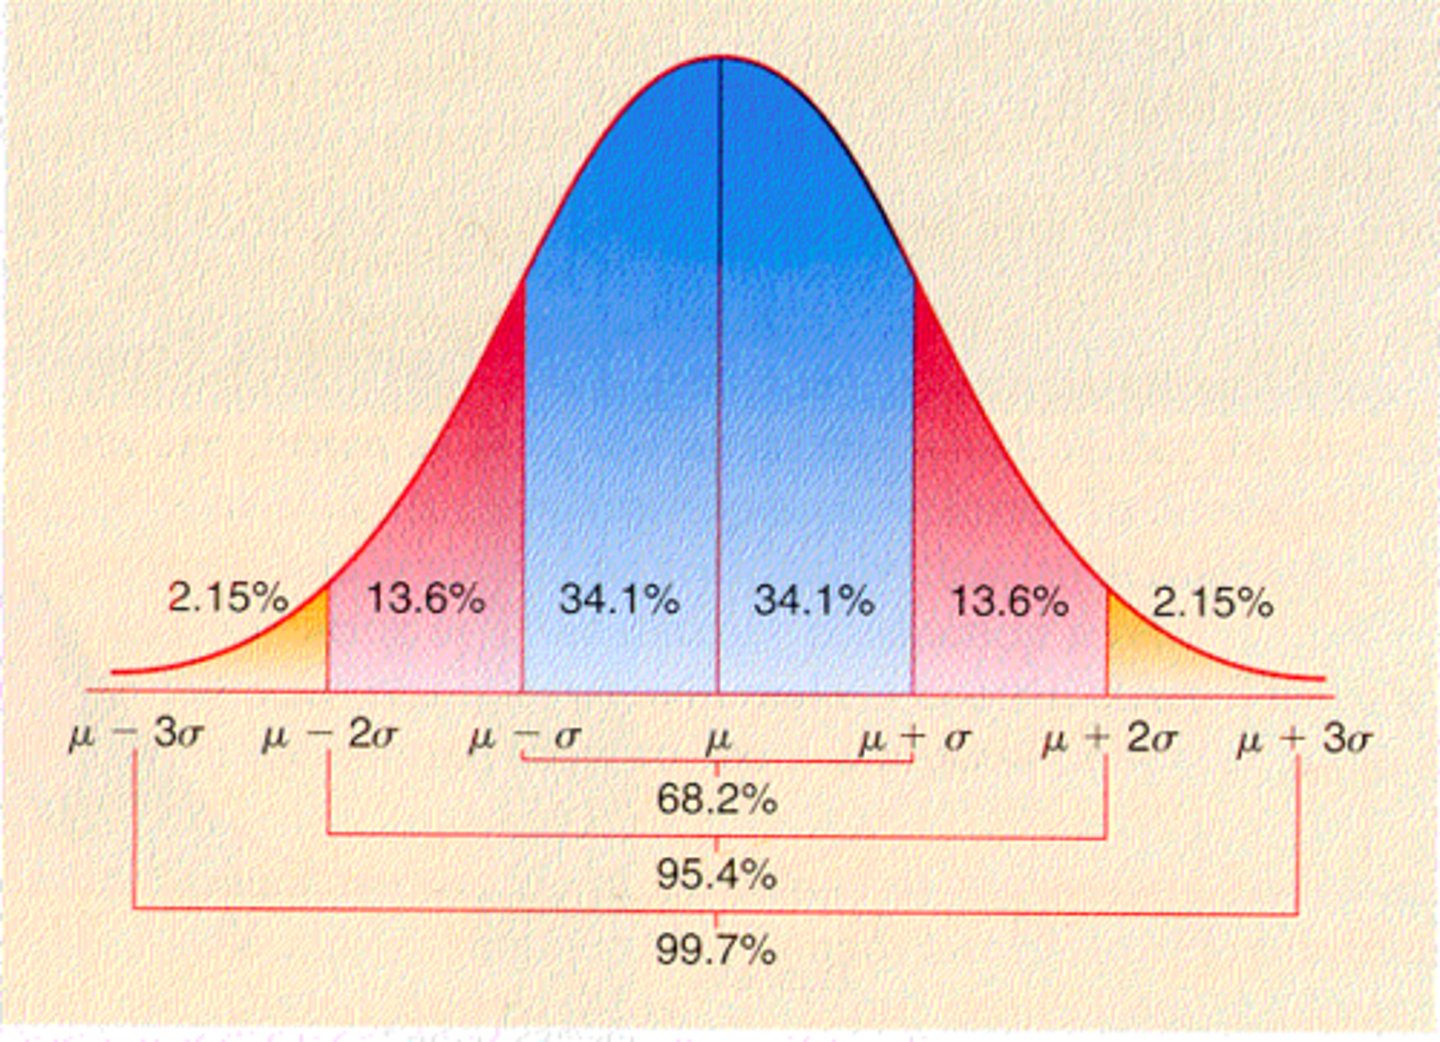
Standard Deviation
Used to show and measure the consistency of the numbers in a data set
Operational definition
The process of defining, in a quantifiable way, the independent and dependent variables in a study. this is essential for replication of the study
Hypothesis
An educated guess on what the outcome will be that supports the theory
Research
The actual collection of the data being tested. The test of the hypothesis
Longitudinal studies
Research approach that takes place over a long period of time. Used to show the changes in a person (or gorup of persons) over a long period of time. These take a long time, they're expensive, and because of the long amount of time, you may lose participants (death)
Cross-sectional studies
Observe and classify the changes in different types of people and different groups at the same time. Can be used to compare attitudes of people of different ages, races, national origins, etc. This is sometimes at a disadvantage because unidentified variables can get involved
Naturalistic observation
The process of observing and classifying, but not explaining, behavior of people in a natural setting (at home, parks, a mall). The people are being observed without interference between the observer and the one being observed. The bad thing about it is observer bias, it's time consuming, and you don't have control over the environment.
Observer Bias
When the researcher themself alters or changes the results of the study. For example, a teacher studying differences in math skills between boys and girls might spend more time teaching boys because he/she believes that boys are better at math.
Case Study
Kind of the same as naturalistic observation, except a that the focus is on only one person or a very small group. You usually can't replicate these and because of the small amount of people, it takes away generalization.
Survey
research method used to get large amounts of data in a short amount of time, either though an interview or a questionnaire. These are very inexpensive, however, people may lie because they know they're a part of an experiment, and it doesn't represent the entire population so random sampling is important. It also leads to more advanced research.
Hawthorne Effect
Tendency of people who know they are being studied to act differently (usually better) than they normaly would. For example, a teacher knows they're being evaluated so that day they act on their "A game" and do the best they can in front of the interviewer.
Cohort Effect
When an entire group of people get eliminated from an experiment. For example, either young, old, skinny, fat, tall, short, etc.
Experimenter Bias
This is when the experimenter messes with the results of the experiment in order to make the outcome how they wanted it to be. The experimenter's actions influence the outcome.
Selection Bias
This is when the proper form of randomness is not achieved in terms of who participates in a study or responds to a survey. In order to fix this one may want to use a random number generator instead of trying to randomize it themselves because everyone may not be getting a fair chance of being selected.
Sampling Bias
This is when the group of people you experiment on do not represent the topic that's being experimented.
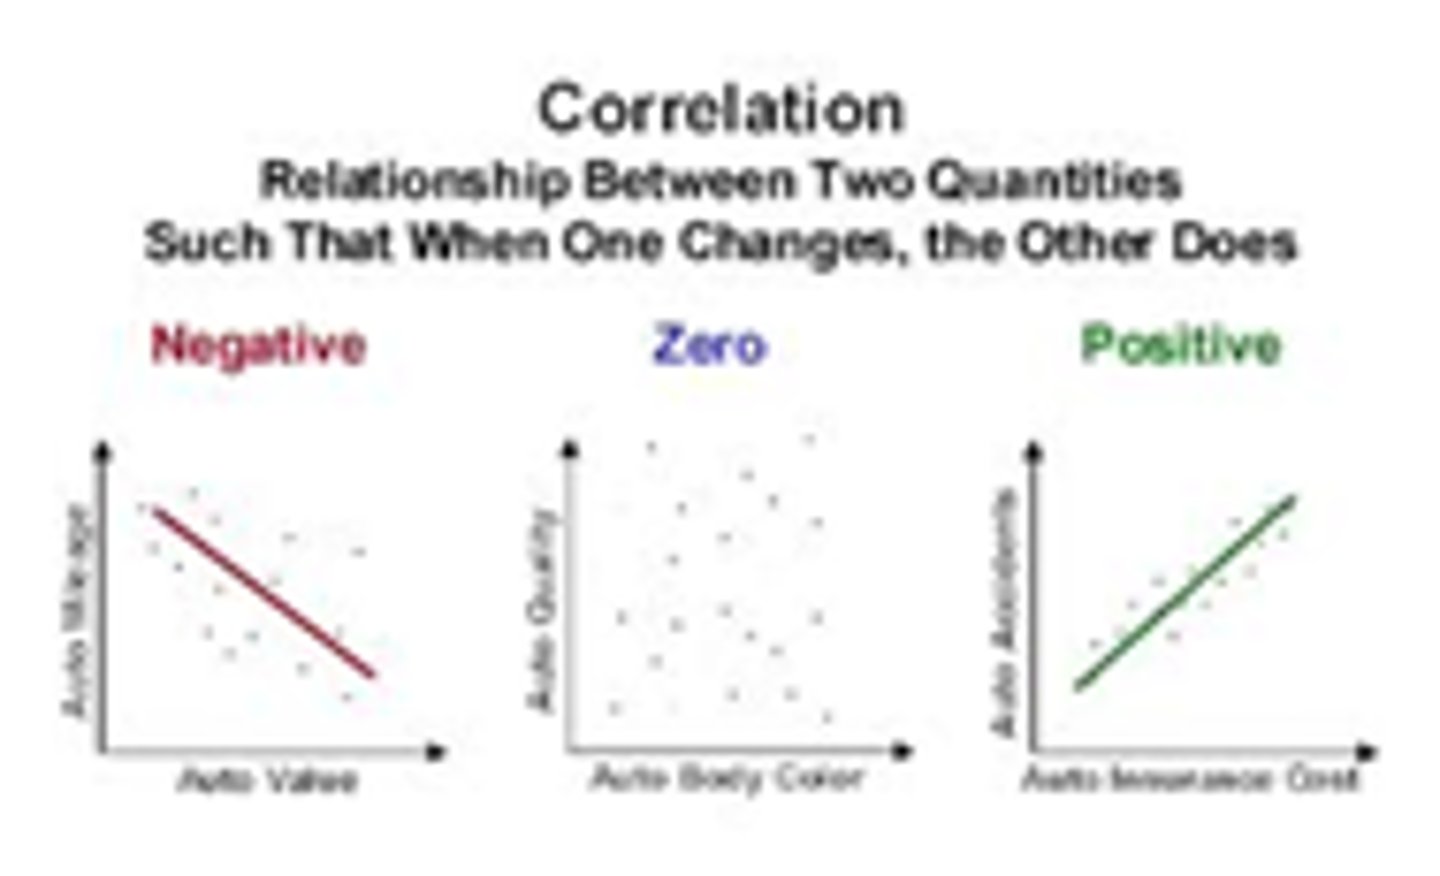
Correlational Research
Research method that relies on examining how two variables are related. Shows a relationship but not causation. For example, you can't say less sleep causes more stress or vice versa).
Causation
means that one variable CAUSES another. Can be demonstrated through experimentation, but not through correlational research.
Negative correlation
Describes the DIRECTION of correlation: as one variable increases, the other decreases
as one goes up, the other goes down
Correlational Coefficients
The numerical relationship between the variables in correlational research. The scale goes from -1.00 to +1.00. An example of positive correlation (0 to +1.00) is time spent studying and grades. An example of negative Correlation (0 to -1.00)
is the time spent playing video games and grades.
Scatterplots
The visual representation on the variables and how they correlate with each other.
Experimental Research
This is the manipulation of one variable to examine
the effect on the second variable.
Experimental Group
The group of people being experimented on, or those who are receiving the independent variable / treatment.
Control Group
The group not being experimented on, or those who are not receiving the independent variable / treatment.
Placebo Effect
"The sugar pill". A group of people receive a pill (or any other forms) that they continue to take to cure whatever needs to be cured, and their minds are tricked into actually thinking it works, so they believe that it's actually doing what is said to be doing however it's not.
~experimental results caused by expectations alone
Double-Blind Studies
A medical study in which neither the subject groups participating nor the researchers are aware of who gets a real drug and go gets a placebo. This helps fix the placebo effect.
Independent Variable
The variable that is controlled. It is a variable that stands alone and isn't changed by the other variables you are trying to measure. This is what the researcher is testing in order to determine its impact.
Dependent Variable
The variable that is measured. It is something that depends on other factors. For example, test scores could vary based on how much sleep students received the night before, or the amount of time they were permitted to study.
Confounding Variables (CV)
extraneous variables that cannot be controlled by the researcher and could influence any change in the Dependent Variables (DV). These can reduce the ability of researchers to determine a causal relationship between the independent and dependent variable
Random Sampling
in a SURVEY, this requires that every person in the population has an equal chance of being selected. It is very simple, stratified, and convenient. The goal of this is to generalize findings from the sample to the population.
Random Assignment
In an EXPERIMENT, this requires that every member of the sample has an equal likelihood of being assigned to the experimental group. It balances out the unknown factors, making them equally likely to appear in both groups. It also prevents selection bias.
Statistical Significance
If high, it means the research finding most likely suggests a causal relationship between the independent and dependent variable. If low, a causal relationship does not exist.
If there is an apparent relationship between IV and DV in a large sample, there are two possible options:
1. This occurred by chance
2. This occurred because of a real relationship
Internal Validity
This refers to how well an experiment is done, especially whether it avoids confounding (more than one possible independent variable [cause] acting at the same time). The less chance for confounding in a study, the higher its internal validity is. The extent to which change in the IV causes change in the DV.
Replication
The act of recreating an experiment done to make sure the same results are achieved the second (and third, fourth, and fifth time) so as to ensure the original results and conclusions are valid rather than accidental.
ethical criteria of research
1. Coercion: participation must be voluntary.
2. Informed consent: participants must know they are
involved in research OR be deceived in a non-harmful
way.
3. Confidentiality: identities must not be revealed
4. Risk awareness: participants must not be placed at
significant psychological or physical risk (TBD by IRB).
5. Debrief: participants must be debriefed afterward
wording effect
related to how questions are framed; for example, the phrasing of a question can influence the answer people give
population
the total number of people that COULD be included in a particular study or survey sample
percentile
a method of statistical measurement. For example, a score of 84 on the ACT means that a person did better than 84% of the population.
normal distribution
the standard range of scores on a bell curve. most people cluster at the average, with even numbers of people exceeding and falling below the average.