Chapter 10 - Population Dynamics
1/28
There's no tags or description
Looks like no tags are added yet.
Name | Mastery | Learn | Test | Matching | Spaced |
|---|
No study sessions yet.
29 Terms
Population Dynamics
Area of ecology concerned with factors influencing expansion, decline, and maintenance of populations
Importance of understanding population dynamics
invasive species control
protection of endangered/threatened species
pest control (parasites/pathogens)
maintain economically important spp.
Dispersal
Movement of individuals away from population they were born
Dispersal in Eurasian collared doves
Eurasian collared doves were purposefully introduced to North America and began to expand in small jumps. Juveniles might disperse however adults are generally stationary.
Range changes in response to climate change?
after the ice age the range of organisms expanded.
Numerical response
Change in the density of a predator population in response to increased prey density.
Immigration vs. Emigration
immigration - movement in a population
emigration - movement out of a population
Survivorship
Proportion of offspring produced by a population or species that survive to a certain age class
What are the 3 main methods for estimating patterns of survival?
Cohort method
Age at death method
Age distribution method
Cohort Method
involves identifying individuals born at same time and keeping records form birth.
Age at Death Method
Involves record age of death for a number of individuals.
Age Distribution Method
Involves calculating differences in proportion of individuals in each age class
Why is understanding age distribution important to estimating patterns of survival?
Age distribution reflects a population’s history of survival, reproduction, and potential future for future growth.
What kind of life table does the Age of Distribution and Age at Death method form?
Static life table
What is a survivorship curve?
A graph that illustrates the number of individuals in a population that survive over time and at different ages.
Type 1 survivorship curve
Survival is high among young individuals and mortality is higher among older individuals.
Type 2 survivorship curve
Constant rate of survival throughout lifetime.
Type 3 survivorship curve
High mortality among young individuals followed by high survivorship.
Examples of type 1 survivorship
humans
elephants
gorillas
hippos
Examples of type 2 survivorship
birds
rodents (squirrels)
butterflies
Examples of type 3 survivorship
fish
sea turtles
frogs
most insects
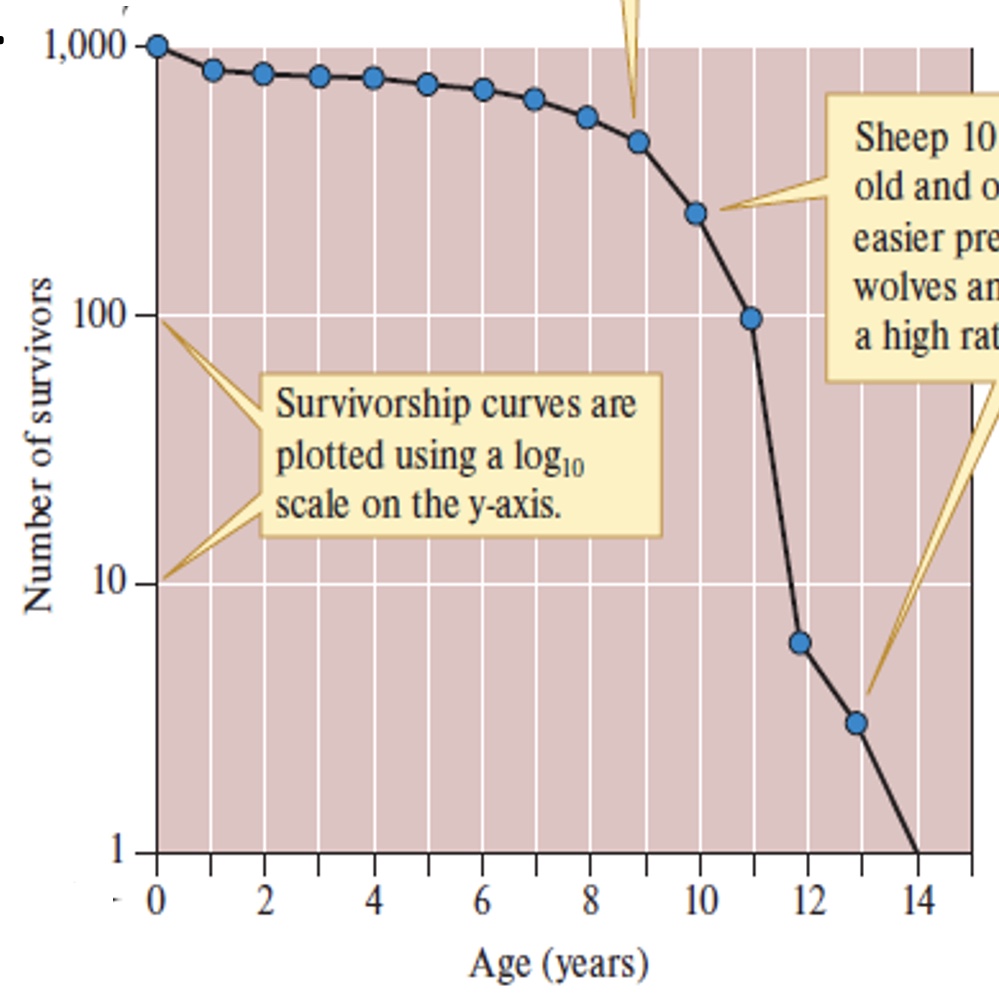
What kind of survivorship curve is this?
type 1 survivorship curve
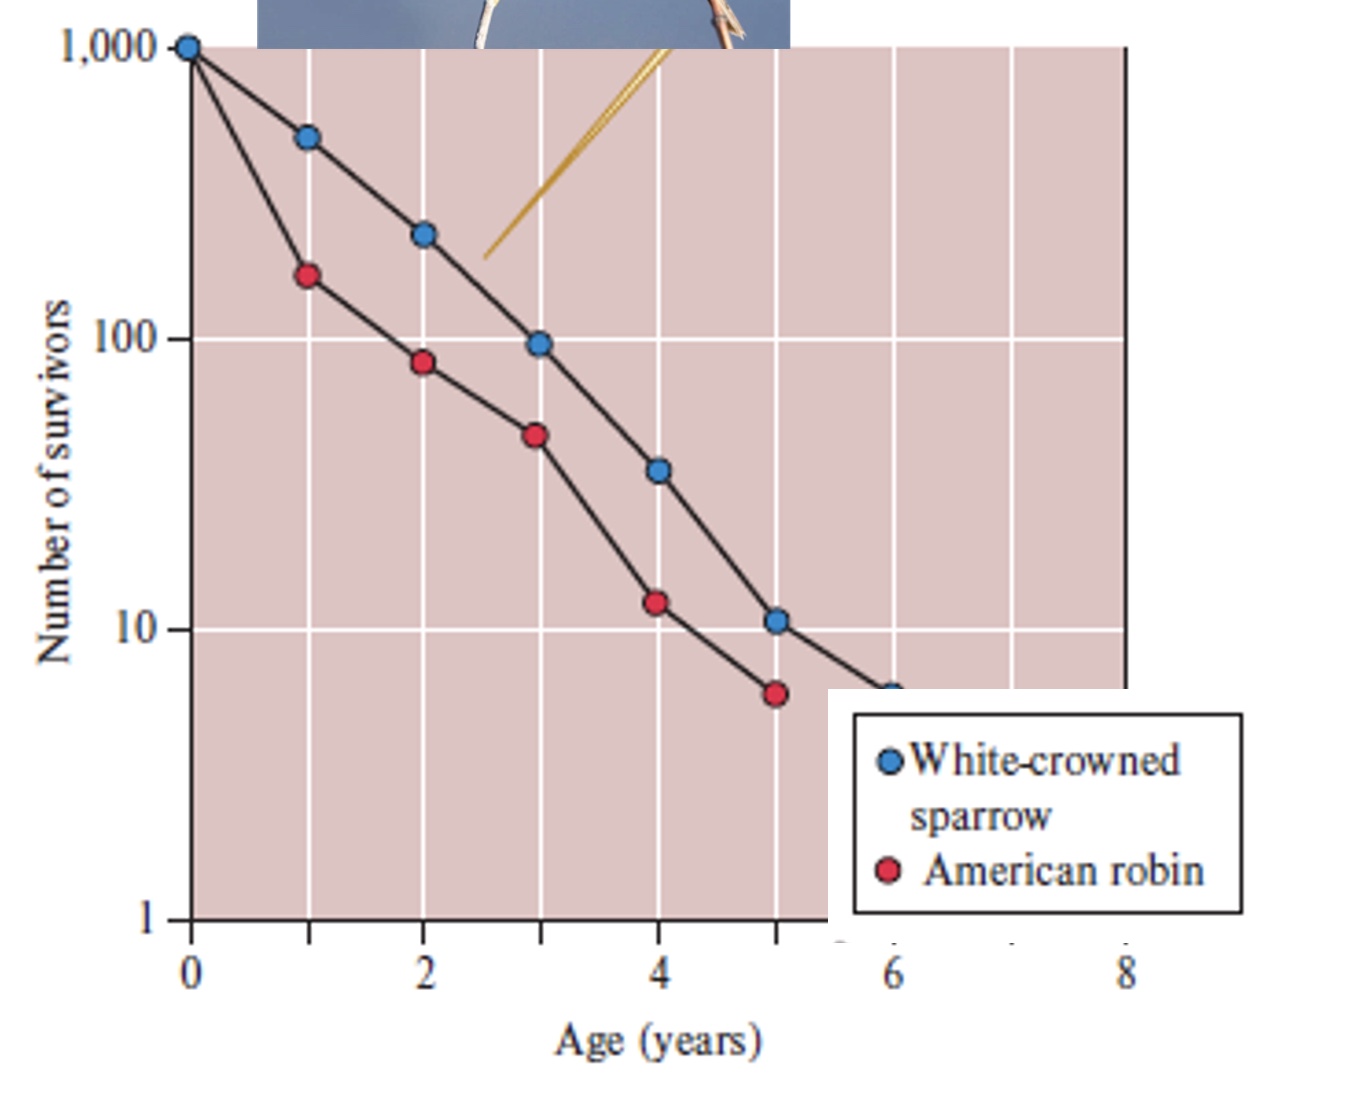
What kind of survivorship curve is this?
type 2 survivorship curve
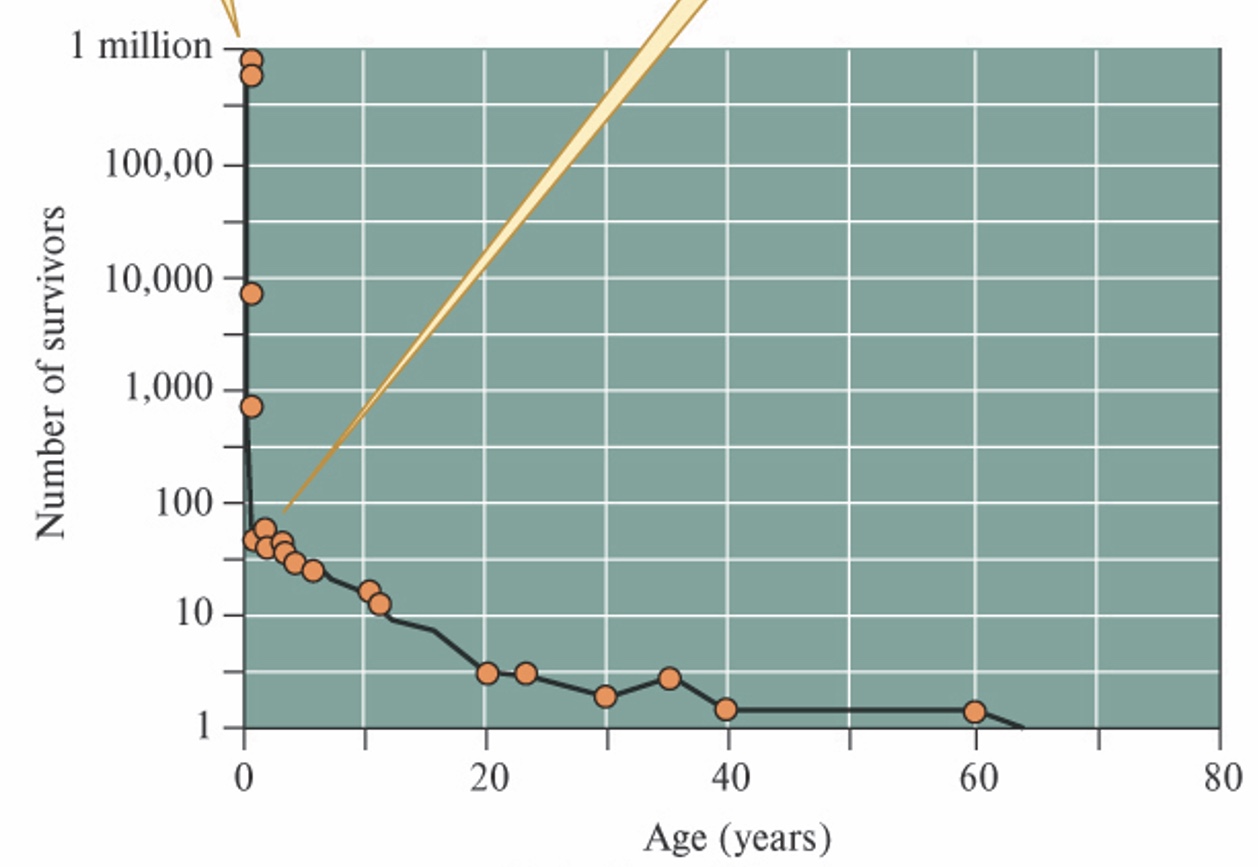
What kind of survivorship curve is this?
type 3 survivorship curve
fecundity schedule
a table of birthrates for females of different ages in a population.
Geometric rate of increase (lamba)
ratio of the population size at two points in time.
Net reproductive rate (N0)
Average number of offspring produced by an individual in a population during its lifetime.
Generation time (T)
average age of reproduction
Per capita rate of increase (r)
Measurement of population growth in species with continuous or overlapping reproduction.