AP Statistics Ultimate Review
1/90
There's no tags or description
Looks like no tags are added yet.
Name | Mastery | Learn | Test | Matching | Spaced | Call with Kai |
|---|
No analytics yet
Send a link to your students to track their progress
91 Terms
Observational Studies claim….
Correlation! (not causation)
how to design an experiment
S- start with the subjects
R- randomly assign them (big bag shake well)
T- treatments (state them)
M- measure
E- each subjects response to them
C- compare their
A/P- average or proportion
Experiments
Can claim causation if they have control, randomization, and repetition
Types of Experiments
Completely Randomized- each participant is assigned to a treatment group randomly.
Randomized block- participants are divided into blocks based on a trait, and randomization occurs within each block.
Matched Pairs- participants are paired based on similar characteristics, and each receives a different treatment. (think twins)
What are Factors and Levels
Factors- independent variables (treatments) in an experiment that are manipulated. (Ex. Exercise)
Levels- the different values or conditions of a factor. (ex. High, medium, low)
Confounding vs. Lurking Variables
Confounding- affect both the treatment and the response, making it difficult to determine the true effect of the treatment.
Lurking- variables that are not included in the study, but may affect the outcome.
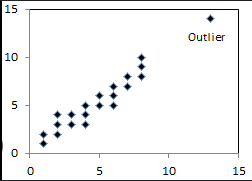
Measures of Spread and Outliers
IQR: middle 50% of the data found by Q3-Q1
Upper Fence/ Outliers: Q3+1.5(IQR)
Lower Fence/ Outliers: Q1-1.5(IQR)
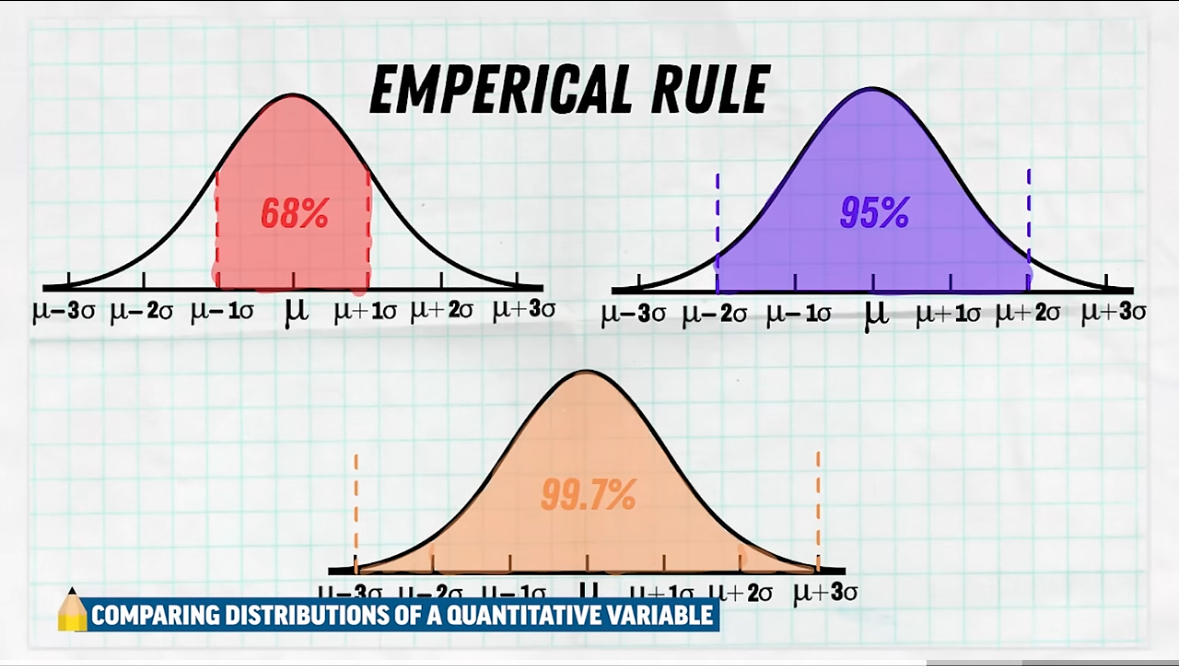
Normal Model Information
Outliers: Mean ± 2(standard deviation)
Describing linear association (r-value)
There is a (strength), (positive or negative), linear relationship between x and y (in context)
interpret the coefficient of determination (r2)
___% of the variation in y (in context) can be explained by the changes in x (in context)
interpret the slope
for every 1 increase in the x (in context) the predicted y (in context) increases or decreases this much
interpret the y intercept
when the x is zero the predicted y is this (list x and y in context)
extrapolation
making a prediction outside of the domain of the provided data. this is dangerous!
leverage point on LSRL
point far away from the mean of x
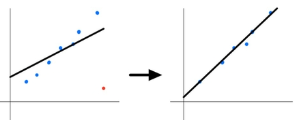
influential point on LSRL
point with high leverage that is not in line with the rest of the data removing it has a significant impact on the slope the LSRL
Standard deviation of the residuals
average amount the actual y varies from the predicted y in LSRL
how to compute residual
Actual y- Predicted y
what does a pattern on a residual plot mean
A linear model is not appropriate
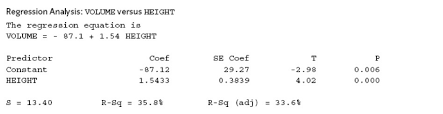
Understand how to read a computer printout
To find LSRL equation without a table
slope= r(std. deviation of y/ standard deviation of x)
then set up an equation using x bar and y bar to solve for y intercept.
Geometric Distribution
go until a success
Binomial distribution
success out of a set number of trials.
How to check for independence
P(A)= P(A|B)
what is given probability/ P(A I B)
P(A and B) / P(B)
What is the difference between U and Upside down U
U= “or”/addition
Upside Down U= “and”/ multiply
What is the sum of all probabilities
ONE
what are disjoint/ mutually exclusive events
Events that cannot happen at the same time.
If events are disjoint then P(A or B)= P(A)+P(B)
what are independent events
Events where the occurrence of one does not affect the probability of the other. For independent events, P(A and B) = P(A) × P(B).
If events are not disjoint (“or” formula)
P(A(or B) = P(A) + P(B) - P(A and B)
If events are not independent (“and” formula)
P(A and B)= P(A) x P(B|A)
when to use geometric pdf
when looking for the probability of an EXACT place of the first success
when to use geometric pdf (up to place of success)
to find probability of 1st success happening on or before a certain place
when to use 1- geometric cdf (lower part you don’t want)
to find probability of 1st success happening on or after a certain place
when to use binomial pdf
to find probability of an exact number of successes
when to use binomial cdf (up to and including the # of successes you want)
to find the probability of less than or at most a certain # of successes
when to use 1- binomial cdf (lower part you do not want)
to find the probability of more than or at least a certain # of successes
How to find an expected value
multiply each x by their frequency and add all together.
x1(p1)+x2(p2)+…= Mx
What is center effected by
addition, subtraction, multiplication, and division
What are measures of spread (standard deviation) affected by
Multiplication and division
How do you combine means together
add or subtract them like normal
how do you combine (add or subtract) standard deviations
std.devx+y= sqrt. of ((std. dev x)2 + (std.dev y)2)
describing the shape of a sampling distribution (for proportions)
Shape: unimodal, symmetric
Outliers: N/A
Center: Mp hat= P (aka population proportion)
Spread: standard deviation of the population ( sqrt. of ((p(1-p)/n)0
describe the distribution (for means)
Shape: unimodal, symmetric
Outliers: N/A
Center: Mx bar= M (aka population mean)
Spread: standard deviation of the population (standard deviation/ sqrt. of n)
Assumptions and conditions (proportions)
Random- stated or assumed
Independent- n ≤ 10% of population
Large Enough- np ≥ 10
n(1-p) ≥ 10
Assumptions and conditions (means)
Random- stated or assumed
Independent- n ≤ 10% of population
Large Enough- n >30
what is PANIC used for and what does it stand for
runs a confidence interval
P- State the parameter(s) (M= or P=)
A- Assumptions and Conditions
N- Name of the interval
I- find/calculate the interval
C- write conclusion
what to do if n isn’t >30 (means)
make a frequency dot plot and determine if it is
S- Somewhat Symmetric
U- Unimodal
N- No outliers
if it is and other conditions are met then approx. normal model applies
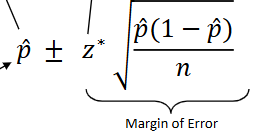
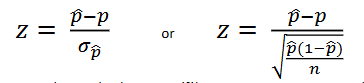
calculating a one proportion z-interval
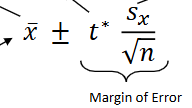
statistic ± z* (standard deviation)
to find critical value (z-distribution)
invnorm(onetail)
ex. z* for 95% confidence interval= invnorm(.025)
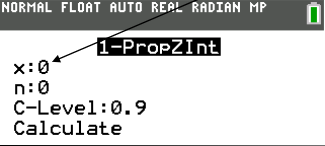
one proportion z-interval in calculator
x: number of successes
n: total number of trials
c-level: desired confidence level
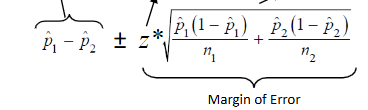
two proportion z-interval formula
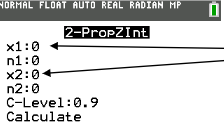
two proportion z interval calculator
x1: number of successes
n1: total number of trials
x2: number of successes
n2: total number of trials
c-level: desired confidence level
Confidence interval 1 proportion conclusion
i am % confident that the true proportion of ____ is between ___% and ___%
Confidence interval 2 proportion conclusion
i am % confident that the true proportion of ____ is between ___% and ___% lower/higher for __-.
AND
Since zero is not in the interval there is evidence of a significant diff. between ___ and ____
OR
Since zero is in the interval there is not evidence of a significant diff. between ___ and ___.
Effects of higher confidence level
larger critical value and wider interval
what to do if no p-value is given
“dont cry use .5”
What is PHANTOMS and what does it stand for
model for hypothesis test
P- parameter(s) (P= or M=)
H- Hypothesis (Ho= 0 or no difference, Ha= new claim)
A- Assumptions (get RIL)
N- name of test
T- find test statistic
O- obtain p-value
M- make decision (reject or fail to reject Ho)
S- state conclusion
one proportion z-test formula
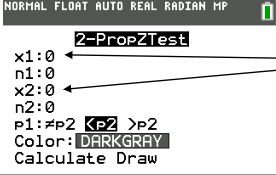
two proportion z test calculator
x1: number of successes
n1: total number of trials
x2: number of successes
n2: total number of trials
p1: ≠p2, <p2, >p2
when to reject Ho
when p-value is < alpha (.05)
when to fail to reject Ho
when p-value is > alpha (.05)
when to use t- distribution
when we do not have the standard deviation of the population.
how to calculate degrees of freedom (t-distribution)
df=n-1
one mean t-interval formula
computing critical value (t distribution)
invT(one tail)
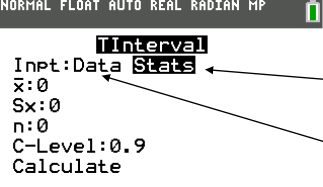
one mean t-interval calculator
STATS-
x̅: sample average
Sx: standard error
n: sample size
c-level: desired confidence level
IF GIVEN TABLE-
enter data into L1and L2 and use “Data” instead
hypothesis test conclusion
Since p value is ___ I reject/fail to reject Ho.
There is/is not significant evidence proving Ha (in context)
two mean t-interval formula
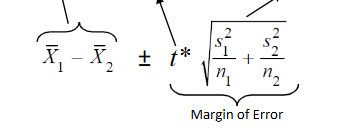
two mean t-interval conclusion
i am % confident that the true average of ____ is between ___ and ___ lower/higher for __-.
AND
Since zero is not in the interval there is evidence of a significant diff. between ___ and ____
OR
Since zero is in the interval there is not evidence of a significant diff. between ___ and ___.
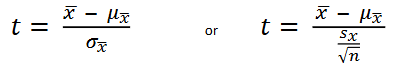
one mean t-test formula
one mean t test calculator
Ho: null hypothesis
x̅: sample mean
Sx: standard error
n: sample size
M: ≠ Ho, < Ho, > Ho
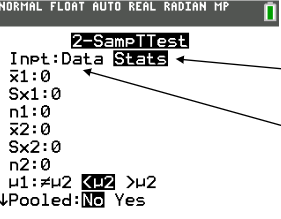
2 sample t test calculator
when to use matched pairs
1 sample of subjects and 2 pieces of related data. you are interested in the DIFFERENCE in between the data. ( in your calculator you will use a 1 mean t-test/interval and enter the data of the difference)
Matched pairs interval conclusion
I am ___% confident that the average difference in ___ is between ___ and ___ lower/higher for ___
Matched pairs test conclusion
Since p-value is ___ I reject/ fail to reject Ho.
There is/ is not evidence that the average difference in ___ is significantly different.
Assumptions for two samples of data
Get RIL for each data sample AND include that the samples are independent of each other (in context)
Type 1 error
Rejected the null hypothesis when it was actually true
Type 2 error
Not rejecting the null hypothesis when it is actually false.
What is Power
the probability of rejecting the null hypothesis when it is false
What is the relationship between Power and Beta
Power+Beta=1
What is Beta
Probability of a Type 2 error
What is alpha
probability of a Type 1 error
Effects of increasing alpha
probability of a Type 1 error increases
probability of a type 2 error decreases
Power increases
Effects of increasing sample size
probability of type 1 error stays the same
probability of type 2 error decreases
power increases
when to run chi square Goodness of fit test
one sample
one categorical variable
Ho= the claimed distribution is correct
when to run chi square test of homogeneity
2 samples (from different populations)
one categorical variable (checking for sameness)
Ho= each population is having the same rate for every category of the variable
Expected values for chi square test formula
((row total)(column total))/(total toal)
Chi square degrees of freedom formula
df= (row-1)(column-1)
when to run chi square test of independence
one sample
two categorical variables (sorted by categories)
Ho= the two variables are independent of each other/ no association/ no relationship
Empirical rule