Statistics Comps Material
 Call Kai
 Learn
Learn Practice Test
 Spaced Repetition
 Match
Match Flashcards
 Knowt Play
1/20

There's no tags or description
Looks like no tags are added yet.
Name | Mastery | Learn | Test | Matching | Spaced | Call with Kai | Chat |
|---|
No analytics yet
Send a link to your students to track their progress
21 Terms
Confounding/Extraneous variable
source of systematic error (consistent, predictable deviation in measurement that skews results in the same direction every time)
irrelevant to research study, but impacts DV/outcome
if not controlled, uncertain if results are due to IV or confounding variable
How to control for confounding variables
randomly assign participants to treatment groups***
using chance to evenly distribute participant characteristics across all experimental groups
hold CV constant
select participants who share similar traits for that specific variable —> removes variable’s ability to fluctuate results
match ppl on a CV
randomly match one person to another between groups (age, IQ, etc.)
build CV into study (“Blocking”)
add as additional IV
e.g., block ppl based on depression severity then randomly assign ppl in each block to either experimental or control group
statistical control of CV
use a stat technique (e.g., ANCOVA) to remove variability in DV that’s due to the CV
ANCOVA - calculates how much of the DV changes because of the CV and subtracts that noise out. It alters DV raw scores to show what they would look like if every participant had the same CV score. Shrinks the error by lowering leftover unexplained error variance (making main test stronger/more precise. Then compares group differences with adjusted scores.
used in quasi-experimental research where ppl cannot be randomly assigned
e.g., control for age when examining alc use frequency
Blocking
building a confounding variable into the study as an additional IV
e.g., block ppl based on depression severity then randomly assign ppl in each block to either experimental or control group
True Experimental
Quasi-Experiment
requires random assignment to groups
a normal study with IV and DV, but lacks random assignment due to unethical or impossible reasons (“almost/resembles” a study)
must use pre-existing groups
Validity
Reliability
Does the instrument actually measure what it sets out to measure?
Can the instrument be interpreted consistently across contexts?
Face Validity
Content Validity
does the content appear to measure what it says it measures
e.g., BDI items actually fit depression symptoms
degree to which individual items represent the construct
carefully check measure against construct definition
Criterion Validity
Concurrent Validity
Predictive Validity
how well scores correspond with relevant external criterion
does rating teacher’s helpfulness actuallly measure how helpful they are in class?
criterion measured is same as the construct
if you give 2 IQ tests at same time —> similar results
criterion measured some point in the future
GRE predicting grad school grades
Construct Validity
Convergent Validity
Discriminant Validity
how well an instrument accurately represents a non-observable, theoretical concept/trait
positively correlated with other measures of similar constructs
e.g., self-esteem test gives closely matching results with an older, trusted test for self-worth
extent to which scores are NOT correlated with variables that are conceptually distinct (opposite of convergent)
e.g., measure on height does not correlate with depression measure
Structural Validity
degree to which scores of an instrument are an adequate reflection of the dimensionality/ internal components (subscales) of a construct being measured
e.g., Theory says depression has two core parts—cognitive/affective symptoms (sadness, guilt) and somatic symptoms (fatigue, sleep changes).
Structural validity check: A stat test confirms that questionnaire items indeed group into these two distinct sub-factors rather than blurring together
EFA, PCA, CFA stat techniques
Internal Validity
How to strengthen it?
when it allows examiners to determine if there is a causal relationship btwn IVs and DVs
maximize effects of IV
control CV effects
minimize effects of random error
Factors that imapct internal validity
maturation: any change occurring within subjects due to time
(boredom, fatigue, hunger)
history: external event affects participant status on DV
change in clinic procedures, change from DSM-4 to DSM-5
testing: retaking tests can alter performance (practice effects)
changes in accuracy of measuring tools/ procedures throughout a study rather than due to the IV effects
rater gets faster/better with practice —> changes in pretest/posttest material
attrition —> impacts group comparison
ensure there’s no external factors (e.g., lack of transportation)
one group experiences an external event during the study that another group does not
External Validity
population validity
ecological validity
findings can be generalized to other ppl, settings, conditions
generalizability to other ppl
generalizability to other settings
Factors that impact external validity
randomize the order of measures
prevents sensitizing them to study purpose and alter their reaction to IV
ppl have characteristics that make them respond to IV differently
volunteers may have more motivation than non-volunteers
respond to IV in a way bc they know they’re being observed
social desirability/ self-consciousness
multiple treatment interference (order effects)
when exposing each participant to multiple IV levels —> effects of one level can be affected by previous exposure to another level.
cannot generalize results to ppl exposed to only one IV level
e.g., order of music listened to must be randomized to prevent this (music type may influence one’s mood that may linger into other groups. It’s hard to isolate effect of one group alone)
GROUP DESIGNS
Between-Subjects
Within-Subjects
Mixed Design
different groups take part in each condition
manipulate the IV using the same participant (repeated measures)
reaction time after 1 beer, 3 beers, 5 beers
combines both types
compare 4 types of depression therapy (btwn groups) on pre/post 6-mo follow-up BDI scores (within subjects)
Descriptive Statistics
Inferential Statistics
describe/summarize data on variable or relationships between variables (mean, range)
to see how generalizable the sample data is to the population it represents (t-test, ANOVA)
regression analysis —> predicts outcomes
chi-square —> categorical associations
Categorical variable
Dichotomous variable
Continuous variable
Discrete variable
Nominal variable
Ordinal variable
Interval variable
Ratio variable
made up of categories
2 distinct categories
can take on any value of measurement
can only take on certain values (whole numbers)
categories (no numbers) with no order
categories with order
continuous value with equal distance btwn ratings
Needs a true zero
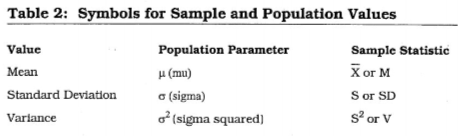
Mean, SD, Variance symbols for Sample vs Population values
Type I error
Type II error
When are they more likely?
Reject true null hypothesis
when alpha is high
Retain false null hypothesis
when alpha is low
small sample size
IV not given in sufficient intensity
small effecti size
alpha
beta
size of rejection region
level of significance (if .05 —> 5% sampling distribution represents rejection region)
probability of making a Type II error
Power
how to maximize power
probability of rejecting null hypothesis when it really is false (correctly saying there is a difference when there is one)
increase alpha (moving from .01 to .05)
increase sample size
increase effect size
minimize errors
use one-tailed test
use parametric test
Parametric test
Nonparametric test