Supply Chain Exam 1
 Call Kai
 Learn
Learn Practice Test
 Spaced Repetition
 Match
Match Flashcards
 Knowt Play
1/52

There's no tags or description
Looks like no tags are added yet.
Name | Mastery | Learn | Test | Matching | Spaced | Call with Kai | Chat |
|---|
No analytics yet
Send a link to your students to track their progress
53 Terms
Quick, Candid, Courteous
Fast, natural, respectful.
Management Triangle
Senior Management (lead), middle management (manage), entry level (learn and do).
Operations and Supply Chain Management (OSCM)
The design, operation, and improvement of the systems that deliver goods and services to customers.
Supply Chain
The entire process of moving Material, Information, and
Products to and from the Sourcing, Manufacturing, and Service processes of a firm.
Development of Supply Chain
Standardization & transportation → mass production → management science → "Just In Time" → quality → e-commerce → analytics → connected/digital operations → resilience & AI
Five Supply Chain Processes
Planning, sourcing, making, delivering, returning.
Goods
Tangible (patentable), there is little or no direct contact with end customers, produced to consistent and measurable standards, and production can be scheduled by Firm.
Services
Intangible (usually not patentable), firms interact directly with end customers, delivery is highly variable, perishable (Time-Sensitive).
Products
What firms produce and sell. Can be goods, services, or a combination of both.
Pure Goods
Low-margin or commodity products (ex: gas, milk)
Core Goods
A significant Service Component sold with the Product (ex: appliances, data storage systems, automobiles)
Core Services
Include both tangible and intangible products (ex: McDonald's, Amazon)
Pure Services
Exclusively intangible services (Colts, Butler)
Efficiency
Performing processes at the lowest possible cost.
Effectiveness
Performing processes to create the most value for customers (even if the cost of processing is higher).
Benchmarking
Comparison of Processes, Results, and other Metrics to others.
Triple Bottom-Line Sustainability
1. Social Responsibility
2. Financial Performance
3. Environmental Stewardship
Core Competency
The one thing that a firm can do better than its competition (hopefully sustainably).
Mutual Exclusivity
The idea that a company has to choose where to focus its resources because it cannot be the best at everything (there are always trade-offs).
Qualifiers
The characteristics a company or product must have to be considered by customers (basic needs met).
Contract Manufacturer
A firm produces goods (often under contract) for another company.
Product Innovation
Creating new ideas or products so a company does not fall behind its competition.
Design for Manufacturing and Assembly (DFMA)
A systematic review of product design and usage to determine how the product can be simplified or improved (want to do things as simply and cheaply as possible).
Supply Chain Risk
The likelihood of a disruption that could affect a firm's ability to continuously supply goods and services.
Supply Chain Risk Management
The process of identifying potential disruptions, assessing their impacts, developing mitigation plans, and following up on outcomes.
Forecasting
Using information and techniques to predict future demand.
Decoupling Point
The point in time when the customer takes ownership of the product. We want to get there as fast as possible because that speeds up cash flow, less spending on inventory storage
Forecast Limitation
Forecasts are never completely accurate because there are often too many variables that can affect demand.
External Impacts on Demand
Economic Conditions (i.e. inflation), Government Policies/Elections, War/Military Actions, Political Uncertainty, Climate Change, Social Unrest, Pandemics
Consumer Inputs/Behavior
Selling price, Payroll Cycles ("First of the Month"), Advertising/Promotions, Consumer Confidence, Weather/Seasonality, Competitive factors, Product Life-Cycle
Qualitative Forecasting
Forecasting using consumer feedback or
managerial judgement, expertise, or experience.
Quantitative Forecasting
Forecasting using numeric models.
Causal Forecasting
Forecasting using observed demand patterns. If price goes down → demand goes up, and vise versa.
Time Series Analysis
Past demand is used to predict future demand.
Seasonality
Predictable variation in demand that happens within a calendar year.
Cyclicality
Predictable Demand variations across multiple years. Often difficult to determine, since this technique may require several years to identify.
Simple Moving Average
Forecast is the average of a fixed number of past periods.

Weighted Moving Average
Forecast is made from past data where more recent data is weighted more heavily.

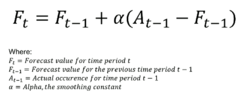
Exponential Smoothing
Time-series forecasting technique using weights that decrease exponentially for each past period.
Benefits of Exponential Smoothing
1. Exponential models are surprisingly accurate
2. Formulating the exponential models is relatively easy
3. Users can understand the model
4. Little computation is needed for the model
5. Computer storage requirements are smaller because of the limited use of historical data
6. Tests for accuracy as to how well the model is performing are easy to compute
Causal Forecasting Equation
Forecasting based on independent variable(s). Must have two sets of known data points (independent & dependent). Identify the SLOPE of the data points. Determine an INTERCEPT for the data points. (y=mx+b)
Multiple Regression Forecasting
Requires advanced data analysis techniques, particularly useful for location and demographic planning.
FORECAST.ETS
Returns the forecasted values for a specific future target date using exponential smoothing method. It can handle a lot of data and pinpoint a period far in advance.
Collaborative Planning, Forecasting, and Replenishment (CPFR)
Online access to demand and sales data. Retailers and advanced manufacturers are leaders.
Vendor-Managed Inventory Replenishment (VMI)
As the vendor, you manage the inventory inside the retailer's building. Transferable skill set, people pay a premium for it.
Capacity
Output that a system can achieve in a given period of time. What we're capable of doing.
Best Operating Level
Output level where Average Unit Cost is minimized.
Capacity Utilization Rate
Firm's Current Output Rate ÷ Best Operating Level
Strategic Capacity Planning
Planning the overall capacity level of capital-intensive resources to best support the firm's long-term strategy.
Economies of Scale
As volume increases for a given operation, the average cost per unit decreases (until the point of diminishing returns).
Diseconomies of Scale
As plants or production increase, it becomes difficult (and often dangerous) to keep an operation's efficiency (unit cost can increase). Things start to cost more money as we add more units.
Focused Factory
Production facilities designed for a limited set of production
goals and dedicated to a specific product or product group tend to be more efficient (high volume) (specialization)
Plant Within a Plant (PWP)
Focused operations are limited to specific areas within a larger facility (more flexibility/higher costs).