Scarcity, Work, and Choice
 Call Kai
 Learn
Learn Practice Test
 Spaced Repetition
 Match
Match Flashcards
 Knowt Play
1/3

Earn XP
Name | Mastery | Learn | Test | Matching | Spaced | Call with Kai | Chat |
|---|
No analytics yet
Send a link to your students to track their progress
4 Terms
What does opportunity costs describe?
-The unavoidable trade-offs in the presence of scarcity.
-Satisfying one objective means satisfying the other objective less
Have people used economic progress to consume more goods to enjoy more free time? Use America as an example
-Both: but it is in different proportions.
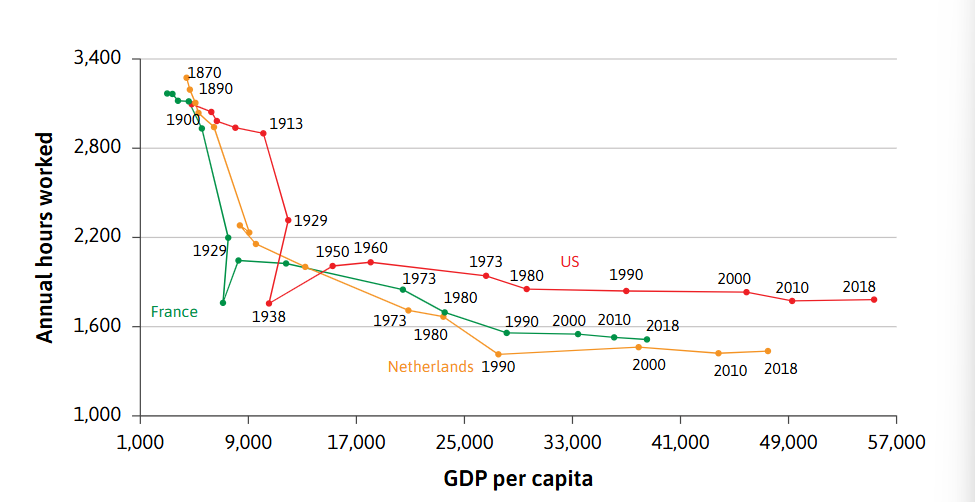
USA: Hourly earnings increased by 6 times for 20th-century Americans, yet their average annual work time fell by around 33%. So by the end of the century, Americans had a 4x increase in annual earnings, and around a 1/5 x increase in their free time.
Generally speaking, what is the relationship between GDP per Capita and Annual hours worked for Western nations? Specify the timeframe
-Generally speaking, as nations progressed through the 20th Century, as their GDP per capita increased, it was accompanied by a dramatic fall in hours worked, then stabilising shortly after
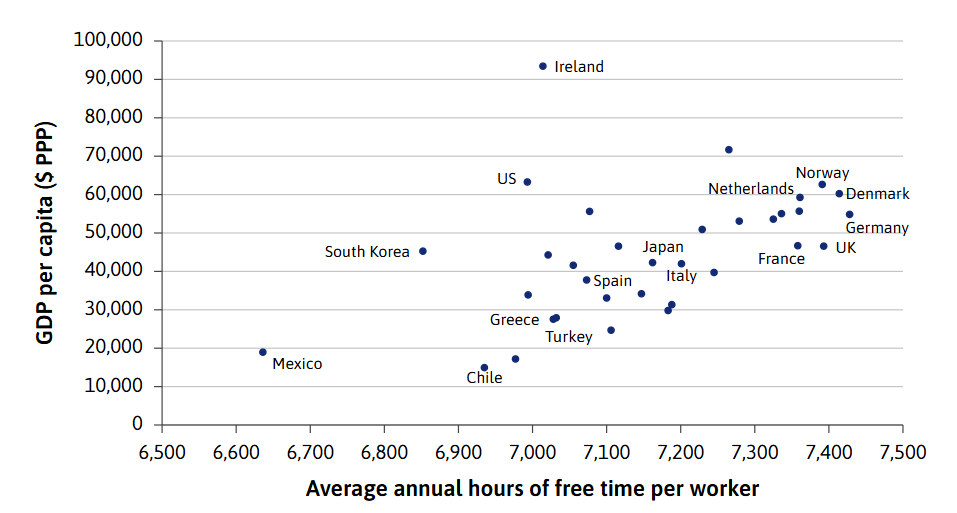
Generally speaking, do all nations follow this trend of increasing free time as GDP per capita rises?
-Overall, HIC’s do follow this trend, but they do end up in markedly different outcomes.
-America, Greece and Ireland have similar levels of free time (7000 hours) but significant differences in levels of GDP per Capita (32K vs 62K vs 92K)
-South Korea, Japan and Britain have similar levels of GDP per Capita (45K) but significant differences in levels of free time (6850 vs 7150 vs 7400)