Final ABC Notes
1/443
There's no tags or description
Looks like no tags are added yet.
Name | Mastery | Learn | Test | Matching | Spaced |
|---|
No study sessions yet.
444 Terms
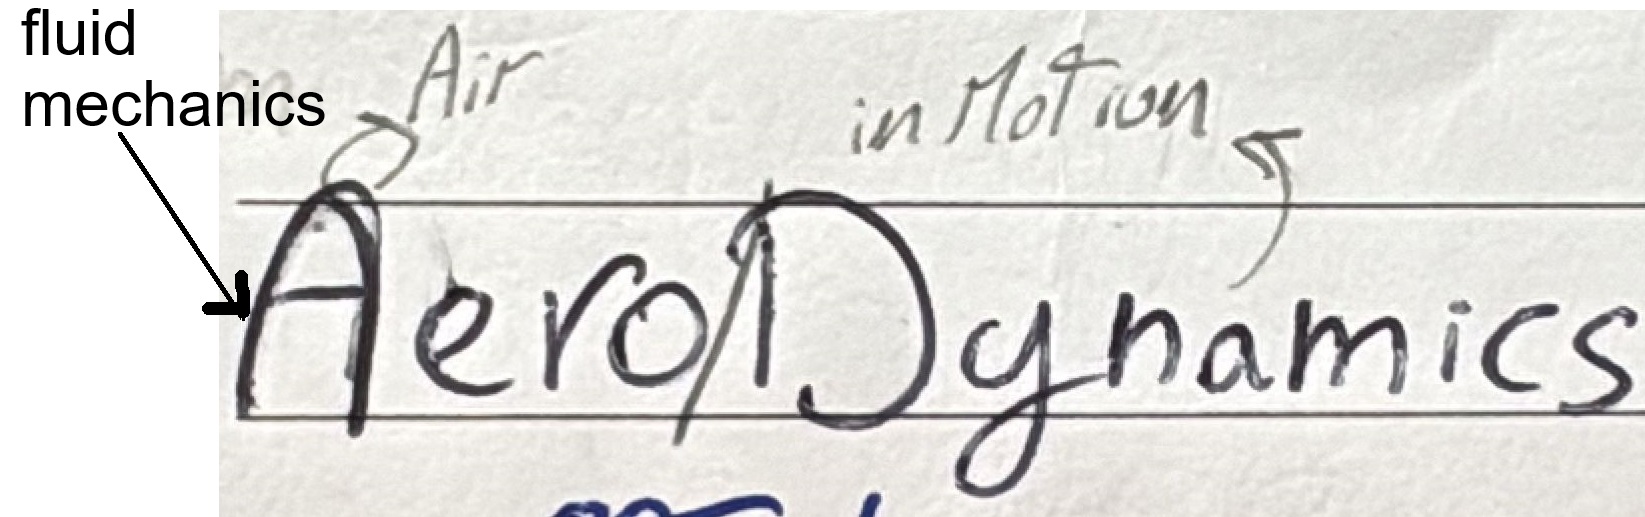
Aerodynamics
Branch of Fluid Mechanics
studing Air in Motion
(Main science that Aviation is Based on)
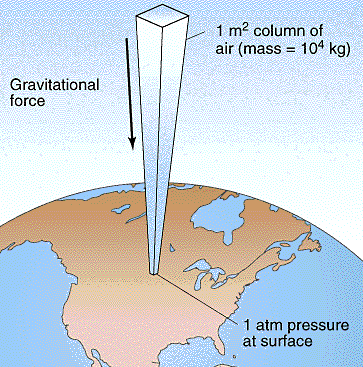
Pressure (Atmospheric or Barometric)
Weight of an Air Column measured
from Surface to the Top of the Atmosphere.
Which is (the Force per unit Area Exerted on a body Above an Atmospheric Column)
Density
Mass per unit Volume
when d↑, performance ↑
Typical density values with increasing altitude would be:
20,000 ft. Density is 50% of the surface value.
40,000 ft. Density is 25% of the surface value.
60,000 ft. Density is 10% of the surface value.

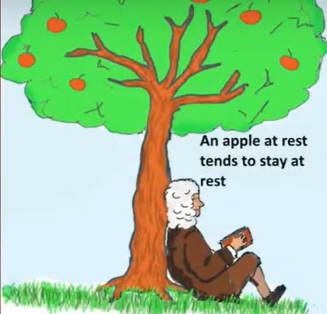
Newton's 1st Law of Motion: “Inertia”
A body at rest tends to remain in rest
and a body in motion tend to remain in motion
@ Constant Speed & Same Direction
Newton's 2nd Law of Motion
F = M x A
when a force acts on a body, its
Resulting Acceleration is
Directly proportional to Force,
Inversely proportional to Mass

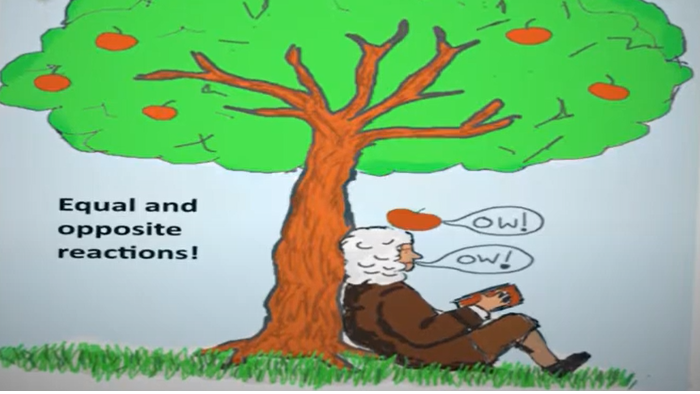
Newton's 3rd Law of Motion
Actions have Reactions,
Equal in force & Opposite in Direction
Continuity Equation
Area X Velocity is Constant
‘smaller area makes air speed up,
larger area makes air slow down
because the same mass must pass through’
Leading to Bernoulli’s Equation.
Bernoulli's Princple
As Velocity⬆ Increase
Press. ⬇ Decreases
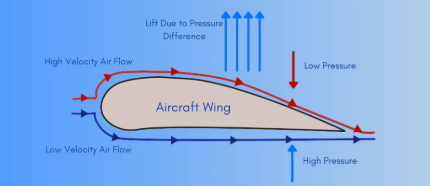
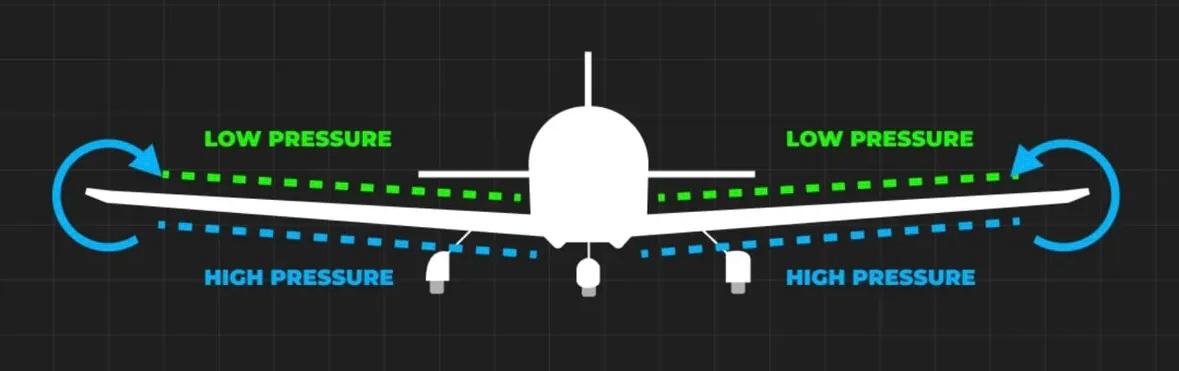
Lift
Upward Force created by
Difference in Air Pressure
Above (⬆ Velocity, ⬇Pressure)
Below (⬇ Velocity,⬆Pressure) the Wing.
equation; ½ρ×V²×CLxS
at High altitudes lift Decreases
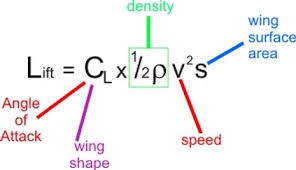
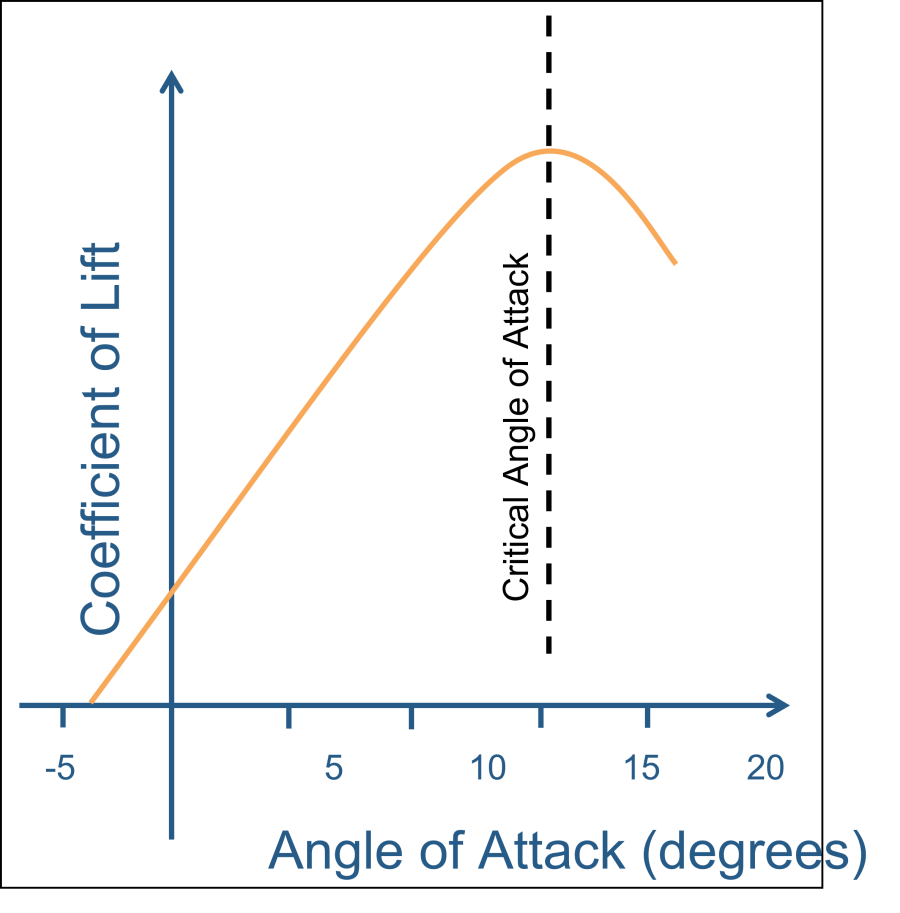
Coefficient of Lift (CL)
Lift Variation depending on
Shape & Inclination of the airfoil.
Coefiecent of Lift Max (CLmax)
Highest point in CL & AoA Curve.
the highest value of lift coefficient (CL) a wing can produce at a given airspeed
just before the stall.
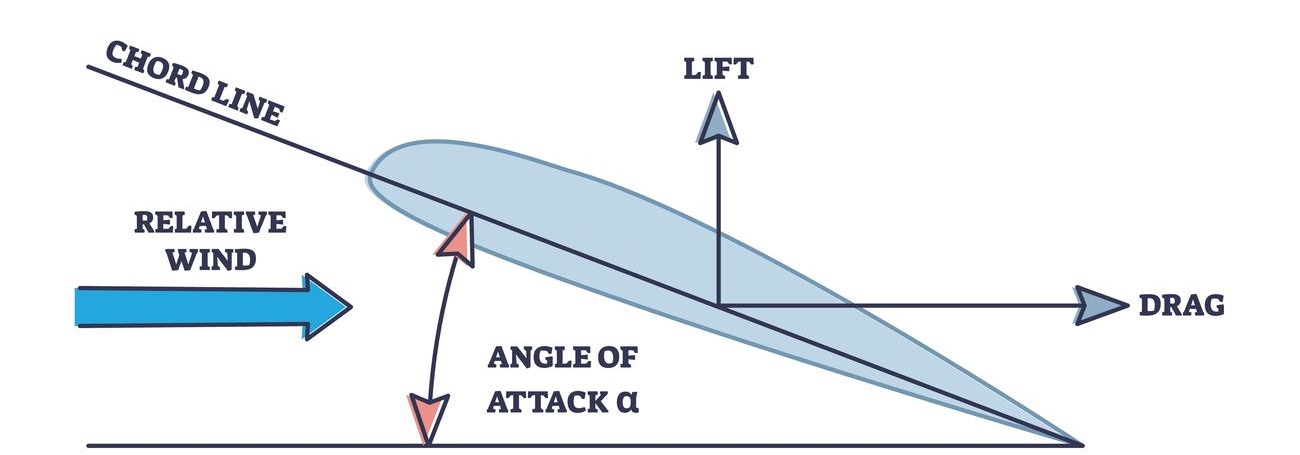
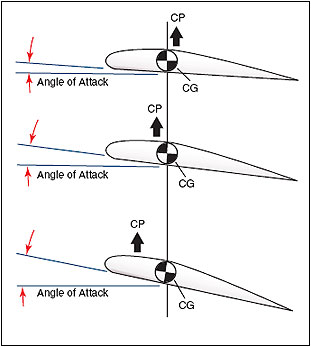
Angle Of Attack (AoA)
angle between
Chord line & Relative wind
Opposing it

Relative Wind
Air moving across the airfoil.
Critical Angle of Attack
(Critical AoA)
Highest point in CL & AoA Curve.
where CLmax is reached which is:
the highest value of lift coefficient (CL) a wing can produce at a given airspeed
just before Stall.

Chord
Distance Between,
Leading and Trailing edges

Chord Line
Imaginary Straight line
connecting between Leading and Trailing edges of the wing.
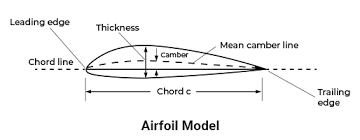
Leading edge
Part of the wing that meets the air First

Trailing edge
Part of the wing that meets the air Last

Mean Line
Imaginary Equidistant line
between Upper & Lower surfaces of the wing

Camber
Distance from
Straight Chord-line to Equidistant Mean-line

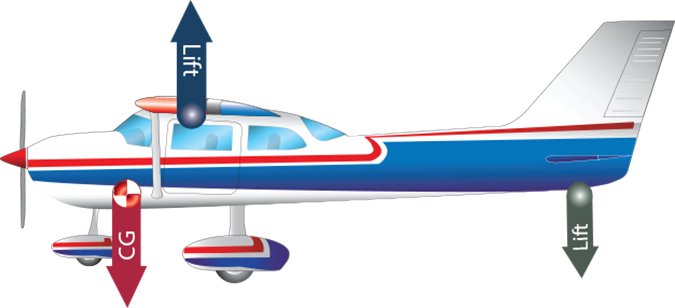
Center of Pressure (CP)
Point on Chord line where the Aerodynamic Force Acts.
Center of Gravity (CG)
Point at which your aircraft would Perfectly
Balance if it were Suspended from it.
Drag
Any force
Opposing airfoil in its
Forward Motion.
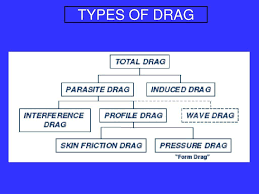
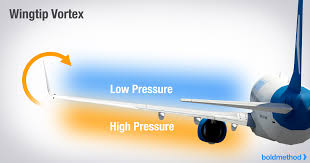
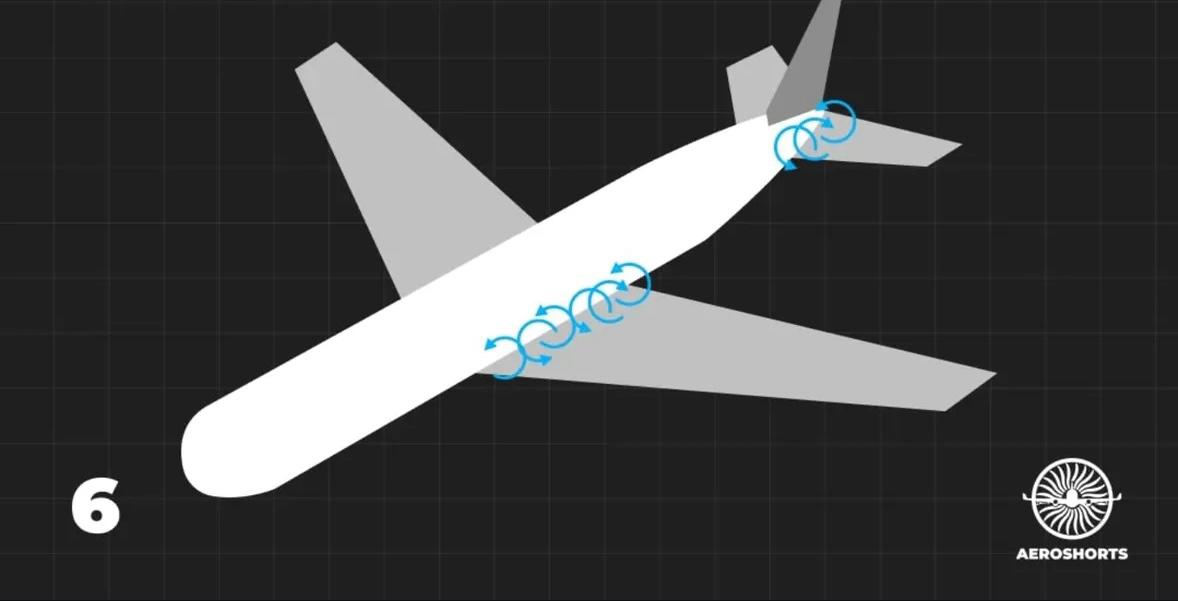
Induced Drag
Portion of the total drag
Created by Production of lift
Due to Downward Deflection of air
Happens at Low Speeds & High AoA
creating Wing Tip Vortices
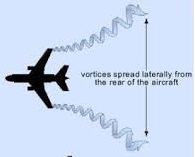
Down wash
Wake Turbulence
function of an aircraft Producing lift, resulting in the formation of
2 counter-rotating vortices trailing behind the aircraft.
greatest vortex strength on climb out when jet is
Slow, Clean, Heavy with High (AoA).
Wing Tip Vortices
Circular patterns of rotating air
created at the tips of wings due to pressure differences above and below the wing.
must be Heavy, Slow,
with High AoA
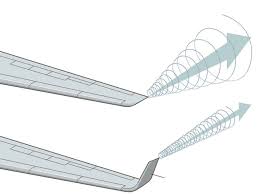
Winglets
Vertical Extension of the wing
Reducing induced drag and
Solving wing tip vortices problem
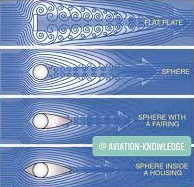
Parasite Drag
Created by Any part of the airplane
Not Contributing to Production of Lift
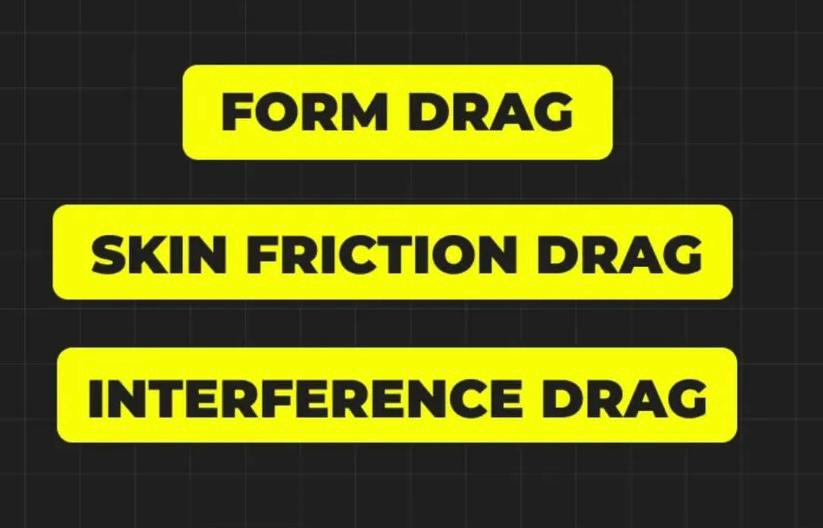
Form drag
Parasite drag Resulted from Turbulent wake.
Caused by the Separation of airflow from Structure
fixed by Streamlining
Interference Drag
parasite drag from Varied Currents of Airflow Interaction
with any 2 Parts in conjunction
(Drag due to the interaction of individual boundary layers at the junction of aircraft major components)
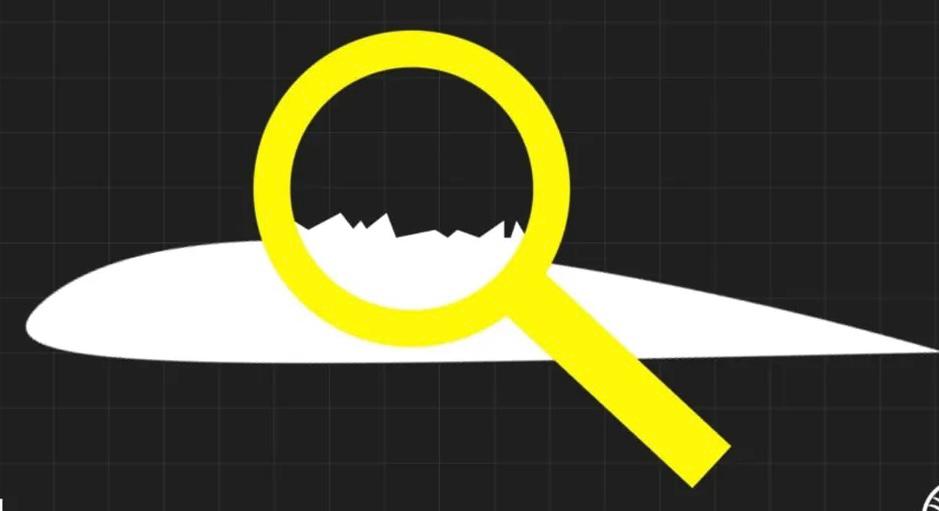
Skin-friction Drag
type of parasite drag due to airplane's surfaces Roughness
Structural Drag
Type of parasite drag Acting on
Any Structure of the plane
Profile Drag
Type of parasite drag Acting on the Wing
(Combination Form + Skin friction)
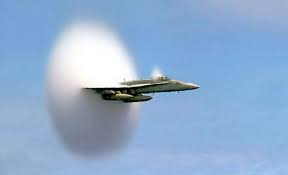
Wave Drag
due to Shock wave Formation
Only in Transonic and Supersonic
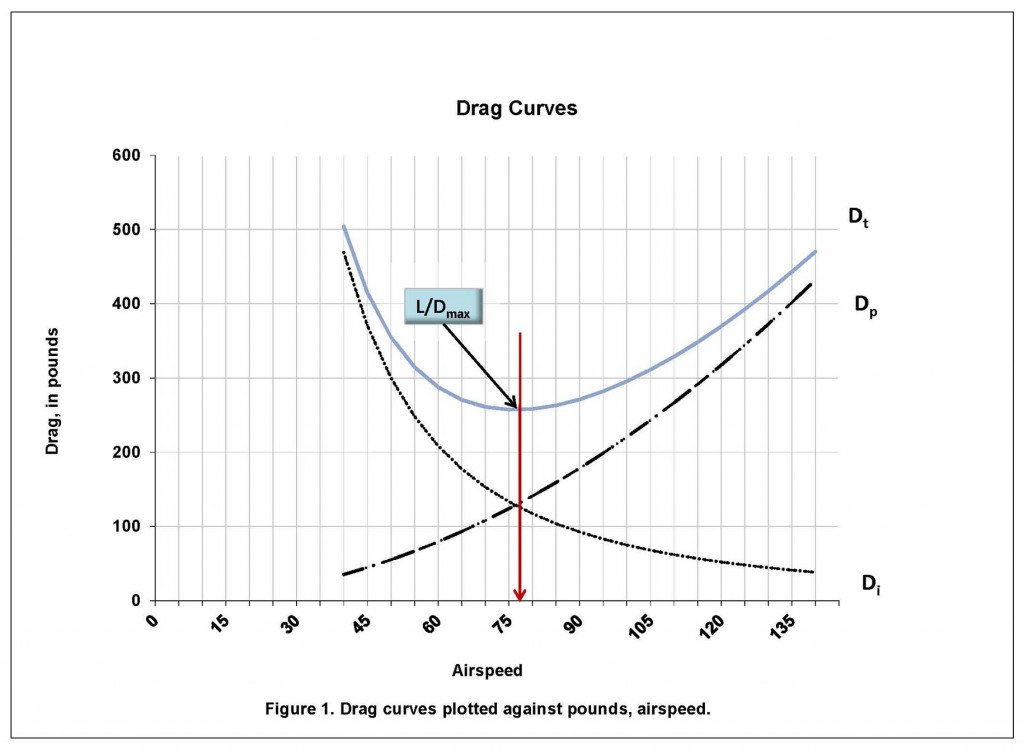
Total Drag
Sum of Induced and Parasite drag
Lift to Drag Ratio
The amount of lift generated by a wing compared to its drag.
L/Dmax (best Lift to Drag ratio)
Point where Total Drag is at its Minimum.
Providing Best:
Endurance Speed &
Fuel Flow (minimum fuel consumption per hour)
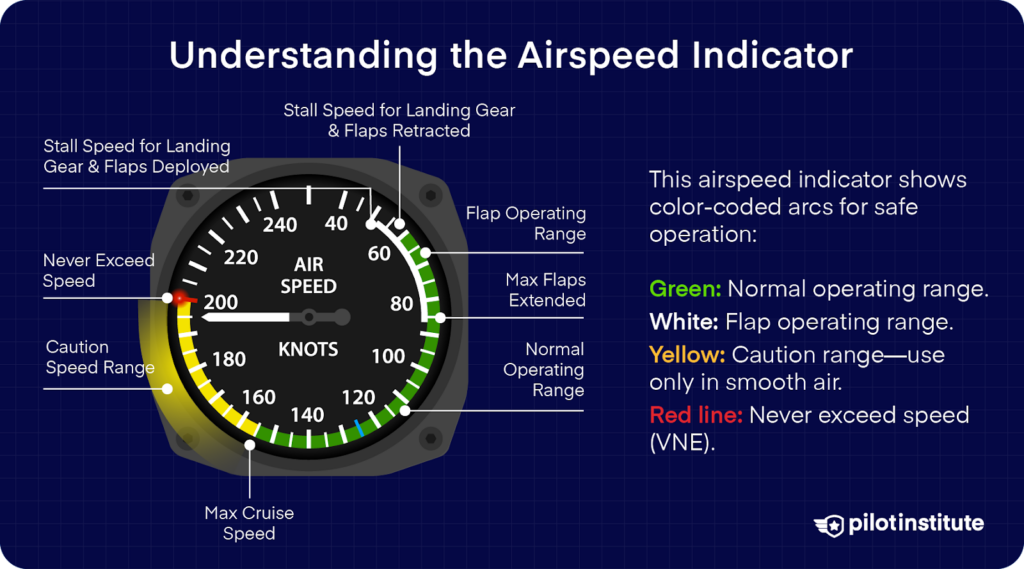
Indicated Airspeed (IAS)
speed Observed on the airspeed Indicator
Not corrected for Position Errors

Calibrated Airspeed (CAS)
Indicated airspeed corrected for Positioning errors

Equivilant Airspeed (EAS)
Calibrated airspeed corrected for Compressibility errors

True Airspeed (TAS)
Equivalent airspeed corrected for
Density variation
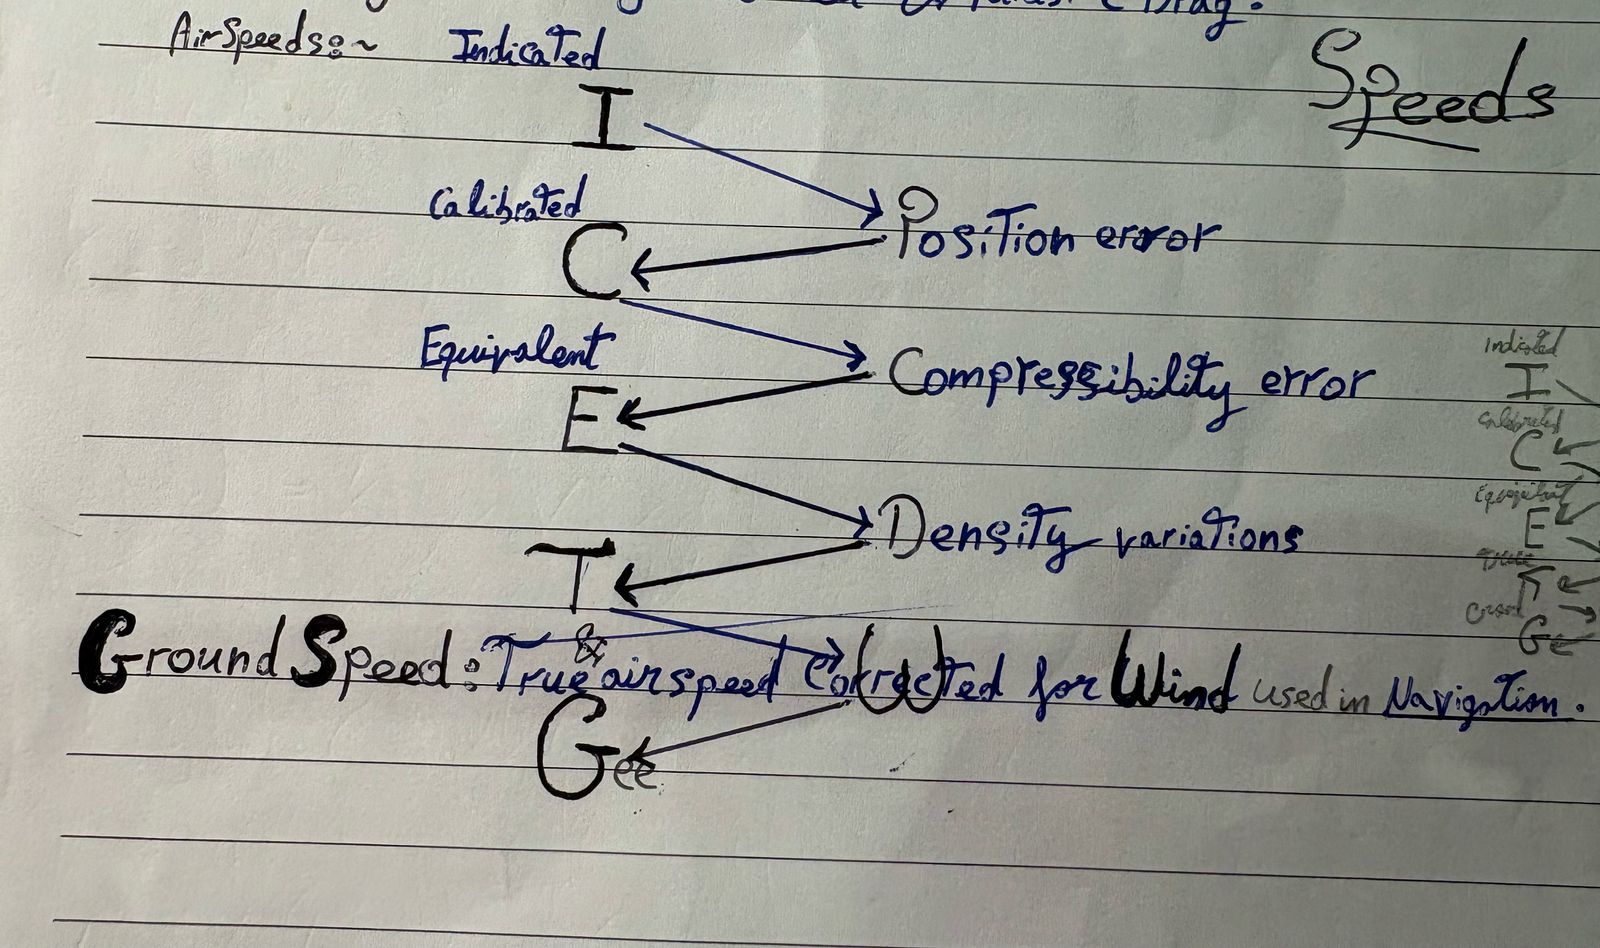
Ground Speed (GS)
True airspeed corrected for Wind variation
used in Navigation

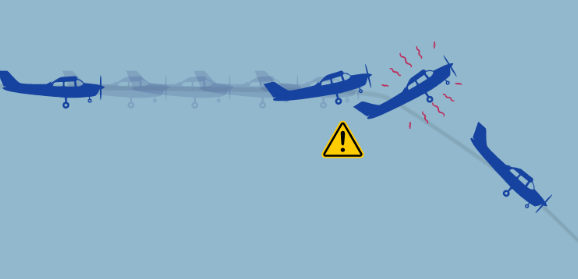
Stall
Rapid Decrease in lift caused by separation of airflow from wings surface
Factors Affecting Aerodynamic Forces of a Wing (3eS,@,MAD)
Divided into 3 parts,
1st; Wing's
1. Surface Area (S)
2. Span
3. Sweep Back Angle
Then
1. Aspect ratio
2. Taper ratio
3. Thickness to chord ratio
Lastly,
1. Mean aerodynamic chord (Mac)
2. Angle of incidence
3. Diherdral angle
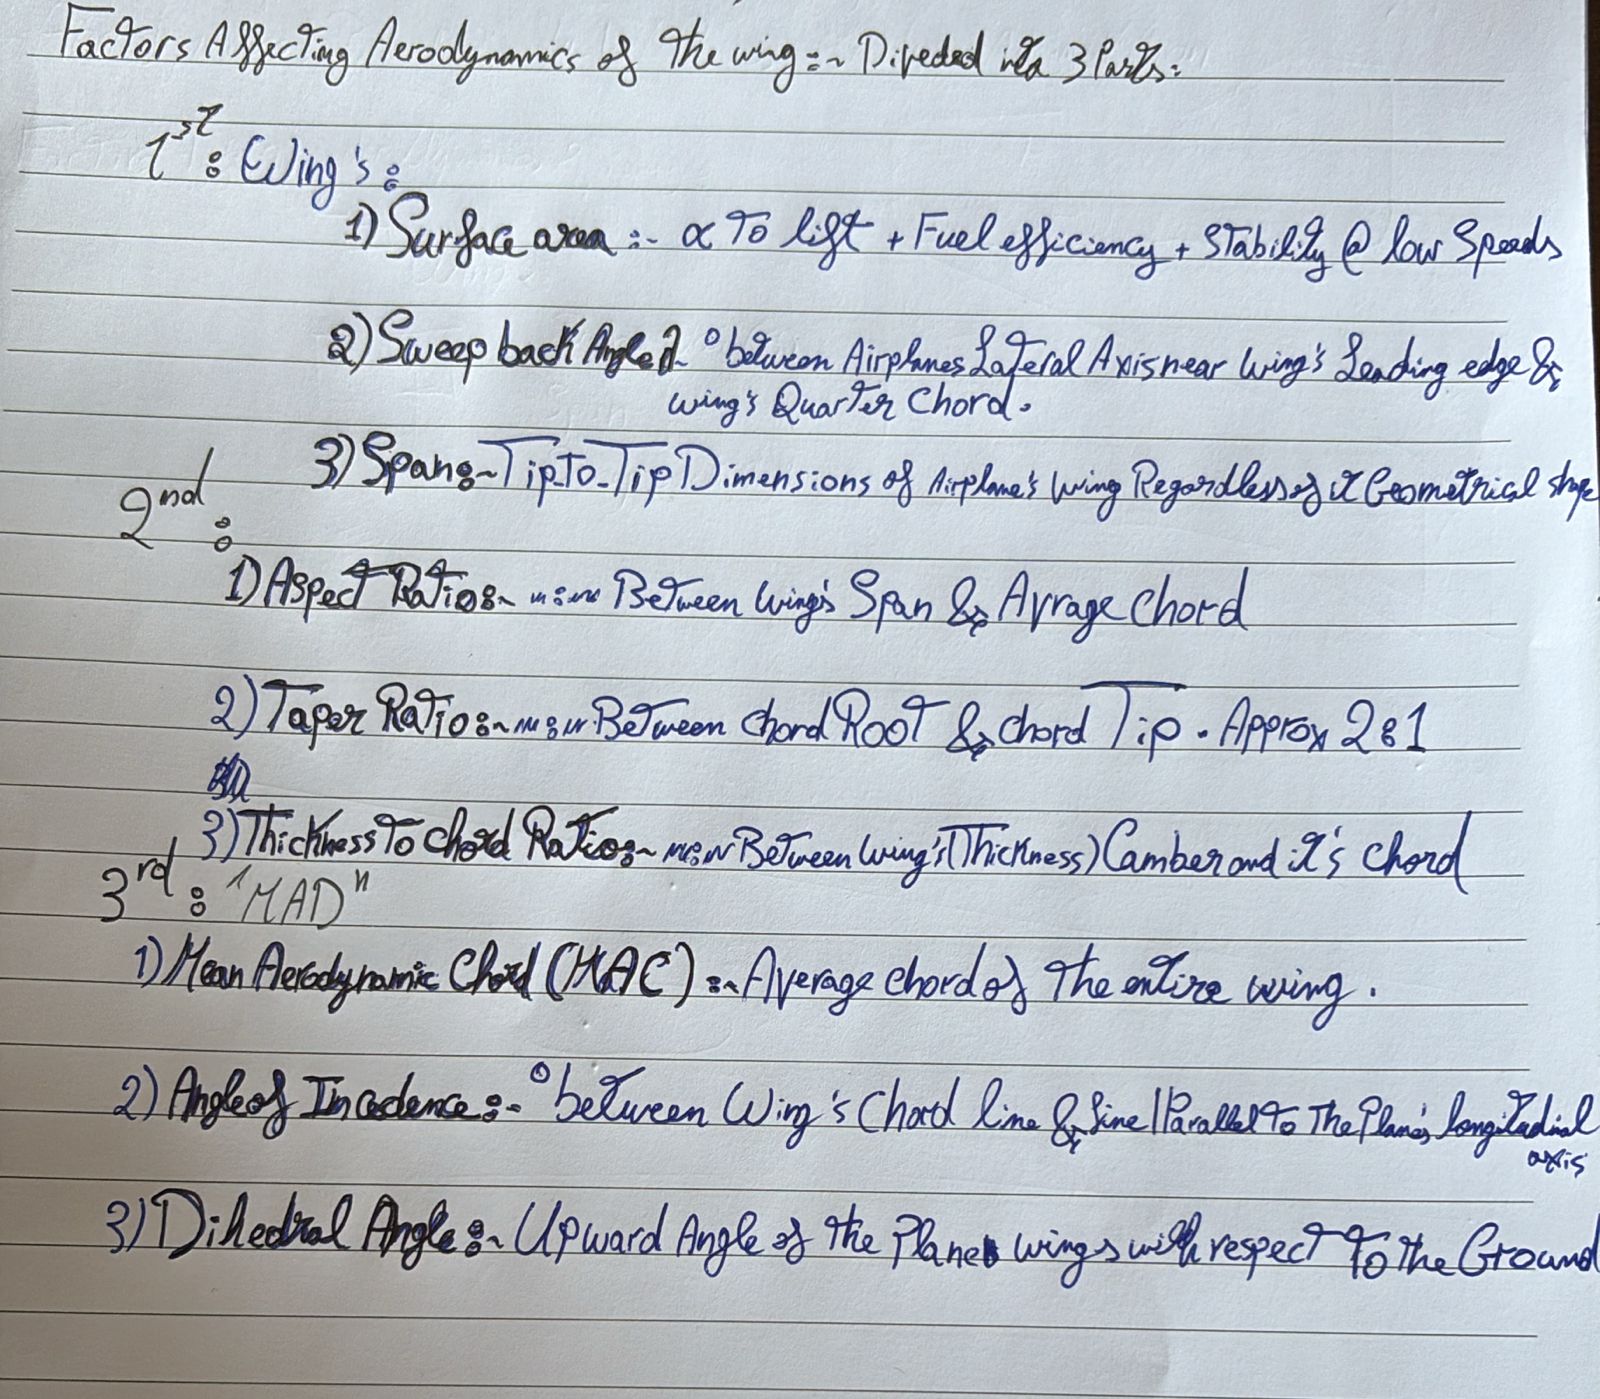
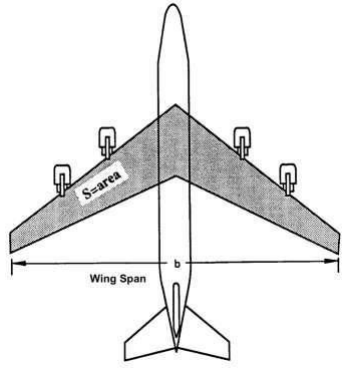
Wings Surface Area
directly proportional to Lift
if increased can
Better Stability@Lower Speeds
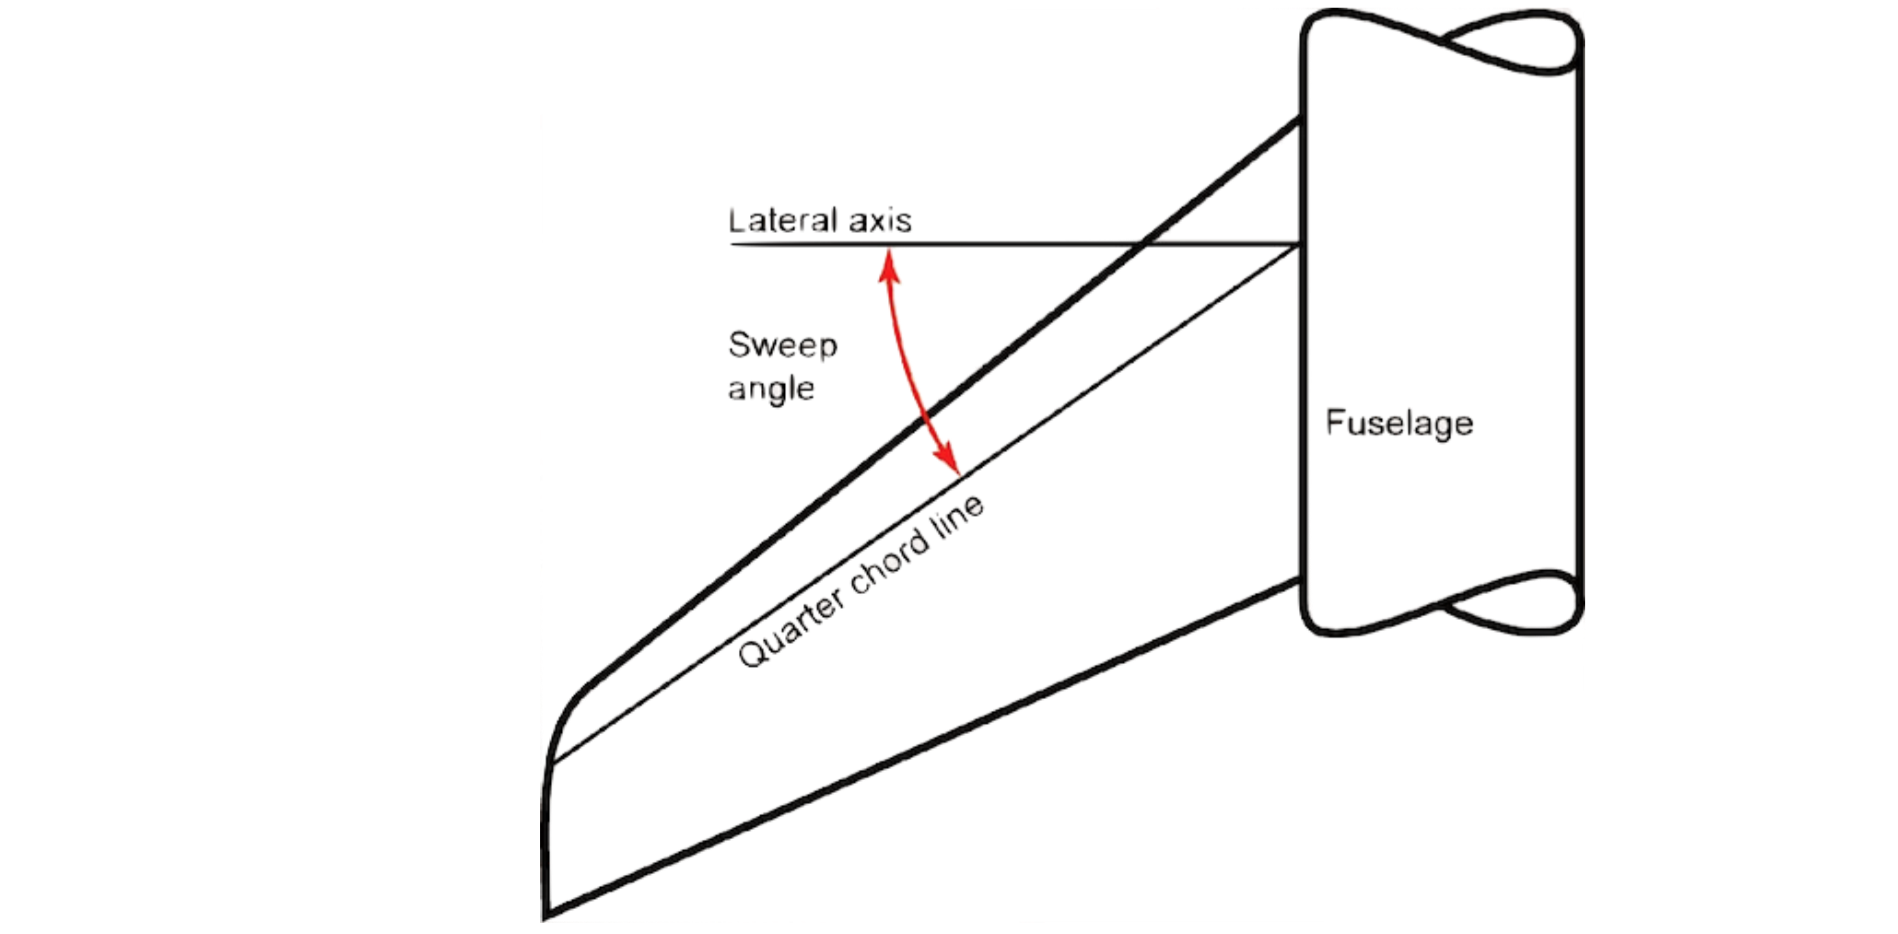
Sweepback angle ‘λ’
Angle between airplane wing’s
Lateral axis in Leading edge,
and its Quarter Chord
Allowing airplanes to fly at higher speeds without facing Shock Wave 🍩
Wing Span
Tip-to-Tip dimension of the airplane wing,
regardless of its geometric shape

Aspect Ratio
Ratio Between Span divided by Average Chord of the wing.

Taper Ratio
Ratio between Root chord and Tip chord
Approx: 2:1 Ratio

Thickness to Chord Ratio
Ratio between wing's Camber and its Chord.
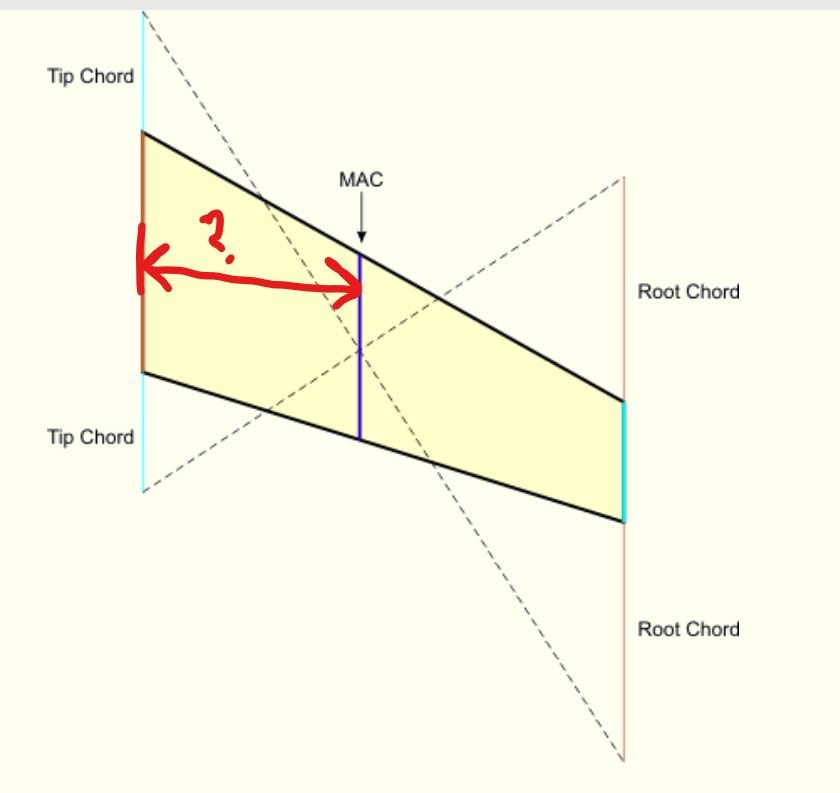
Mean Aerodynamic Chord 'MAC'
Average chord of the Entire Wing.
(CP) concentrates on it.
Used in weight and balance calculations
Angle of Incedence
Angle between Wing’s
Chord Line & a line Parallel to plane's Longitudinal axis.
Slightly ⬆Increasing AoA during Cruise

Dihedral Angle
Upward angle between Plane's
Wing & Ground.
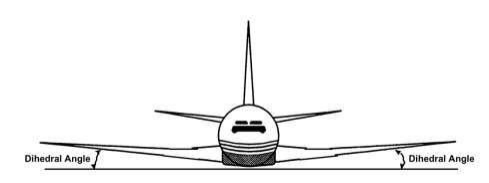
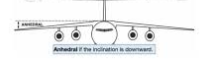
Anhedral Angle
Downward angle between Plane’s Wing &
Ground.
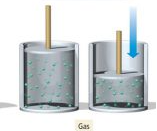
Compressibility
Increase in the Volume of matter
when External Force is Applied
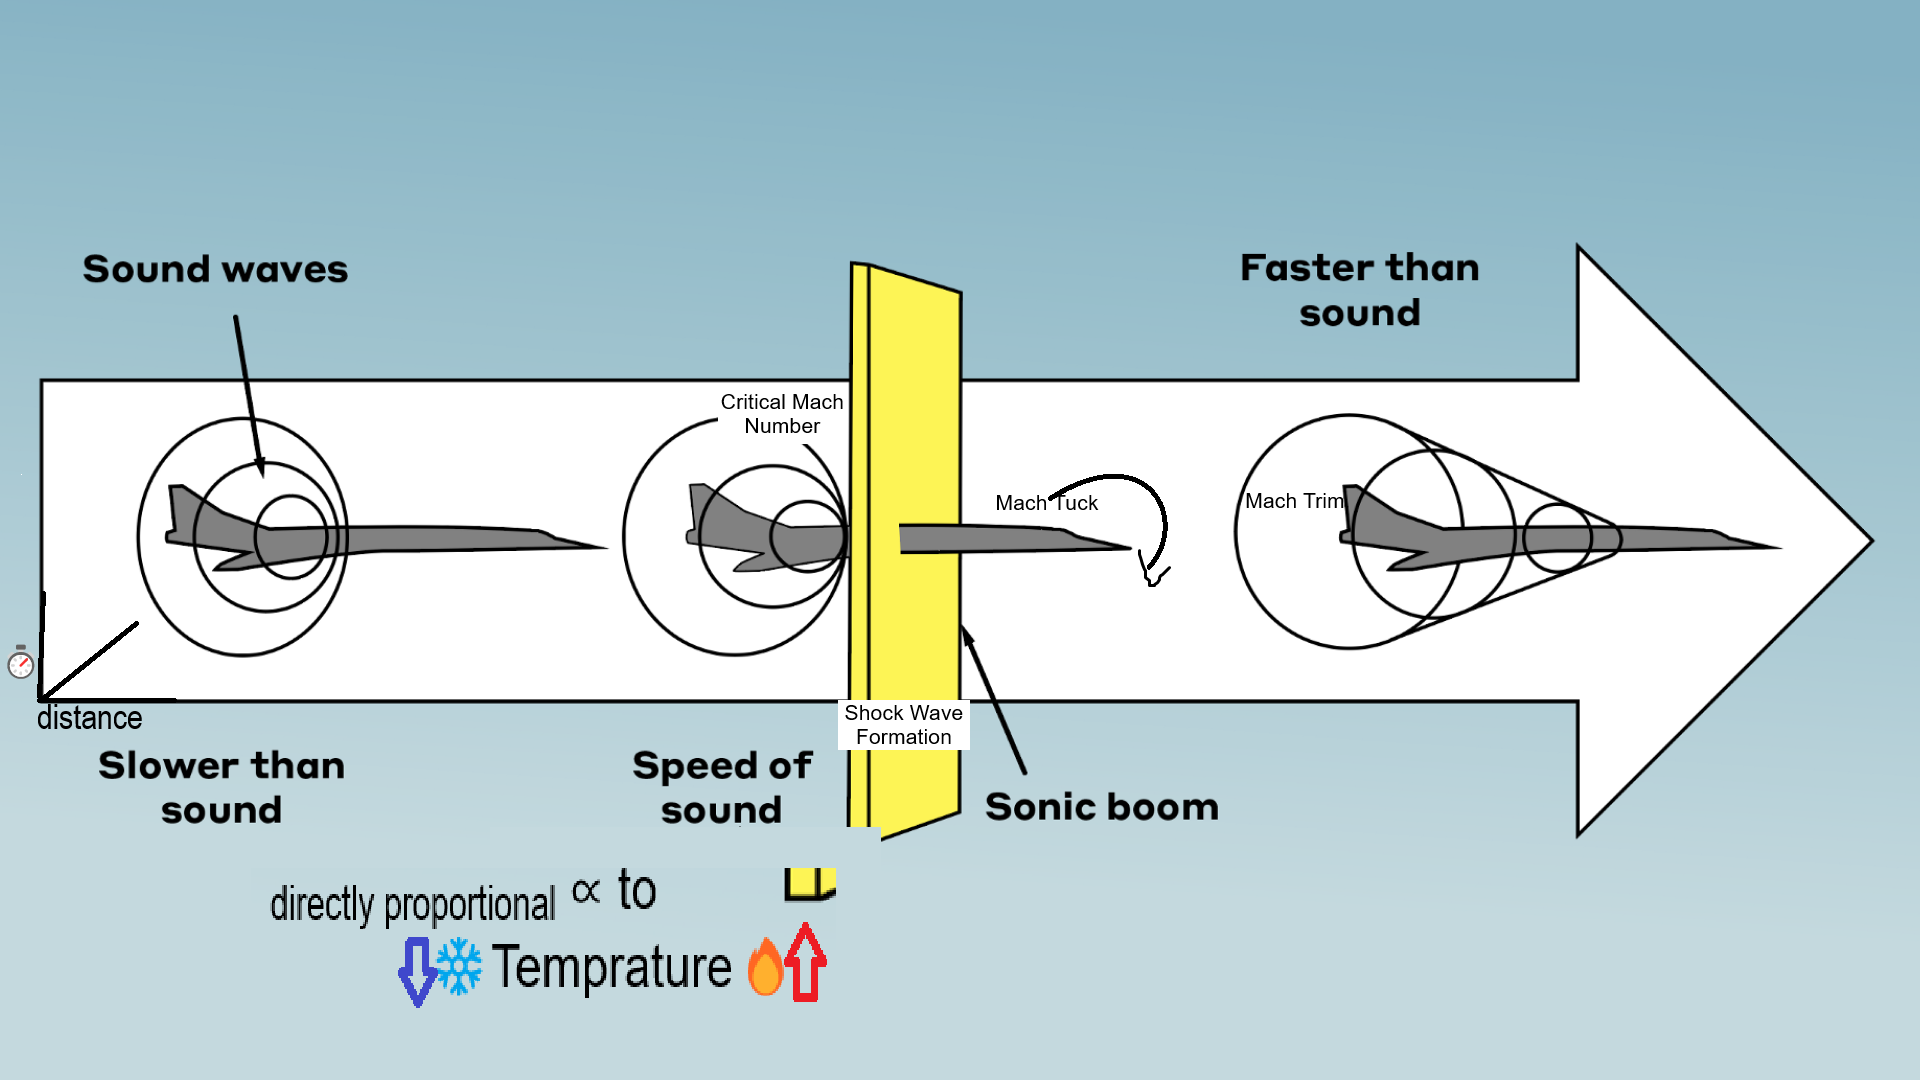
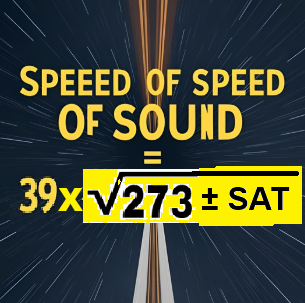
Speed of Sound
Distance traveled per Unit time
as sound wave Propagates
Directly ∝ to Temp.
(SoS= 39 × √(273 ±SAT))
Speed of sound Equation
= 39 × √(273 ±SAT)
Shock Wave 🍩
Boundry Layer between
Compressed & Undisturbed air
Shoke Wave Characteristics
1-⬆increase in TPD
"Temp., Press, Denisty"
1- sudden ⬇decrease in ‘Velocity'
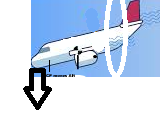
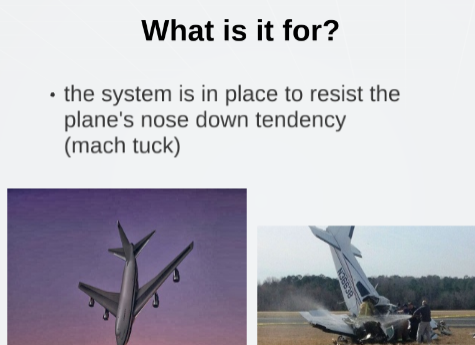
Mach Tuck (Tuck Under)
Due to Shock wave Formation.
(CP) move Aft
causing Nose of airplane to Drop Down.
MACH Trim
used for Mach Tuck Avoidnance
by sending Signals to
Pitch Control surfaces (Elevator)
Resisting Airplane Nose Down tendency
MACH number
Ratio Between
True Airspeed & Speed of Sound

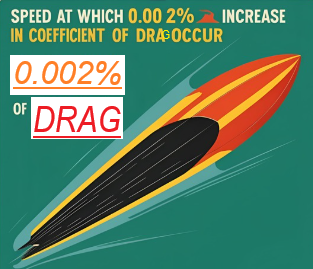
Critical MACH number
Speed at which Coefficient of DRAG increase by 0.002%⬆
Factors Increasing Critical MACH number (SVL)
1- Swept Back wing
2- Vortex Generator
3-Less thickness to chord ratio
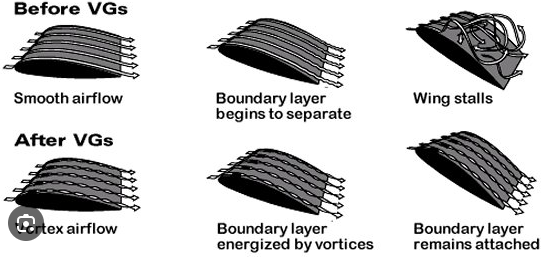
Vortex Generator
Small aerodynamic device delaying Airflow Separation.
Dutch Roll
Swept Back wings Planes Encounter them more often;
due to Uncoordinated Rudder Defliction which is
Combination of Continuous
Rolling & Yawing Oscillation
occurs when:
⬆Dihedral effect
is more Powerful than
⬇Directional Stability
the advancing wing is at a higher angle of attack (dihedral effect) and presents a greater span to the airstream, which is why the roll is so pronounced

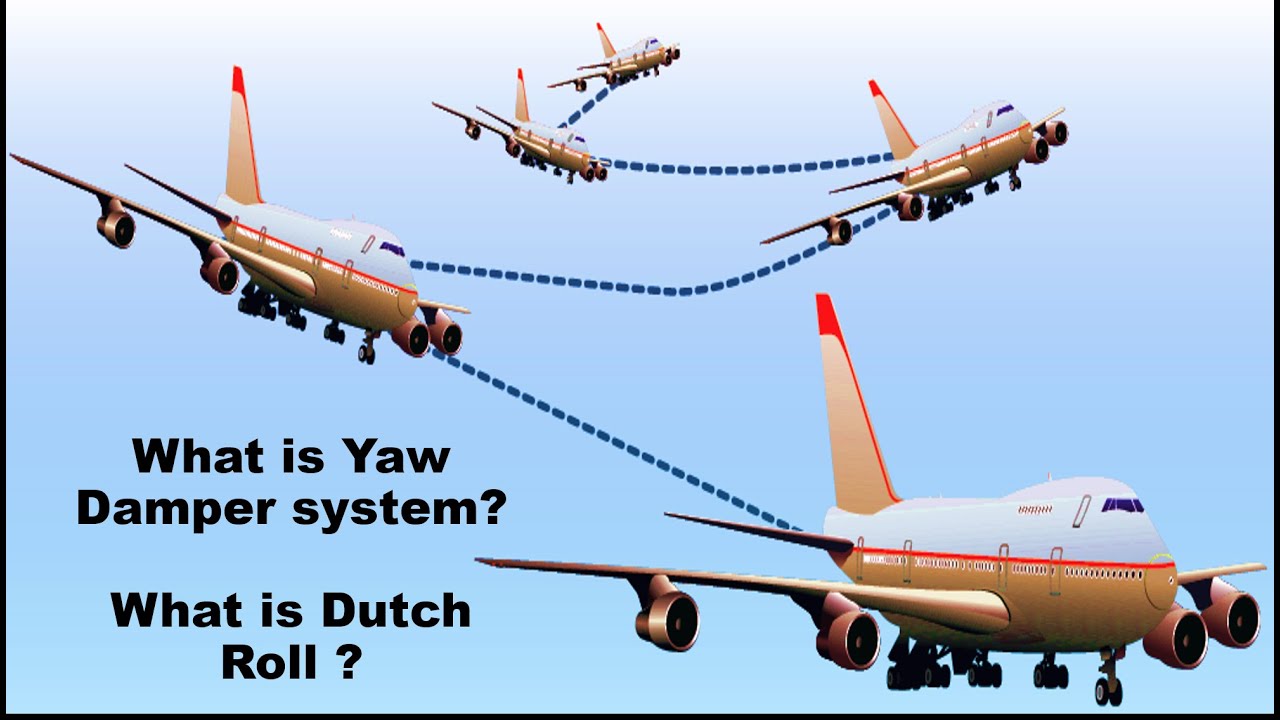
Yaw Damper
Automatic flight control system on the Vertical axis
Counterattacks
Rolling & Yawing Oscillations
produced by Dutch roll by controlling Rudders
lift to drag ratio (L/D)
Relation between lift generated by wings to drag opposing it

Best lift to Drag ratio
Point where Total Drag is at its Minimum

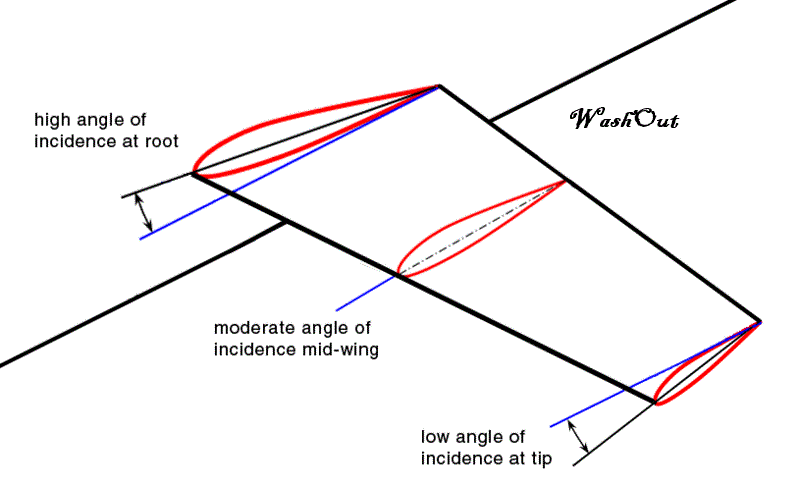
Washout
⬇ Angle of Incidence
from Root to Tip
this is usually to ensure that @Vs
Root stalls before the Tip,
providing the aircraft with
(CAC) Continued Aileron Controllability
Aircraft's Speed Margines
(1)Vs
(2)Vmo/Mmo
(3)Vdf/Mdf
Vmo/Mmo 'Maximum Operating speed'
Indicated airspeed to be
Intentionally flown,
in knots or in Mach number,
Ensuring safe Operation of the aircraft
Vdf/Mdf 'Maximum Demonstrated Flight Speed'
Highest airspeed
planned to be flown
in Knots and Mach number
Achieved in Certification Testing
aircraft speed Regimes
1. Subsonic:Below 0.75
2. Transonic: From 0.75 To 1.20
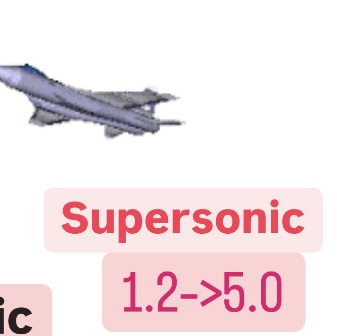
3. Supersonic: From 1.20 To 5.00
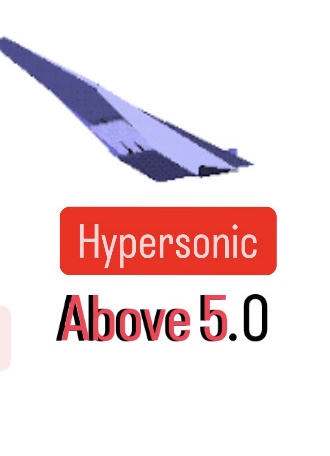
4. Hypersonic: Above 5.00

1. Subsonic:
Mach numbers Below 0.75
2. Transonic
Mach numbers From 0.75 To 1.20
3. Supersonic
Mach numbers From 1.20 To 5.00
4. Hypersonic
Mach numbers Above 5.00
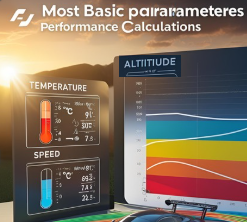
Performance Calculations
to know Weight and Calculate Profit from payload
Payload
Weight of Pax, Baggage, & Cargo.

Basic Parameters affecting aircraft's performance
(1/∝)Temperature
(1/∝)Altitude
(∝)Speed
Temprature benefits in aviation
Performance Calculations.
Determining Icing Conditions.
Airspeed and Altitude Correction,
for Obtaining True Calculations
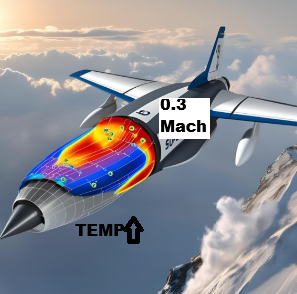
Ram Rise
increase Temperature due to
Compressibility.
Negligible Until: 0.3 Mach speed
Static Air Temprature (SAT) (or) Outside Air Temprature (OAT)
temperature of
Free moving, Undisturbed Air Around an aircraft
corrected for Instrument & Compressibility Errors
Total Air Temprature (TAT)
“SAT”+ 100% of Ram Rise
Determines N1/EPR limits
obtained by TAT Probes
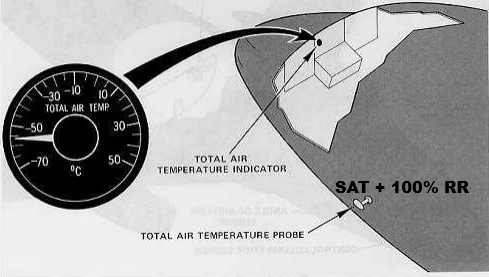
Ram Air Temperature (RAT)
SAT + Specific % of Ram Rise.
Altitude
Elevation with respect to an assumed reference level
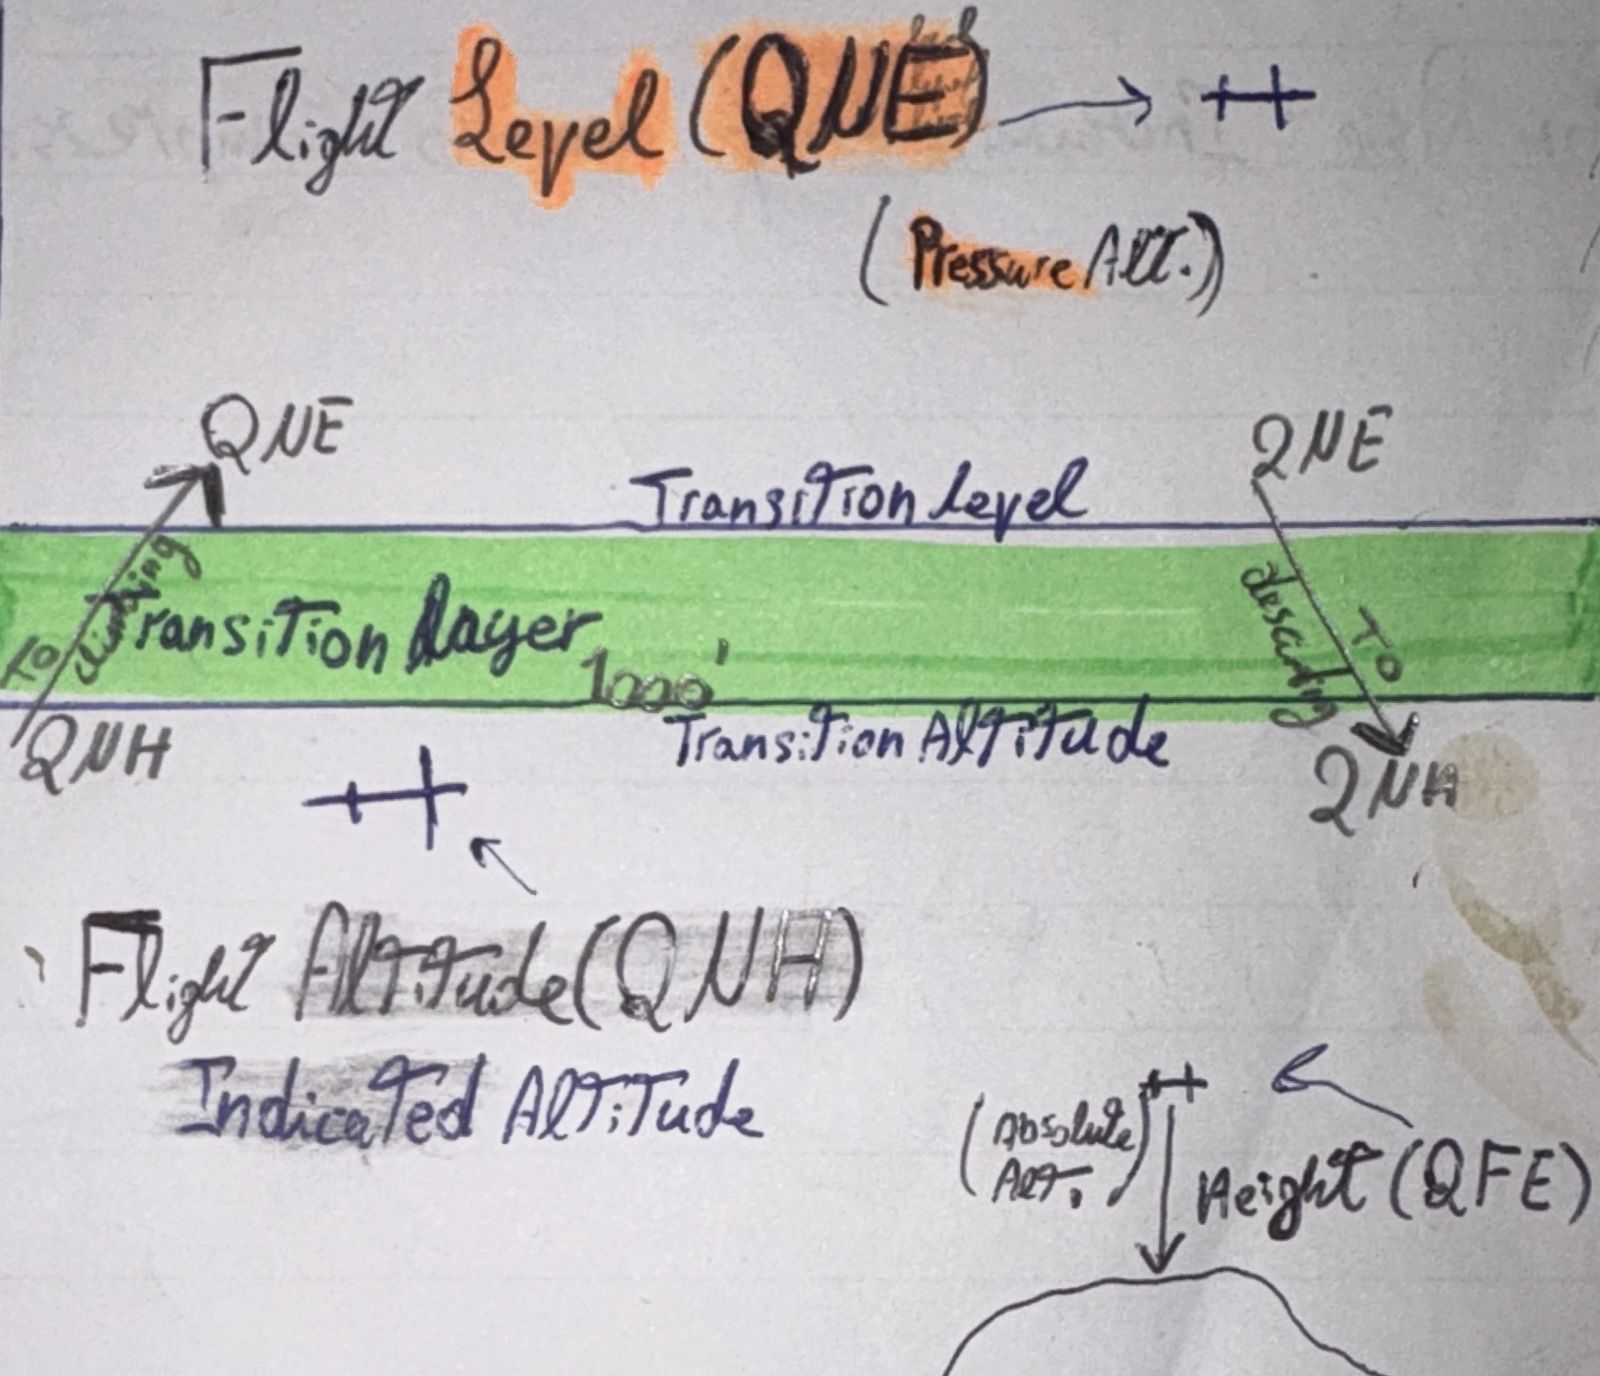
Barometric Altitude
reduction in air pressure with an increase in altitude
QFE (Height)
Altimeter setting that indicates height Above Ground Level (AGL)

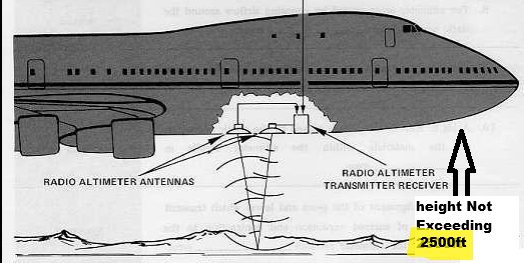
Absolute Altitude
Height Above Terrain
Measured by RA
not exceeding 2500 feet
QNH ‘Local Altimeter Settings’
Altimeter setting used Below Transition Layer
when aircraft's fly with reference to
Mean Sea Level, Giving Indicated Altitude
Indicating Elevation, Provided by ATC

Indecated Altitude
Altitude on the altimeter when set to QNH
indicates the aircraft height above MSL

Transition Altitude
Highest available to use below the transition layer.
where transition from QNH To QNE
if Climbing should begin

Transition Layer
1000ft layer between
transition altitude & level
ensuring Vertical Separation of aircraft
Operating on Different Altimeter Settings

Transition Level
Lowest available for use Above the transition Layer.
where transition from QNE to QNH
if Descending should begin

QNE
Altimeter setting used Above Transition Layer
when aircraft fly with reference to Flight Level
@ Standard Pressure 1013.25Hpa
and “Pressure Altitude”

Pressure Altitude
Altitude on the altimeter when set to QNE
@ISA
which is 1013.25 hectopascals (hPa)
or 29.92 inches of mercury (inHg).
Density Altitude
Pressure altitude corrected for non-standard Temp.
used for (Perf. Calculations)
DA=[Non stndr temp. - 15°c] x120+PA
![<p><strong>Pressure altitude</strong> <strong>corrected </strong>for <strong>non-standard Temp.</strong></p><p><strong>used for (Perf. Calculations)</strong><br>DA=[Non stndr temp. - 15°c] x120+PA</p>](https://knowt-user-attachments.s3.amazonaws.com/e20ddd61-14f9-4449-9dd5-f69b113f118d.jpg)
True Altitude
Actual Height of an object above Sea Level
not indicated by any instruments.
in ISA conditions, MSL = SL, so True Alt.= Indecatied Alt.