Evolution Unit 2
 Call Kai
 Learn
Learn Practice Test
 Spaced Repetition
 Match
Match Flashcards
 Knowt Play
1/42

There's no tags or description
Looks like no tags are added yet.
Name | Mastery | Learn | Test | Matching | Spaced | Call with Kai | Chat |
|---|
No analytics yet
Send a link to your students to track their progress
43 Terms
Darwin’s ideas were novel because …..
They were based on population thinking. Natural selection is an explicitly population-based idea. Variation is an important feature
Population- thinking vs. tree-thinking
Population-thinking: Evolution happens to a population, not an individual. You look at how trait/allele frequencies change over generations
Tree-thinking: Evolutionary relationships are shown as a branching tree. Branches represent population splitting from a common ancestor
What are the four forces of evolution?
Natural selection: traits that improve/reproduction become more common
Genetic drift: random changes in allele frequencies
Mutation: creates new genetic variation
Migration: moving from one place to another
Explain the four criteria required for evolution by natural selection.
Variation in a trait (not all replicators are the same)
Variation in fitness (not all replicators are equally successful)
An association between variation in fitness and variation in trait
Inheritance (replicators pass on traits to the next generation)
Explain the difference between evolution and evolution by natural selection
Evolution: change in allele frequencies in a population over generations
Evolution by natural selection: A specific type of evolution where heritable difference cause some individuals to survive/ reproduce more successfully, making those traits more common
Explain heritability and the reasons why heritability can be hard to measure
Heritability: how much of the variation in a trait within a population is associated with genetic differences.
Why is it hard to measure
Genes and environment both affect traits
Different environments can change how a trait is expressed
Genetic and environmental effects can interact
If differences among individuals are due to differences in the alleles they inherited,
Then the offspring will resemble the parents.
Variation caused by the _____
Environment is a difficult factor to remove when studying the heritability of a trait = the proportion of the variation observed in a population that is due to variation in genes.
Which of the following criteria is necessary for evolution, but not necessary for natural selection?
Phenotype (trait) variation
Evolution change can occur with or without natural selection
Without

answer
Variation in beak depth is largely due to variation in genes
There is no purpose in natural selection and evolution
organisms with the right variations are selected for when there is a match with the environment
•Natural selection is not random (generation of genetic variation is random, but the selection process is not)
•Mutation generates variation (SELECTION DOES NOT GENERATE VARIATION)
•Mutations do not arise because they are needed
Selection will favor the variants that are best fit for the environment
Natural population contain abundant phenotypic variation
genetic variation
environmental variation
genotype X environment variation
How can we measure genetic variation?
Calculating heritability. The fraction of the total variation in a trait that is due to variation in genes = the heritability of the trait
Describe how heritability is calculated, and interpret a parent/offspring regression
Heritability (h²) tells us how much of the variation in a trait is due to genetic differences in a population.
It is found from the slope of the parent-offspring regression.
Steeper slope = higher heritability.
Slope close to 0 = low heritability.
Example: h² = 0.8 means 80% of the variation in that population is associated with genetic differences.
Interpret graphs showing the effect of dominance on the relationship between parents and offspring.
Easy rule:
Additive = predictable from parents
Dominance = less predictable
Dominance can make the relationship between parents and offspring less direct.
Additive effects: parental traits predict offspring traits well → stronger linear relationship.
Dominance: one allele masks another → offspring may not fall exactly where you would predict from the parents.
This can make the parent-offspring regression slope smaller, affecting the estimate of heritability.
Explain the difference between and the uses of the selection differential and selection gradient
Selection differential: Measures the difference between the average trait of selected individuals and the original population average
Selection gradient: Measures how strongly a particular trait affects fitness while accounting for other traits
Explain how the work on the Alpine skypilot and Darwin’s finches used the breeder’s equation to predict evolutionary change.
Easy rule:
Heritable trait + selection = predictable evolutionary change
Alpine skypilot: Researchers measured the relationship between plant traits, selection, and heritability to predict how the population could change.
Darwin's finches: During drought, birds with certain beak sizes survived better. Researchers used the selection differential and heritability to predict the change in average beak size in the next generation.
Stabilizing selection
Favors the middle/intermediate trait.
Selects against both extremes.
The population becomes more concentrated around the middle.
Example: goldenrod gall size → medium-sized galls have higher fitness than very small or very large galls.
Directional selection
Favors one extreme of the trait.
The population's average shifts toward that extreme.
Example: larger beaks being favored → average beak size increases.
Disruptive selection
Favors both extremes.
Selects against the middle.
The population becomes more divided between the two extremes.
Heritability
The proportion of phenotypic variation resulting from underlying genetic variation
h2= VG/VP
Timberline populations
smaller flowers, pollinated by many insects
Tundra populations
larger flowers, pollinated only by bumble bees.
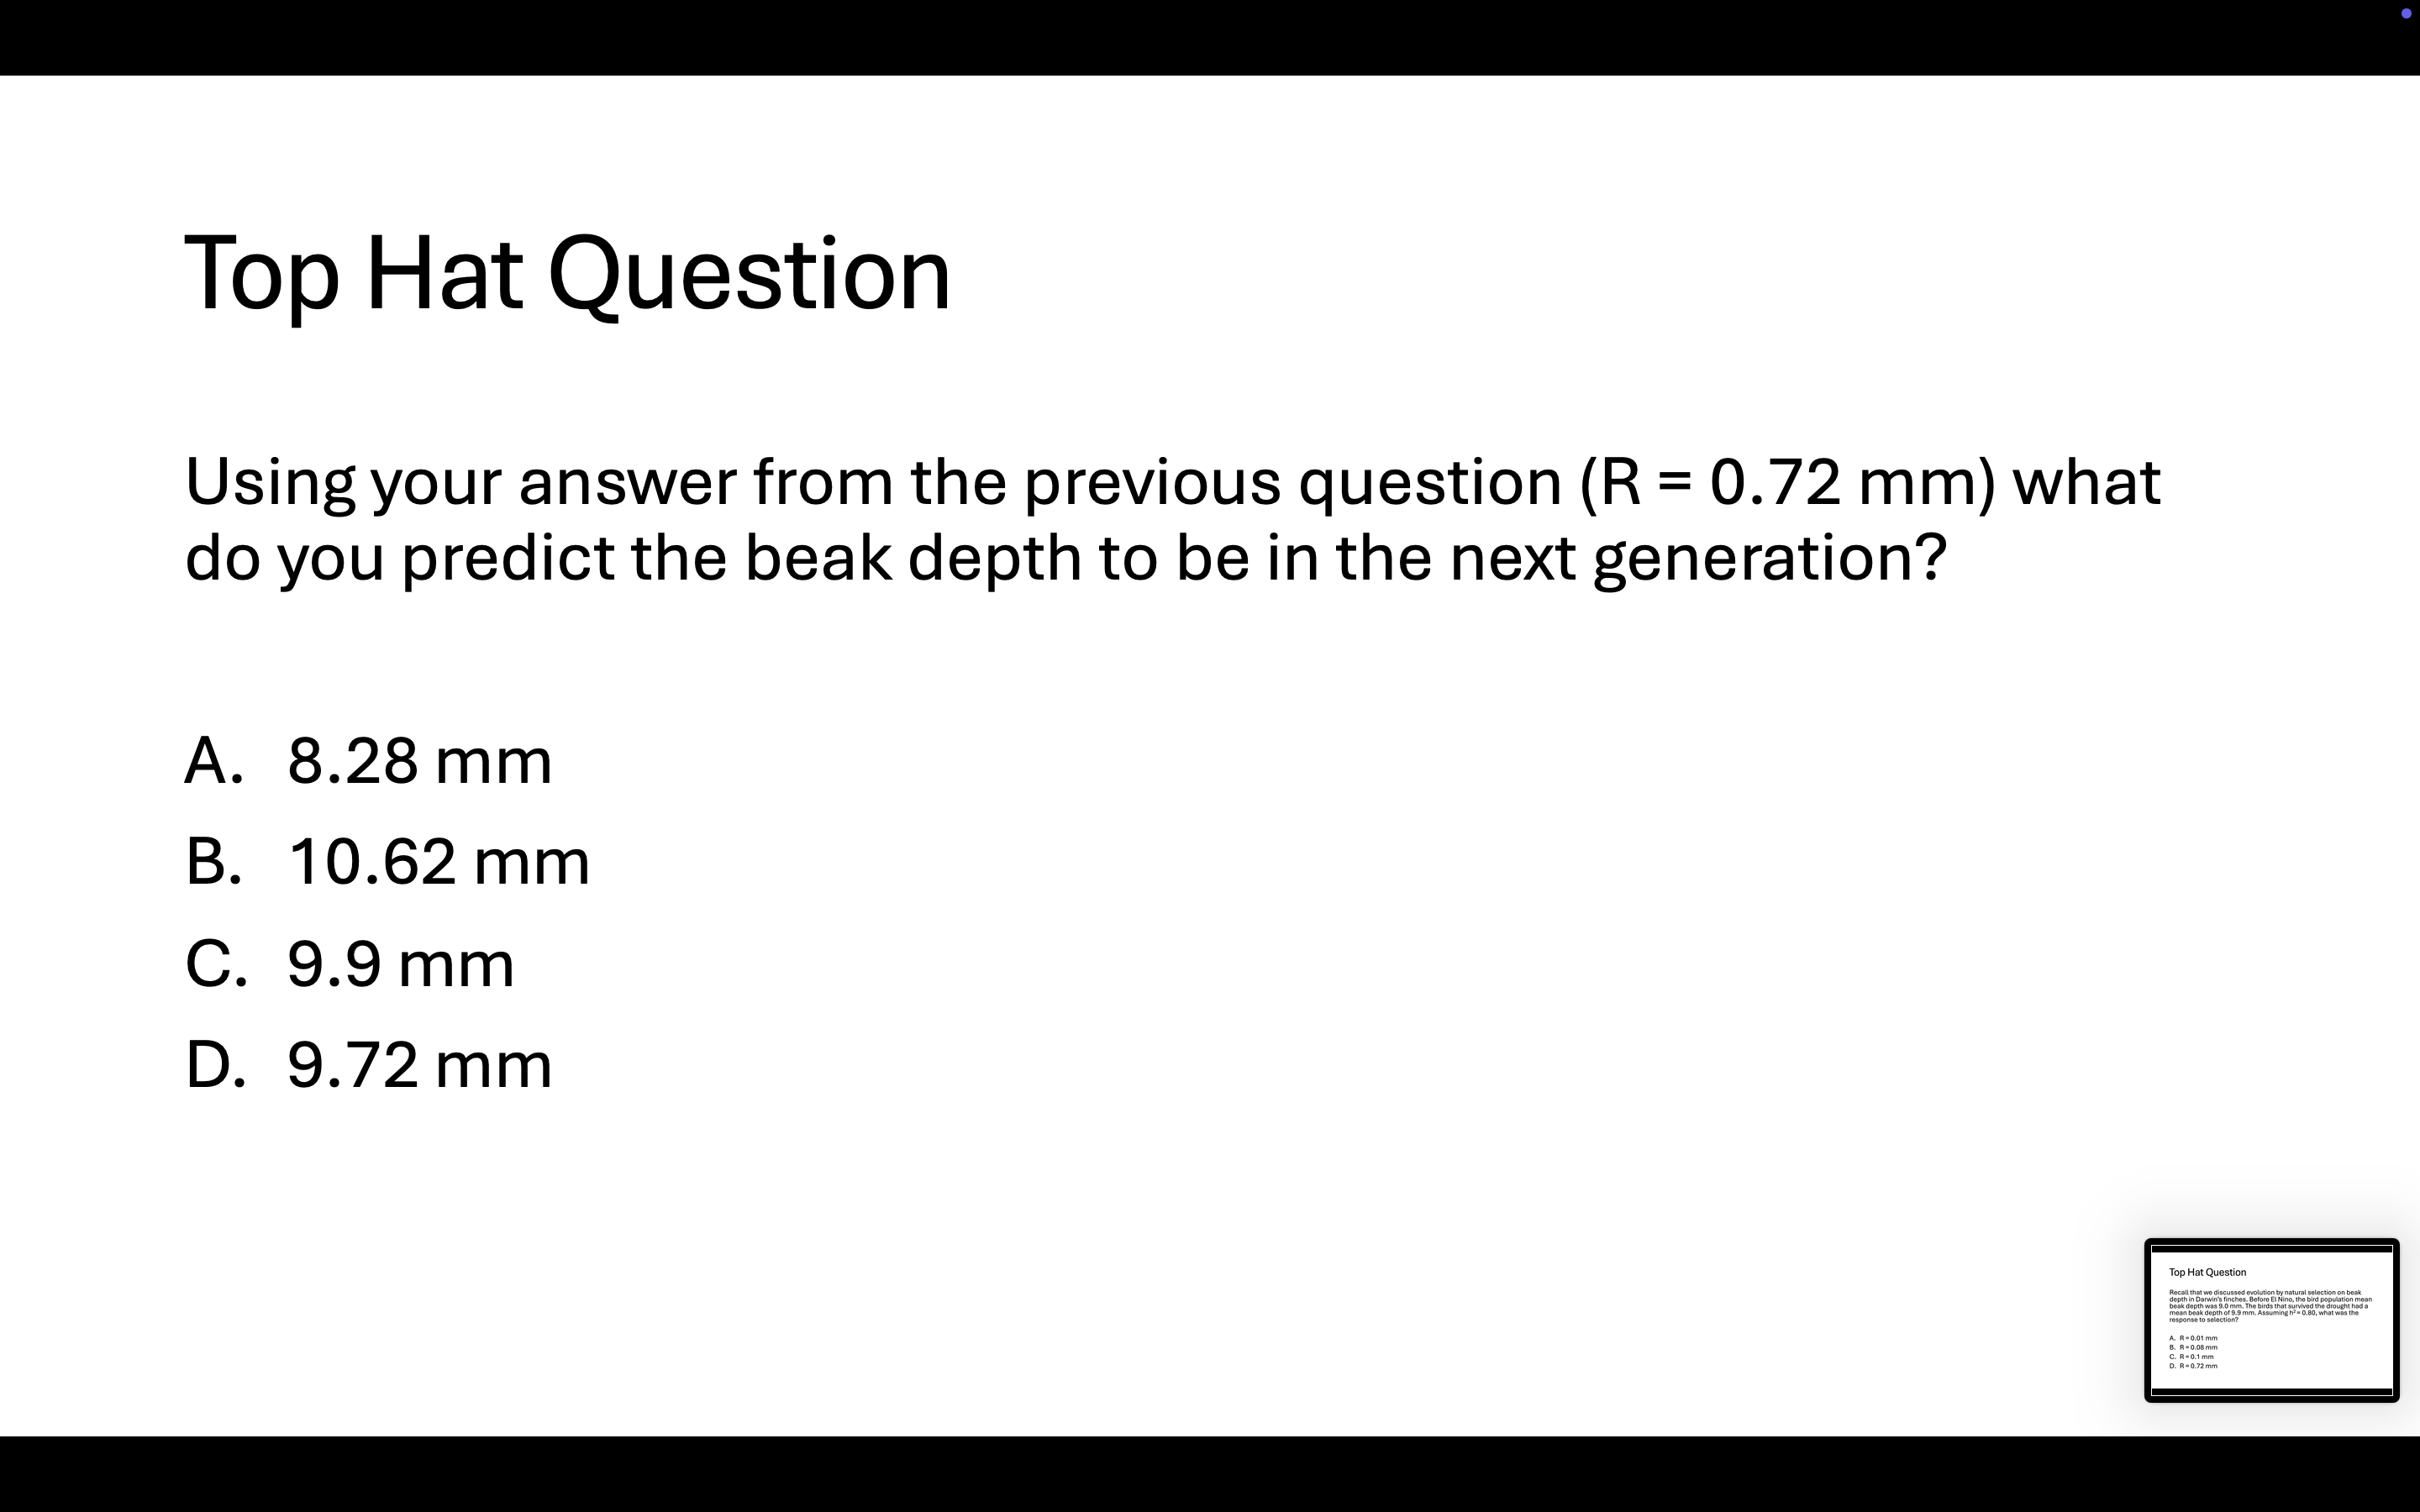
Next generation = original mean + response to selection
Hint = 9.0 mm + 0.72 = ????
9.72 mm
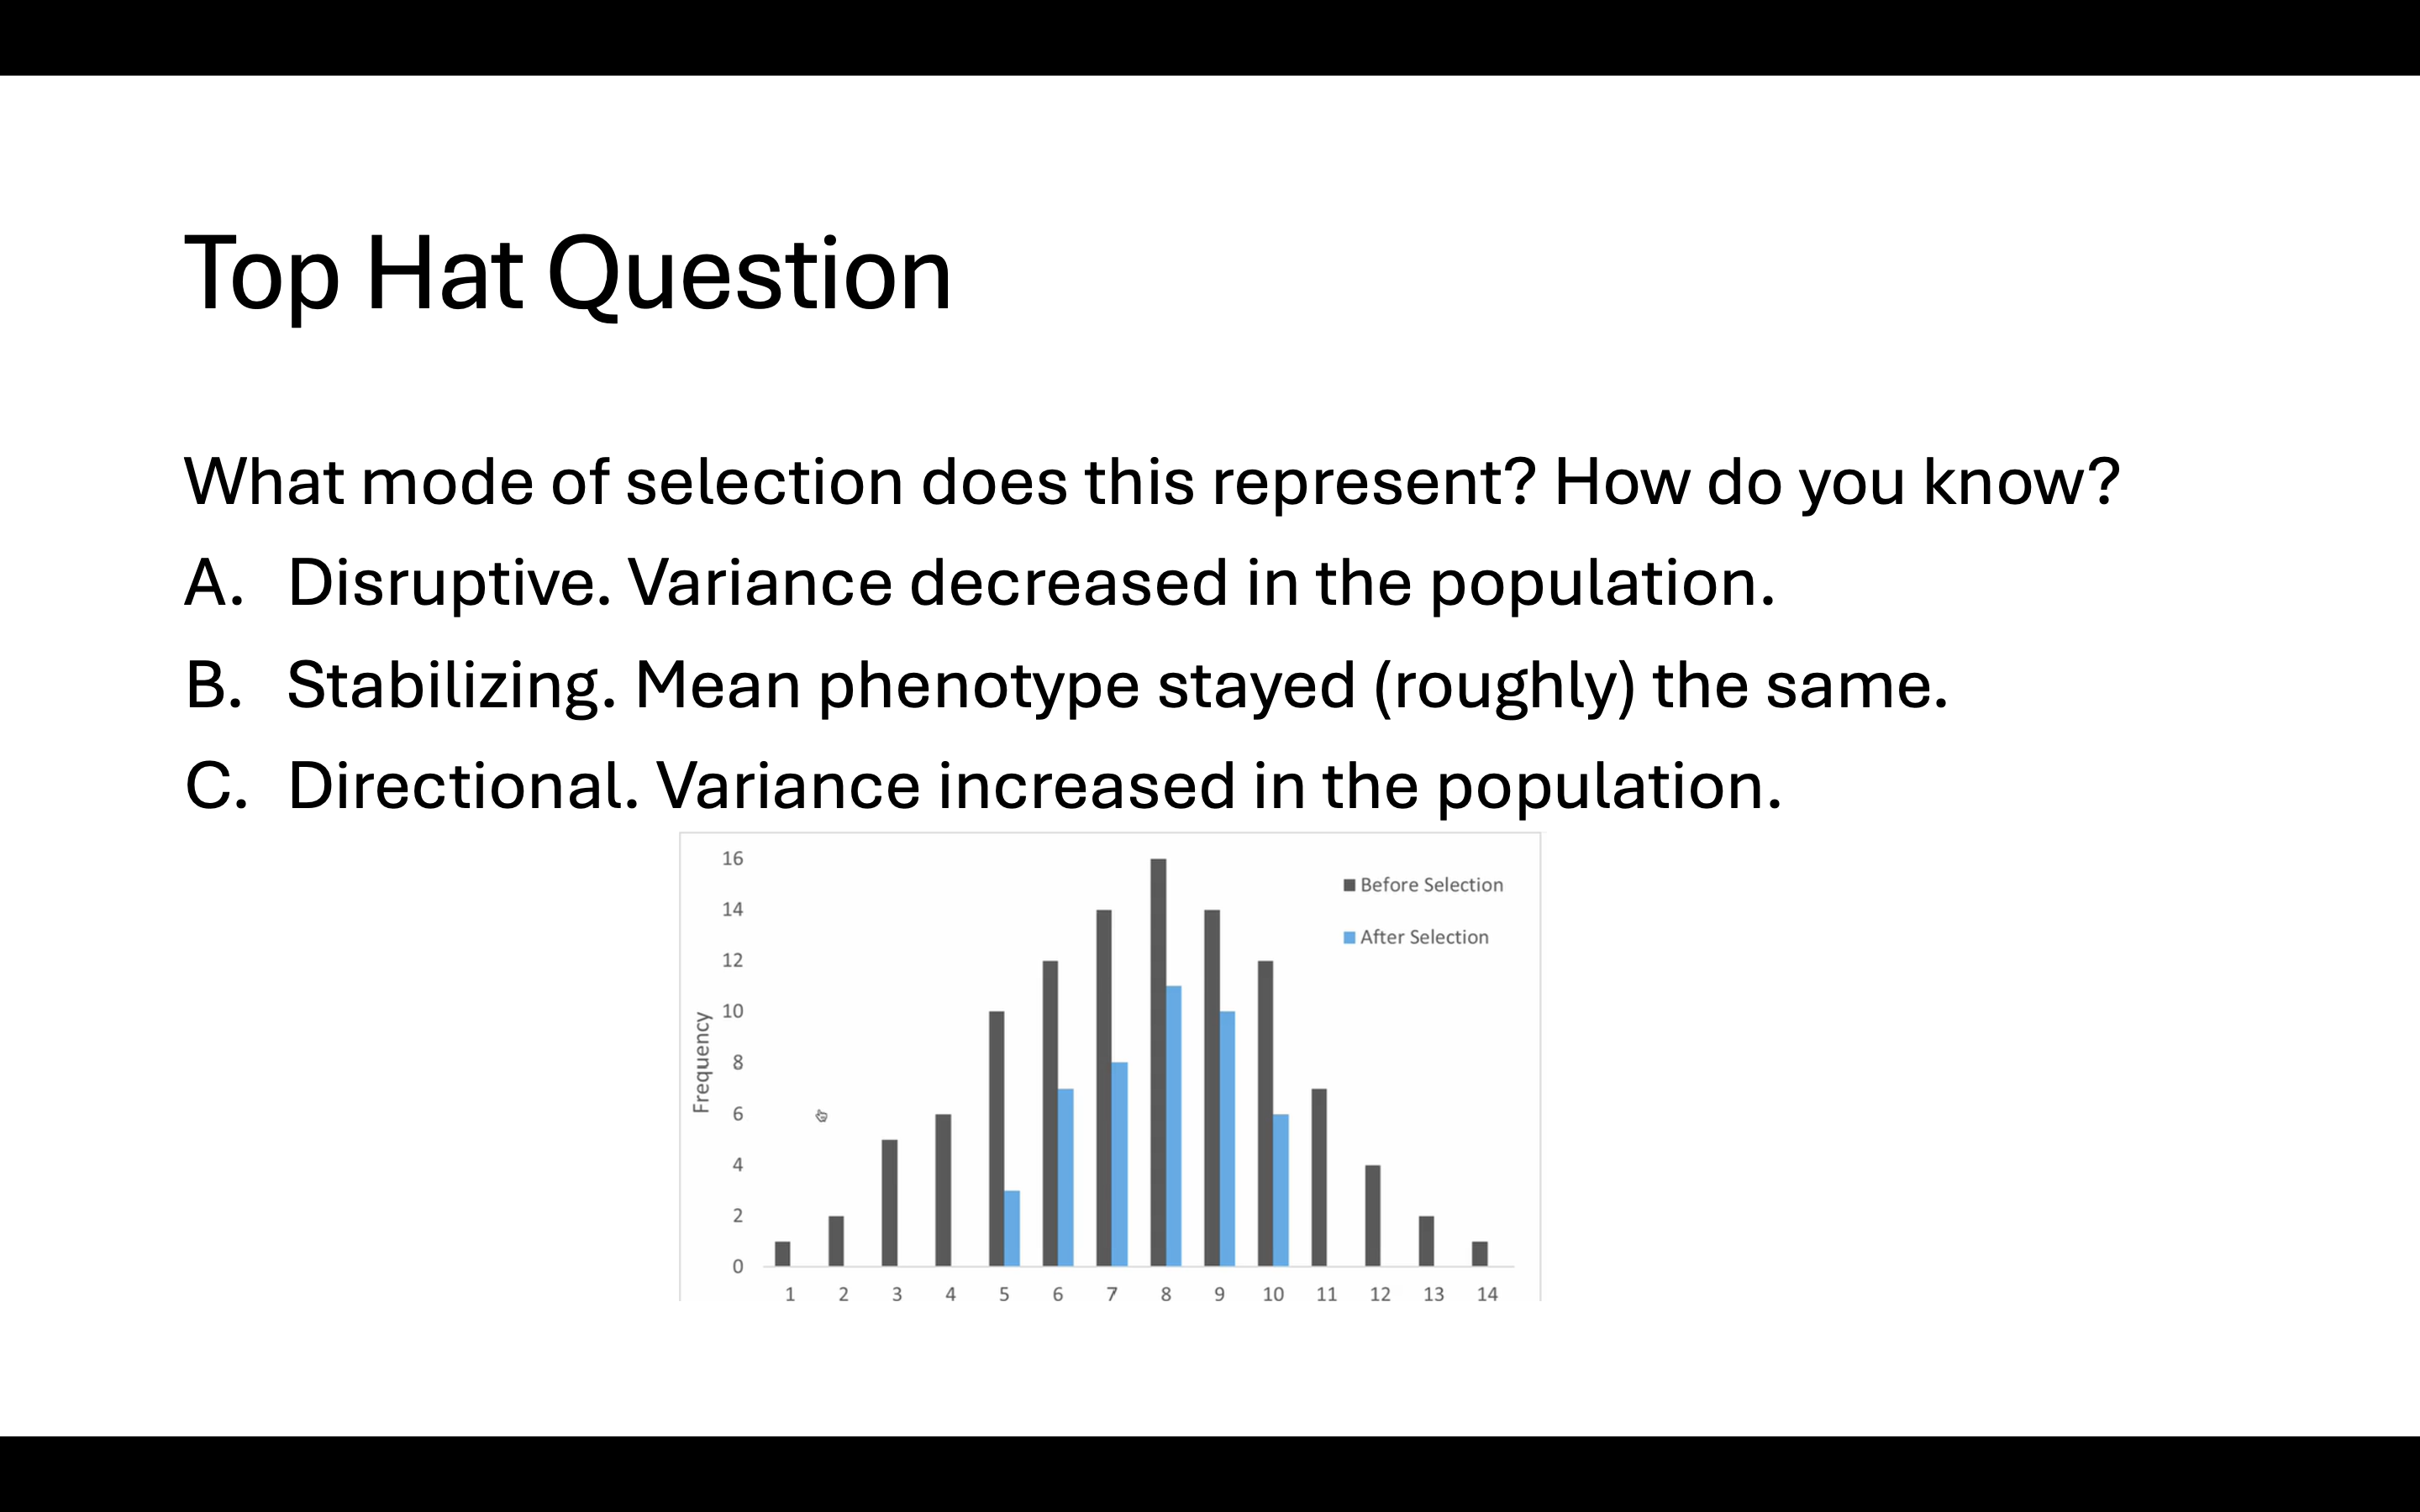
Stabilizing = middle is favored → extremes decrease.
Stabilizing. Mean phenotype stayed (roughly) the same.

S=70−60=10
R=67−60=7
h2=SR=107=?????
0.7
Inheritance
An individual-level trait. Traits are encoded by genes and passed down from a parents to offspring
Heritability
A population-level trait. The proportion of phenotypic variation (in a population) that is attributed to underlying genetic variation (in the population)

Hint: S = 9.9 - 9.0 = 0.9
R = 0.80(0.9) = ????
R = 0.72
A population of tree frogs is infected by a deadly virus that recognizes a cell-surface receptor encoded by the gene flm. The allele flm32 is susceptible to viral attachment. In this population, the flm gene is not polymorphic. How might this population adapt in response to this virus?
Mutation can introduce new alleles with reduced susceptibility, providing important variation for natural selection to act on.
Polymorphic
An evolutionary process where multiple distinct genetic forms, traits, or alleles coexist within a single population of a species
Natural selection is the only ________
evolutionary force that can result in adaptation
Adapation
a phenotypic trait that has evolved, allowing an organism to respond to a stressor in its environment
Mutatio, gene flow (or migration), and genetic drift can do what?
Constrain or facilitate adaption, but they cannot cause adapation
If new alleles may not appear in the population, then ……
Mutation and gene will not occur because the population “needs” it
Population genetics
The study of genetic variation within and among populations
Measuring genetic variation in natural populations: First step
Determine genotypes for a large sample of individuals in the population —→ look directly at the DNA
To determine the genotypes of each individual, we can extract DNA from cells, amplify the gene of interest (CCR5) using polymerase chain reaction (PCR), and determine genotypes using approaches like sequencing or gel electrophoresis.
Measuring genetic variation in natural populations: Second step
Calculate allele frequencies —→ using the genotype frequencies
The null model assumes that populations are _____
Not evolving; instead, they are in equilibrium. In population genetics, we refer to this as Hardy-Weinberg equilibrium
When a population is in HWE, we can make two conclusions
Allele frequencies in a population will not change from generation after generation
Given the allele frequencies in a population, we can calculate genotype frequencies. Genotype frequenices will be given by, p2 2pq + q2 = 1
Hardy- Weinberg Assumption
No selection (all genotypes have equal fitness)
No mutation
No gene flow (migration)
Large population size (no drift) or change events
Random mating (individuals with same genotype aren’t more likely to mate with one another)