Stats: Basic rules, definitions, principles and skills
1/51
There's no tags or description
Looks like no tags are added yet.
Name | Mastery | Learn | Test | Matching | Spaced | Call with Kai |
|---|
No analytics yet
Send a link to your students to track their progress
52 Terms
Explain the following formula
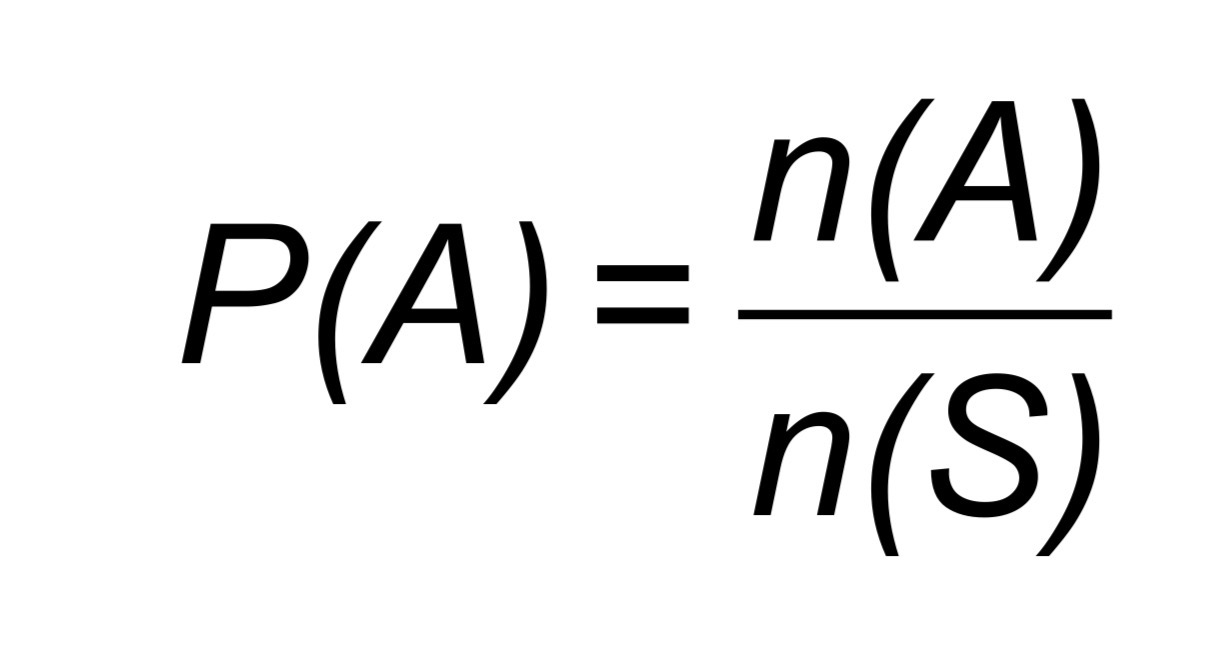
Basic probability.
P(A) = probability of event A
n(A) = number of outcomes in event A
n(S) = number of outcomes in the sample space (total possible outcomes)
Explain the following formula
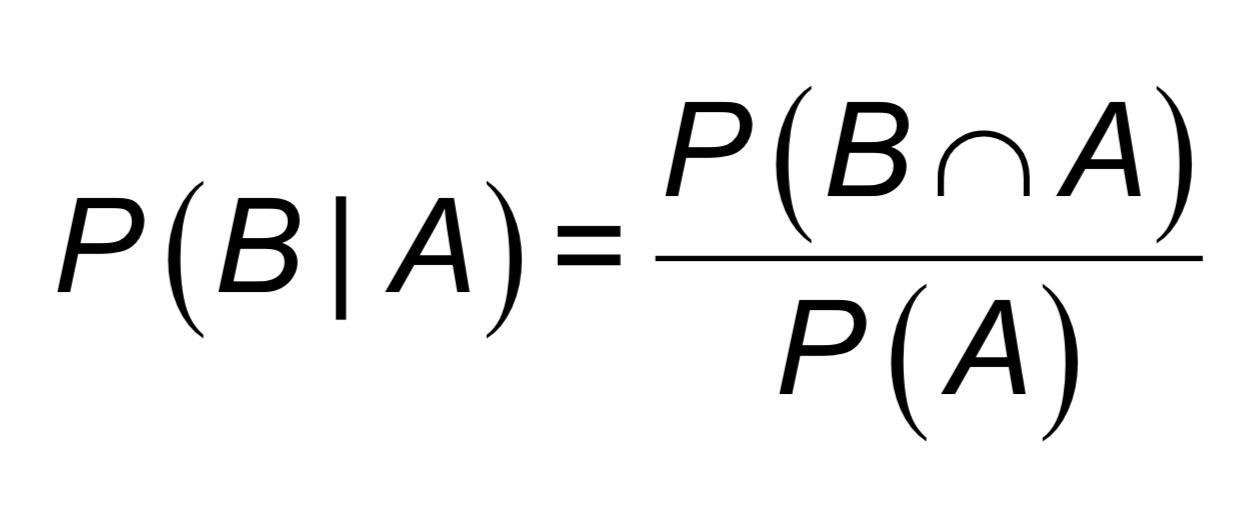
Conditional probability (probability of B given A has happened).
P(B|A) = probability of B occurring given A has occurred
P(B∩A) = probability of both A and B occurring
P(A) = probability of A occurring
Explain the following formula
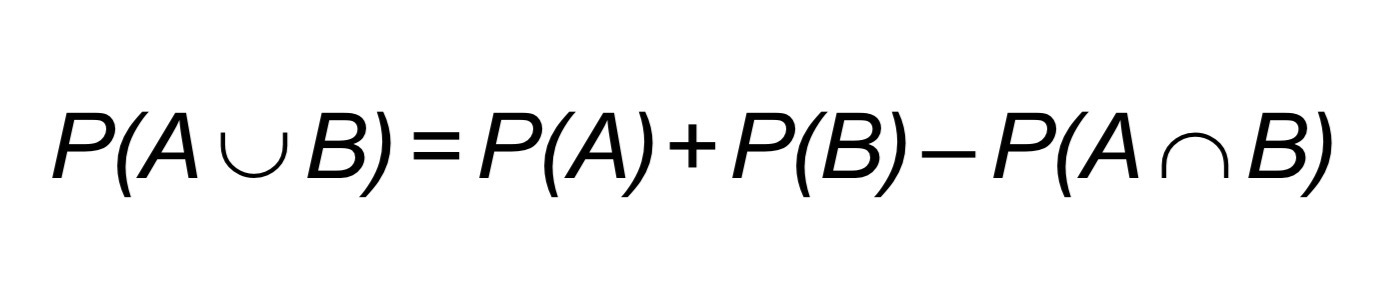
Probability of A or B (union).
P(A∪B) = probability A or B (or both) occurs
P(A∩B) = probability both A and B occur (subtracted so you don't double-count the overlap)
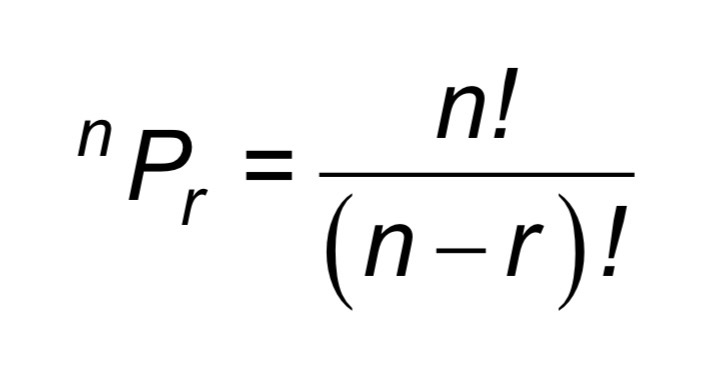
Explain the following formula
Permutations (order matters).
n = total number of items
r = number of items being arranged/chosen
n! = n factorial (n×(n-1)×(n-2)×...×1)
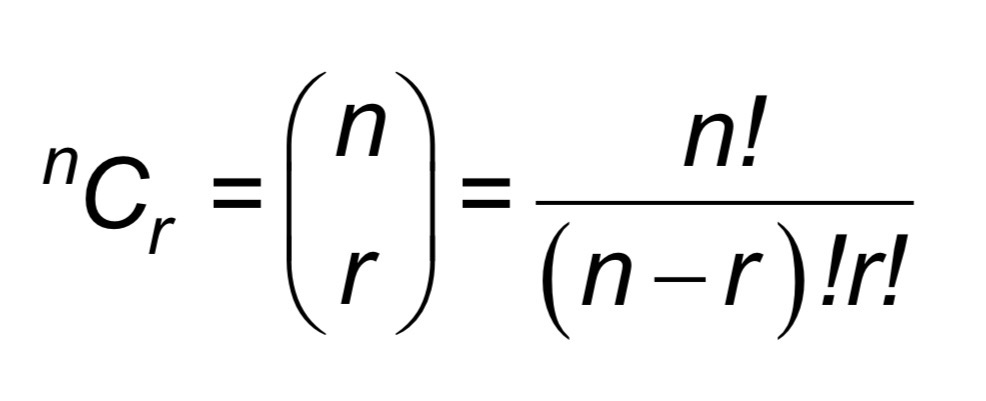
Explain the following formula
Combinations (order doesn't matter).
n = total number of items
r = number of items being chosen
Same n! logic as above, just divided by r! extra to remove order
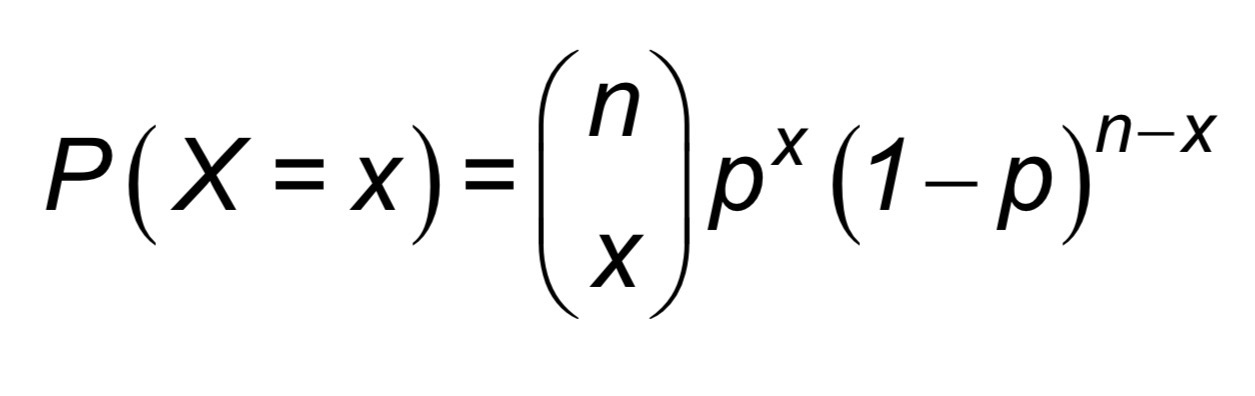
Explain the following formula
Binomial probability.
X = the random variable (number of successes)
x = a specific number of successes you're solving for
n = number of trials
p = probability of success on a single trial
(1-p) = probability of failure on a single trial
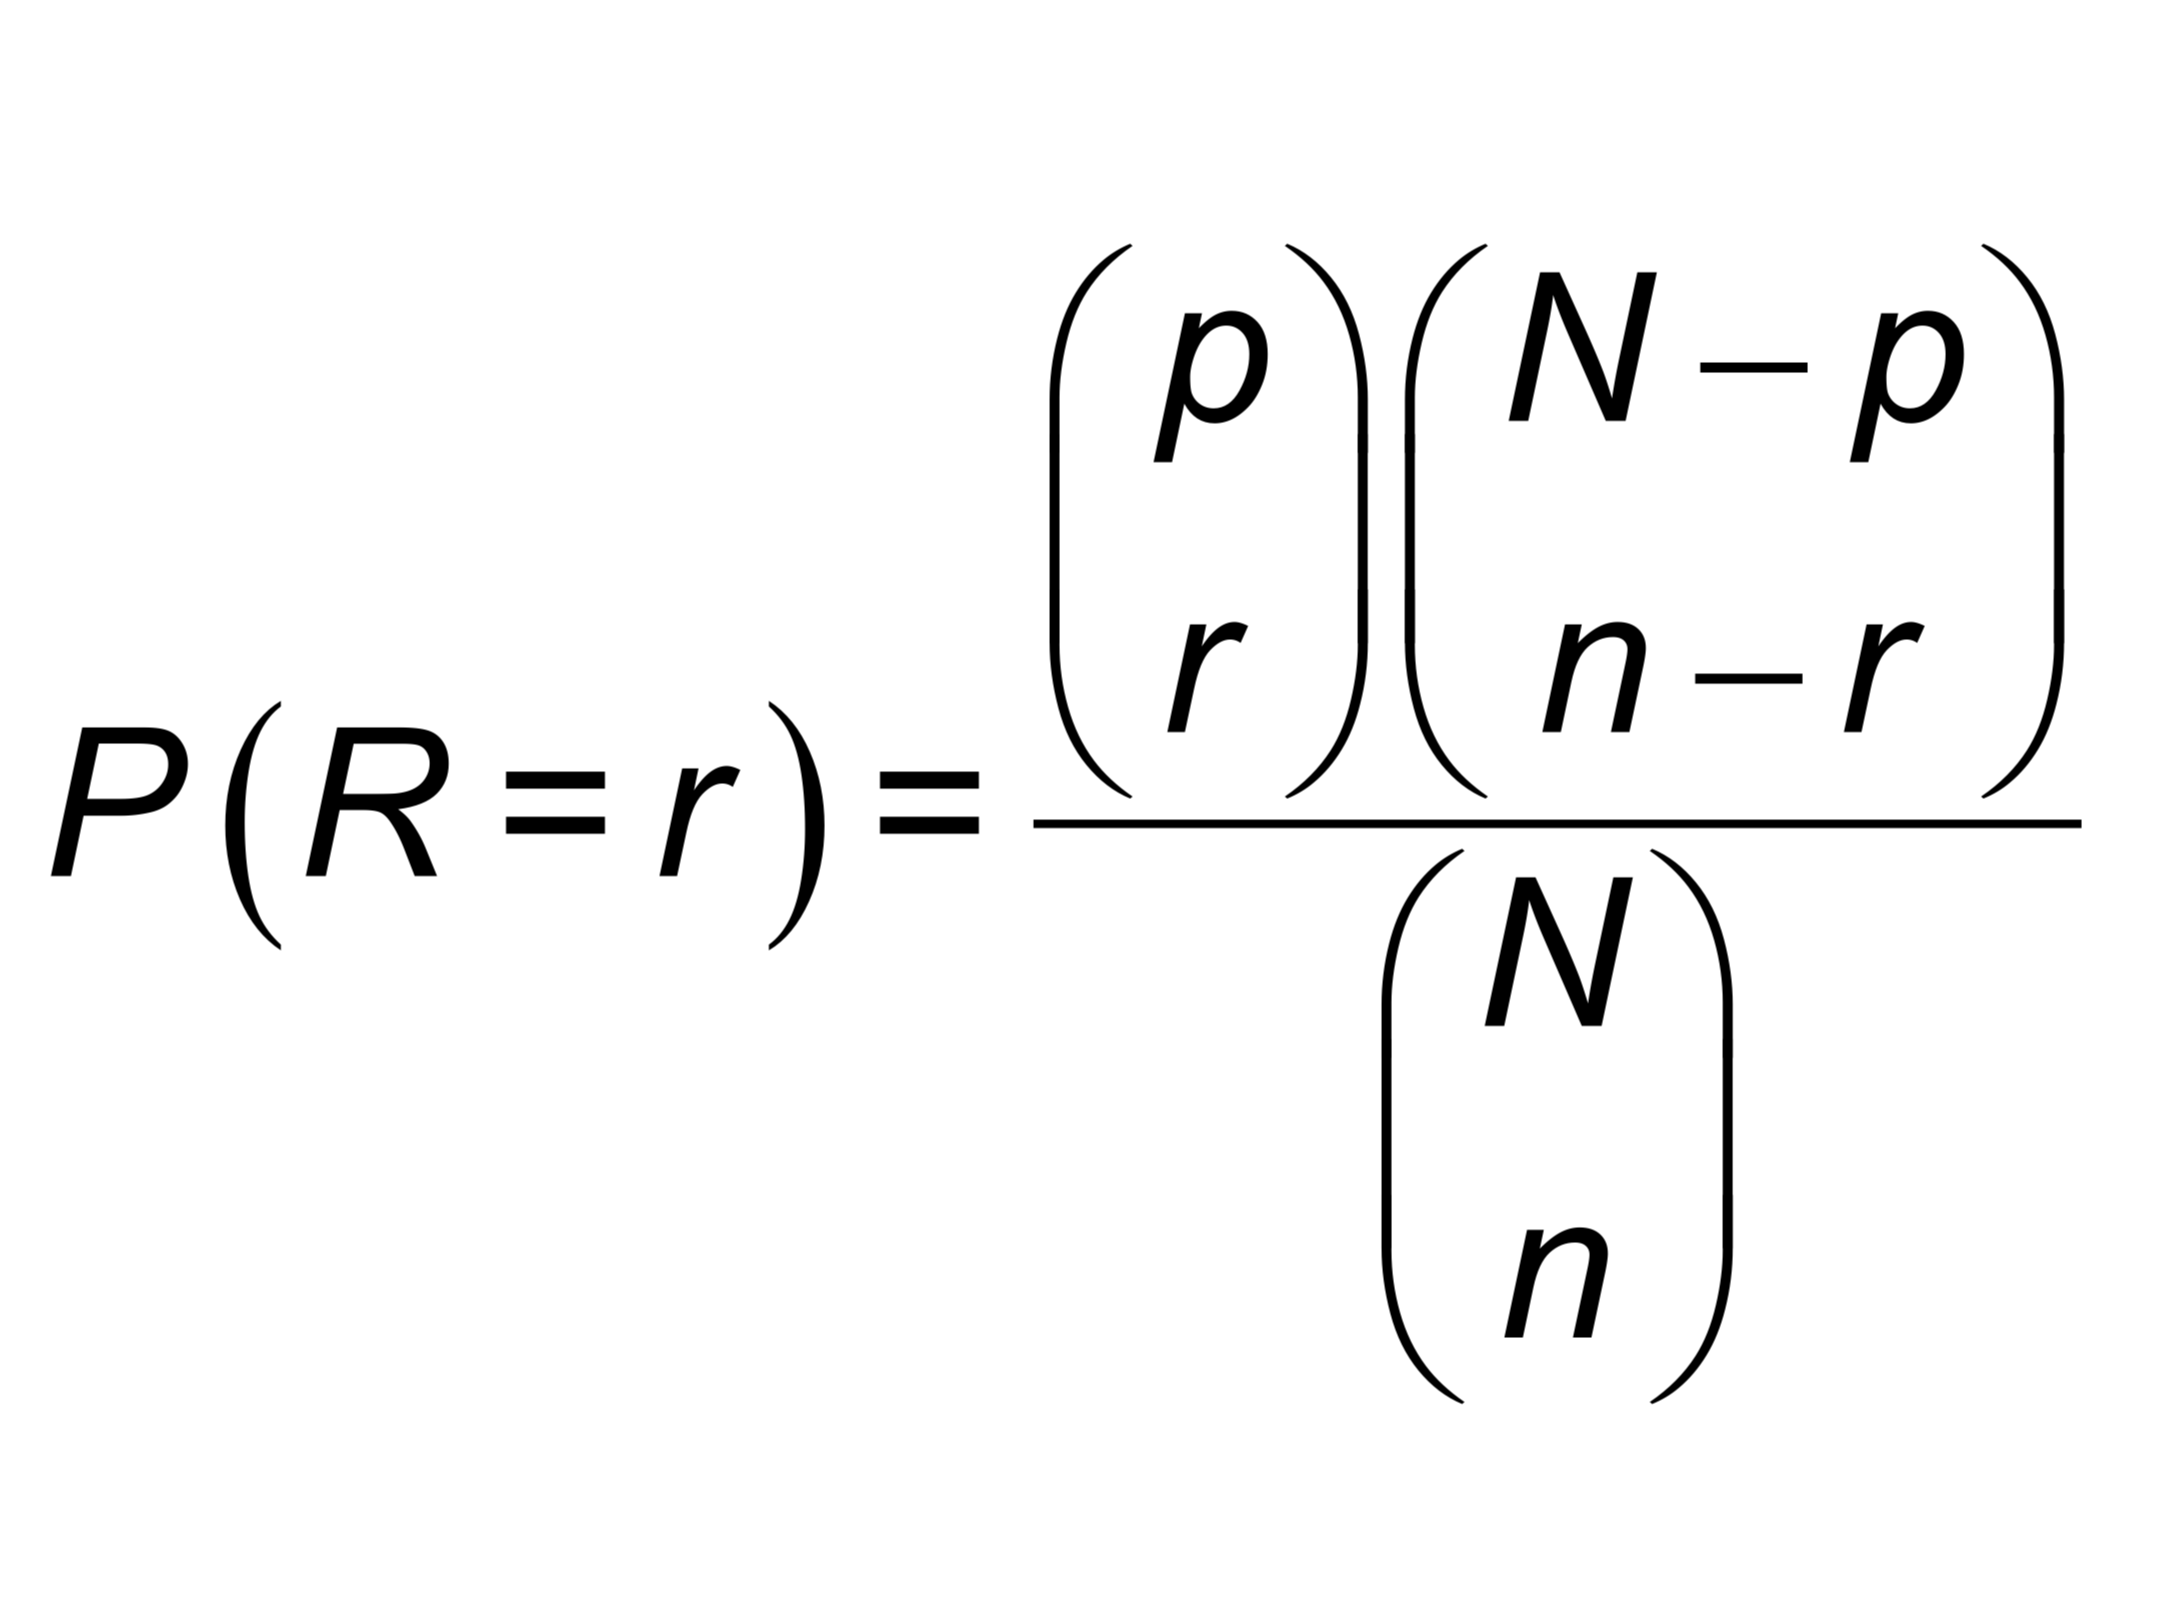
Explain the following formula
Hypergeometric probability.
R = random variable (number of "successes" drawn)
r = specific number of successes you want
N = total population size
p = number of "successes" in the entire population (careful: this p is a count, not a proportion like in binomial)
n = sample size drawn
Explain the following formula
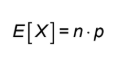
Mean (expected value) of a binomial distribution.
E[X] = expected value/mean
n = number of trials, p = probability of success
Explain the following formula
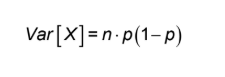
Variance of a binomial distribution.
Var[X] = variance
Same n, p, (1-p) as above
Explain the following formula
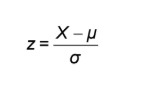
Standardizing a single value (z-score).
X = the individual data value
μ = population mean
σ = population standard deviation
Explain the following formula
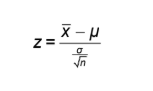
Standardizing a sample mean.
x̄ = sample mean
μ = population mean
σ/√n = standard error of the mean (n = sample size)
Explain the following formula
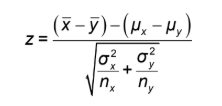
Comparing two sample means.
x̄, ȳ = sample means of group x and group y
μx, μy = population means of group x and group y
σx², σy² = population variances of each group
nx, ny = sample sizes of each group
Explain the following formula
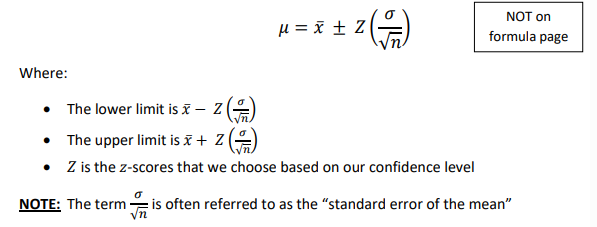
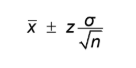
Confidence interval for a mean.
x̄ = sample mean
z = z-score for your confidence level
σ = std dev, n = sample size
Explain the following formula
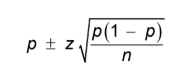
Confidence interval for a proportion.
p = sample proportion
z = z-score for confidence level
n = sample size
Explain the following formula
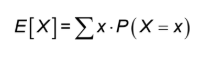
Expected value, general formula.
x = each possible outcome
P(X=x) = probability of that outcome
Explain the following formula
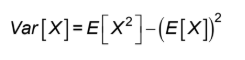
Variance, general formula.
E[X²] = expected value of X squared (Σx²·P(X=x))
(E[X])² = square of the mean (formula 15, squared)
When is an event mutually exclusive? (Not on formula sheet)

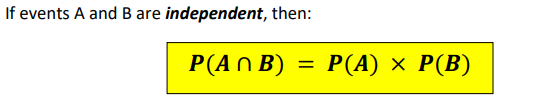
When is an event considered to be independent? (Not on formula sheet)
Confidence interval formula (Not on formula sheet)