unit 0: research method and data interpretation
1/53
There's no tags or description
Looks like no tags are added yet.
Name | Mastery | Learn | Test | Matching | Spaced | Call with Kai |
|---|
No analytics yet
Send a link to your students to track their progress
54 Terms
psychology
science of behavior and mental process; uses research and interpretation of resulting data, evidence, and analysis
3 key elements of scientific attitude
curiosity
skepticism
humility (humble)
critical thinking
examines assumption, appraises the source, and discern hidden biases
hindsight bias
known as i-knew-it-all-along phenomenon; ex) after getting a question wrong and the answer is revealed, you go “oh i knew that”
overconfidence
the tendency to be more confident than correct
peer reviewers
scientist who are experts, evaluate a study’s theory, originality, and accuracy.
hypothesis
a testable prediction; a good theory produces testable prediction
falsifiability (of hypothesis)
marks the scientific stregnth; can it be proven false?
operational definition (of research)
the procedures and concepts
replicate
(repeat) the original observations with different participants, materials, and circumstances; if they get similar results, confidence in the finding’s reliability grows.
case studies
in-depth analyses of individuals or groups; surveys
naturalistic observation
recording the natural behavior of many individuals, and surveys and interviews asking people questions
social-desirability bias
people answering in a way they think will please the researcher
self-report bias
when people don’t accurately report or remember their behaviors
convenience sampling
collecting research from a group that is readily available, such as your friends at school, rather than a sample that would represent all the students at your school
representative sample
a subset of a population that accurately reflects the characteristics of the larger group it is drawn from; this is crucial for ensuring that research findings can be generalized to the entire population and are not affected by sampling bias. methods like random sampling used to create a representative sample.
random sample
selecting randomly
population
the complete set of cases from which samples may be drawn
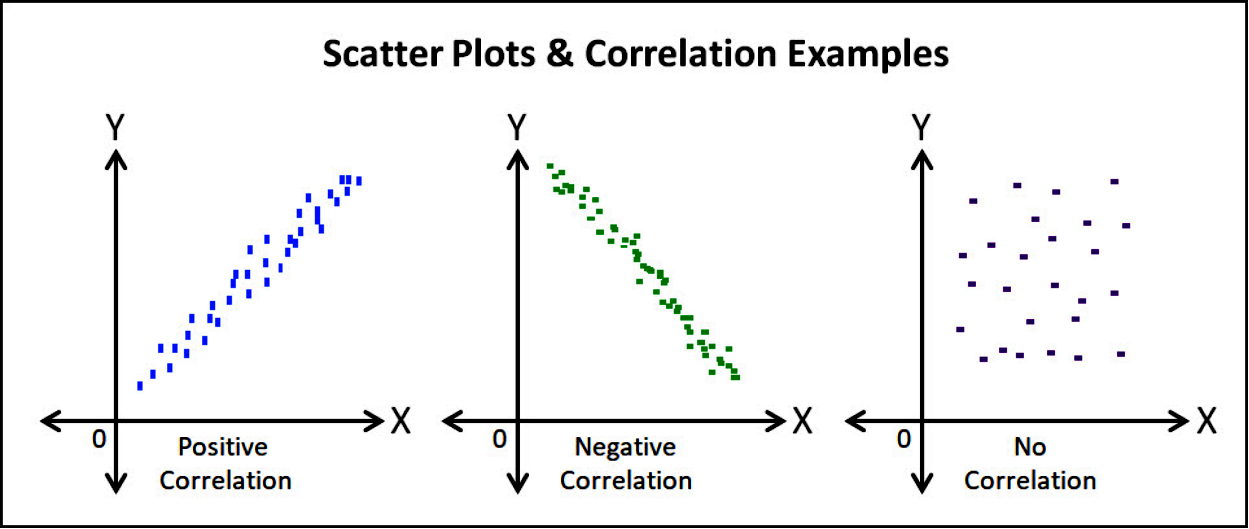
correlation
describes the relationship between two or more variable; correlation does not prove causation, experiment does
correlation coeffecient
statistical measure describing the direction and strength of two variables’ relationship
scatter plots
positive (r = +#)
no relationship (r = 0.00)
negative (r = #)
perfect (r - 1.00)
illusory correlation
the illusion of a relationship; superstition
regression toward the mean
the illusion that uncontrollable events correlate with our actions is also fed by a statistical phenomenon
experiment
a research method used to establish a cause-and-effect relationship between variables; experiments prove correlation
experimental group
the group receiving the treatment; will not know which group they are
control group
the group that doesn’t receive the treatment; constant; will not know which group they are
random assignment
a research method where participants are randomly placed into different experimental groups (like the control and experimental groups) to ensure each person has an equal chance of being in any group ; note the difference between random sampling, which creates a representative survey sample, and random assignment, which equalizes the experimental and control groups
placebo
a pseudotreatment; causing the placebo effect
placebo effect
just thinking you are getting a treatment can boost your spirits, relax your body, and relieve your symptoms
single-blind procedure
the participants are often blind (uninformed) about what treatment, if any, they are receiving
double-blind procedure
neither the participants nor those who administer the drug and collect the data will know which group is receiving the treatment
independent variable
factor the researcher manipulates or changes
confounding variable or third varaible problem
other factors that can potentially influence a study’s results that cannot be controlled by the researcher
dependent variable
the data measured after the experiment
experimenter bias
when researchers may unintentionally influence results to confirm their own beliefs
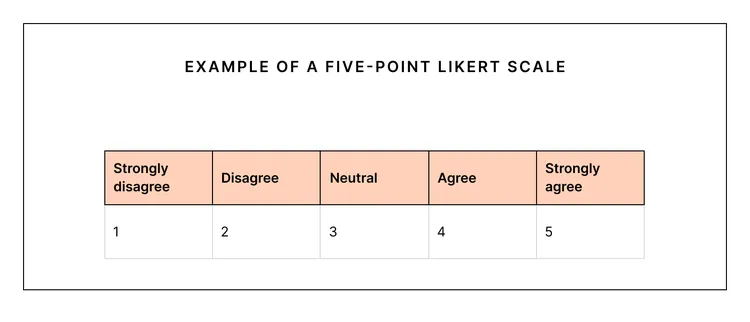
quantitive research
methods use numerical data to represent degrees of a variable, for example using a likert scale
qualitative research
methods rely on in-depth, narrative data; (ex) structured interviews
animal research ethical standards
ethical standards to prevent animal abuse
institutional review board (irb)
looks on ethical side of things; humans and animals
the 4 ethical guidelines for human irb
informed consent for adult and informed assents for minors
protected participant from greater-than-usual harm and discomfort
keep information about individual participants confidential
fully debrief people (explain research afterward, including any temporary deception)
descriptive statistics
measure and describe characteristics of group under study
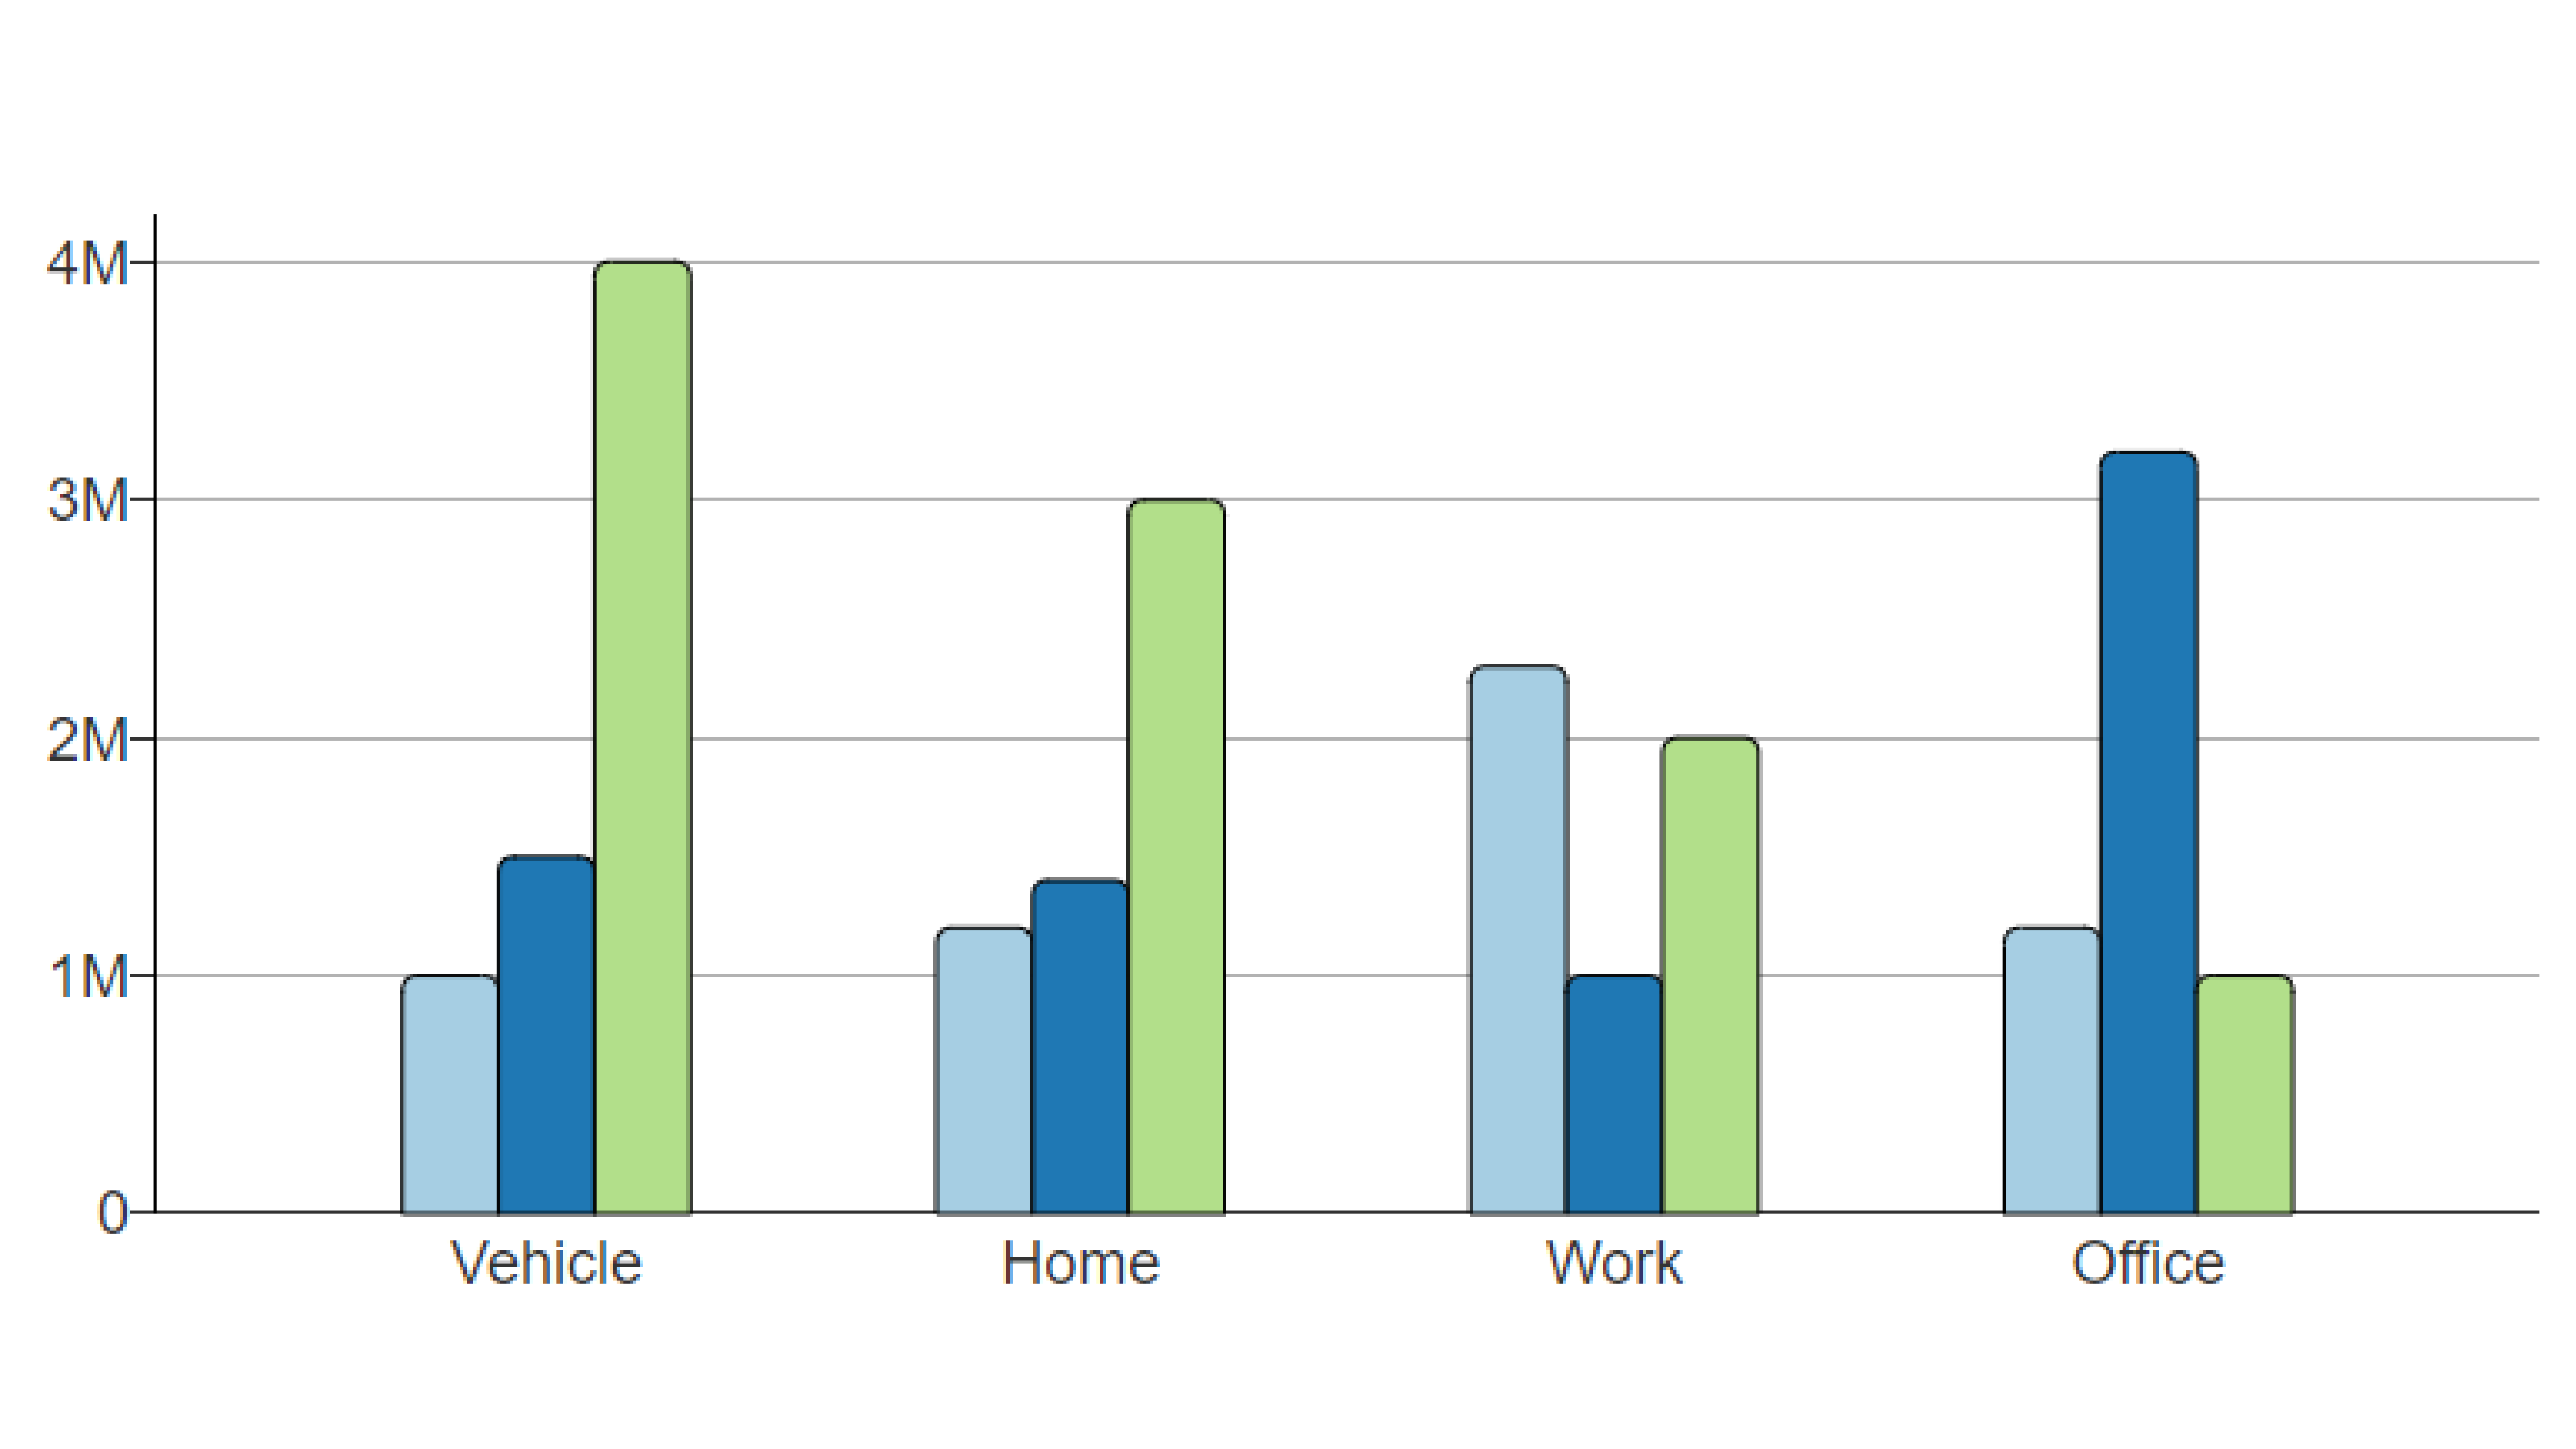
histogram
a bar graph
central tendency
a score that represents a whole set of scores; mean, median, mode
mean
or arithmetic average; the total sum of all the scores divided by the number of scores
median
midpoint of a data distribution (the 50th percentile); if you arrange all the scores in order from the highest to the lowest, half will be above the median and half will be below it
mode
the simplest measure; the most frequently occurring score or scores
percentile rank
the percentage of scores that are less than a given score; so, if you are in the 79th percentile in a math competition in your state, your score is higher than 79 percent of your peers
skewed distribution
a set of scores that is not symmetrical; mean is skewed
variation
how similar or diverse the scores are
range
the gap between the lowest and highest; subtract the highest and lowest to get the range
standard deviation
a more useful standard for measuring how much scores deviate (differ) from one another; average score distance from average score - (ex) 65, 80, 95 = sd →15
normal curve
symmetrical bell-shaped distribution
statistically significant
how reliable and significant results are; determines if result is generalized to a large population
sample size
how many is in your experiment or is surveyed