Week 4: Quantitative Methods I
1/38
There's no tags or description
Looks like no tags are added yet.
Name | Mastery | Learn | Test | Matching | Spaced | Call with Kai |
|---|
No analytics yet
Send a link to your students to track their progress
39 Terms
In the context of statistics, what is a sample?
is a smaller group that has been drawn from the population
the existence of stats is related to the existence of samples
informs us of the population — generalisation
In the context of statistics, what is a population?
is to use a sample to understand something about the population it is drawn from
we have access to samples but not exactly populations
What is sampling with replacement?
once a member of the population has been sampled they can be sampled again
What is sampling without replacement?
once a member of the population has been sampled they cannot be sampled again
What are some non-random sampling methods?
convenience sampling
snowball sampling
stratified sampling
What is convenience sampling?
where units are selected for inclusion in the sample because they are the easiest for the researcher to access
adverts 4 participation
What is snowball sampling?
one participant provides contact details for another participant
useful for recruiting hard-to-reach/hidden populations
advantage — allows for sampling from populations that might otherwise be unreachable
disadvantage — resulting sample is highly non-random
What is stratified sampling?
deliberately sampling more from sub-populations — strata
people with schizophrenia and people who don’t have schizophrenia
sampling equal numbers from each group — we have oversampled people w/ schizophrenia relative to the general population
resulting sample is non-random — but may be well suited for asking other research questions
what is meant by a probability distribution?
a mathematical function that describes the probability of different possible values of a variable—how surprised should we be of the results?
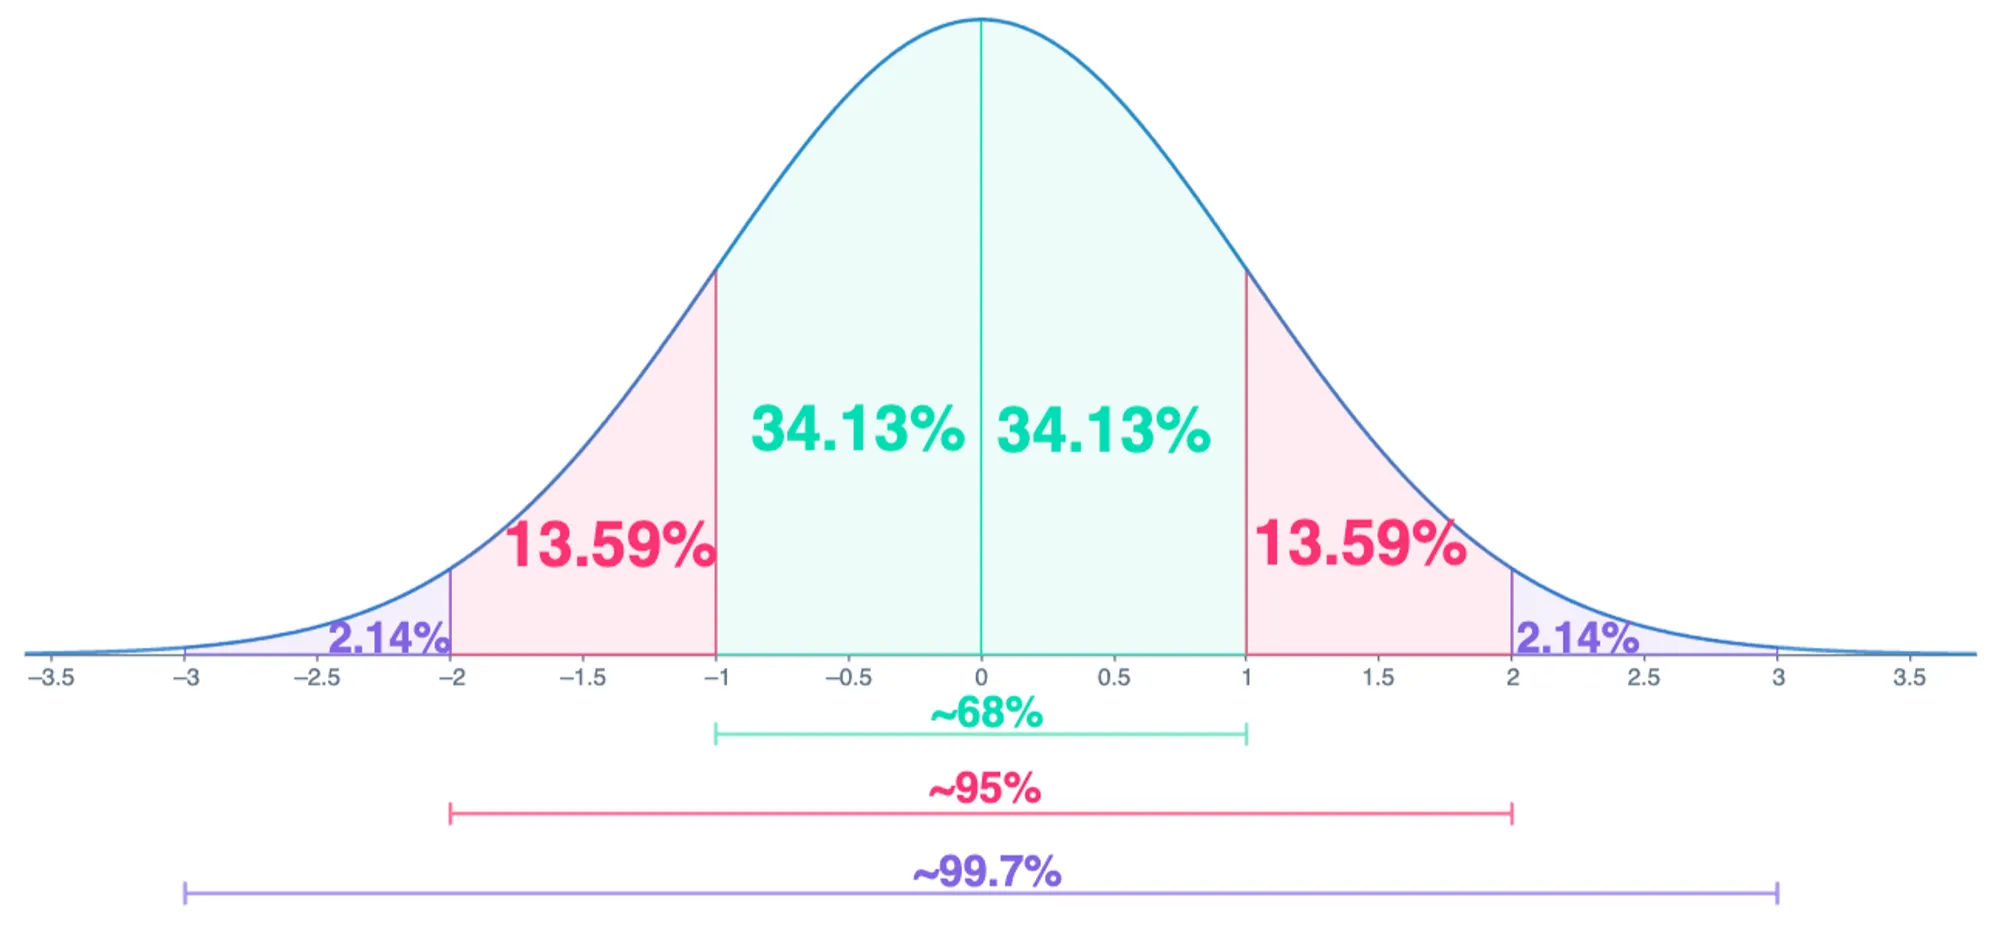
How is a normal distribution defined?
described by its mean and standard deviation
In relevance to distribution, what is the mean?
It is the most likely value—the average score
In relevance to distribution, what is the standard deviation?
how spread out; how far away do values fall from the mean

Which graphic shows the same mean but different standard deviations?
B
Which graphic shows the different mean but same standard deviations?
A
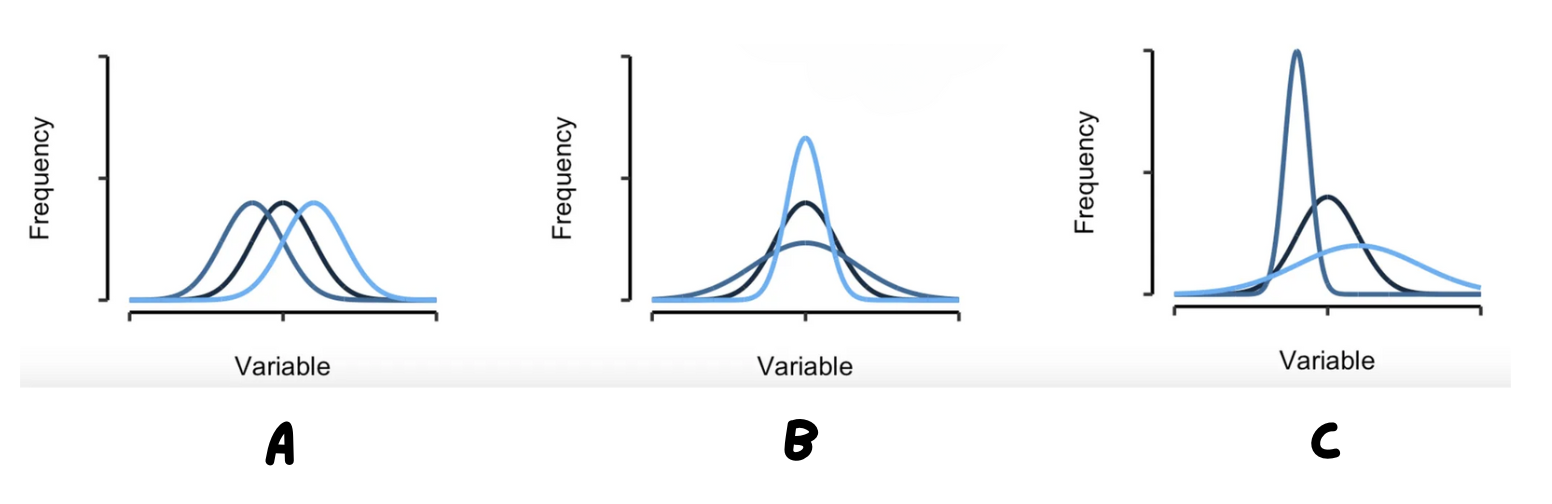
Which graphic shows the different mean and different standard deviations?
C
What do norms have to do with normal distribution?
if scores are distributed normally then we can interpret a single measurement with reference to the norms of the scale
What is a percentile?
tell you what percentage of the population has a score or value that’s lower/same than yours
What is a percentage and how is it different to a percentile?
A percentage represents the ratio expressed in terms of 100 and it tells an individual score, while a percentile is relative to the score that others made and it tells the score or rank as compared to the others
What are the types of statistics we’ve gone through this semester?
descriptive
inferential
What is descriptive statistics?
are used to describe a population or a sample
“how much does an adult red heeler typically weigh?”; asking about the centre — central tendency
“how much do different red heelers differ in how much they weigh”; spread of the distribution
What is inferential statistics?
are used when we want to use data from a sample to draw conclusions about a population
to make a conclusion
What are the two types of descriptive statistics?
measures of central tendency
measures of spread
What is covered in the measures of central tendency?
mean
median
mode
What is the mean?
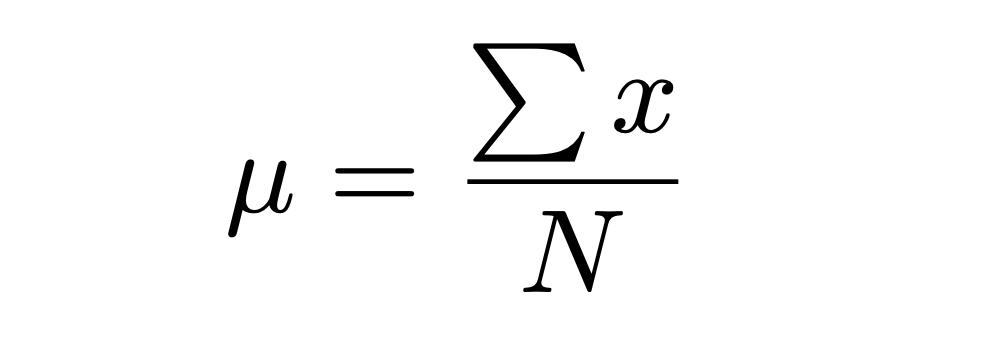
is the average or the most common value in a collection of numbers
arithmetic average of a distribution
What is the median?
the middle number in a sorted list of numbers
What is the mode?
the value most common in the distribution
How do you know which measure of central tendency to use?
it depends on the shape of the underlying distribution
when data is normally distributed — all 3 three should give the same answer
when data is skewed — the median is preferred
median is less affected by high values — comparative to the calculation of the mean
categorical data — mode is the most useful
data measured on a nominal scale
What is covered in the measures of spread?
variance
standard deviation
range
inter-quartile range
What measures of the spread of the data around the mean?
variance and standard deviation
What is variance?
calculates the average squared difference of observations from the mean
In relevance to measures of spread, what is standard deviation?
is the square root of the variance
What is range?
is the difference between its highest and lowest values
highest value — lowest value = range
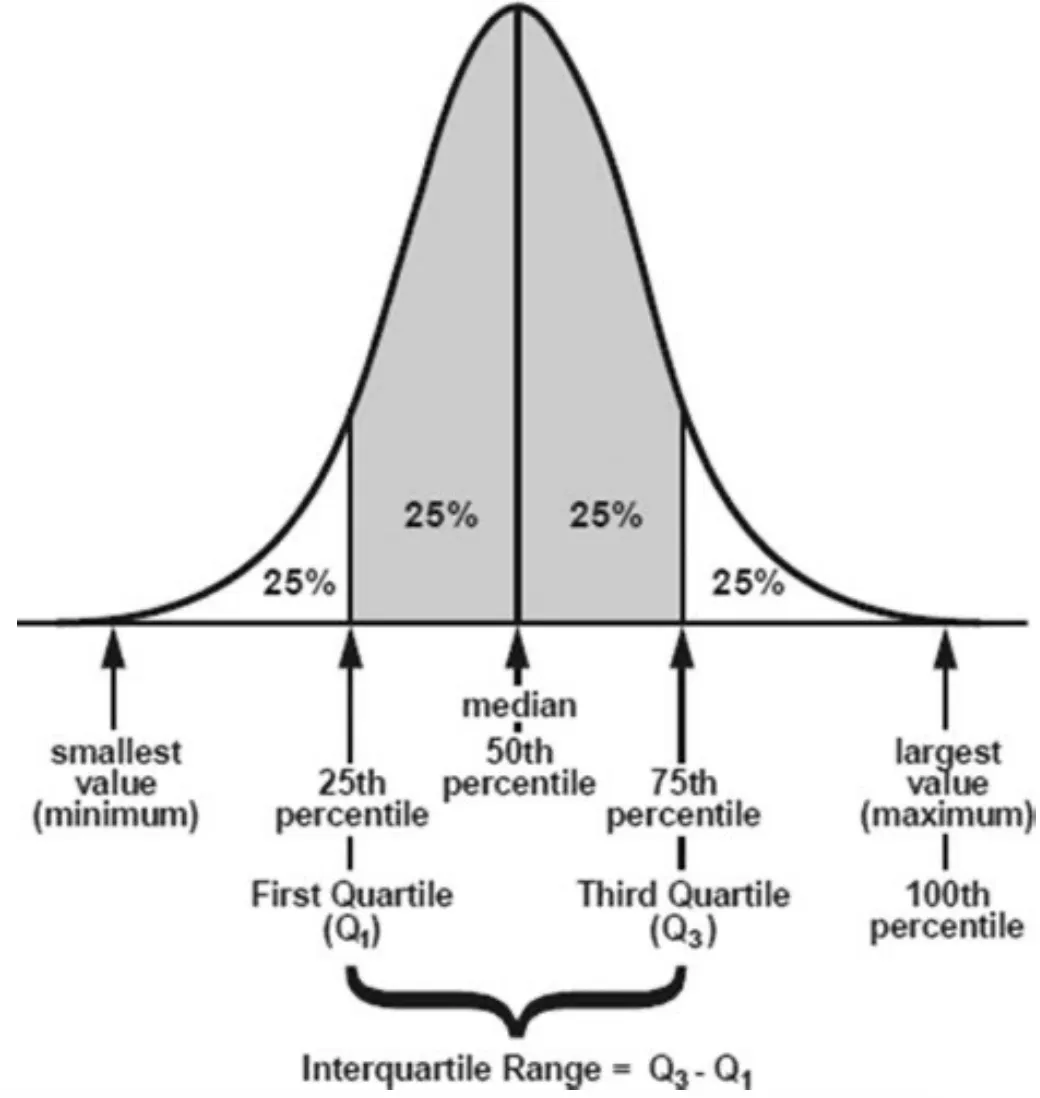
What is inter-quartile range?
is the difference between its first and third quartile
What are some other ways to conceptulising data?
continuous — observations can take on any value within the range of measurement
discrete — there are only some values that observations can take
integers, categories
What are the 4 measurement scales?
nominal
ordinal
interval
ratio
What is a nominal scale?
where the data is assigned to different categories and there is no systematic relationship between the different category labels
ethnicity, gender, brand etc
assesses differences between groups
What is an ordinal scale?
data where there is an inherent rank/order between categories
levels (1, 2, 3) , types of difficulties (easy/med/hard)
wouldnʼt make sense to average them
What is an interval scale?
numerical data with equal spacing between each number
temperature (farenheit), credit score
but the scale does not have a 0 point that indicates an absence of the quantity measured (0 is arbitrary)
What is a ratio scale?
THE BEST ONE—data have a meaningful numerical value, the intervals between different numbers are equivalent, and the scale has a true 0 point (absolute)
weight, height, length, time
can add, multiply, subtract, divide
makes sense to average