AP Psych Unit 0: An Introduction to Psychological Science Practices (Research Methods & Data Interpretation) Study Guide
1/83
Earn XP
Description and Tags
Name | Mastery | Learn | Test | Matching | Spaced |
|---|
No study sessions yet.
84 Terms
scientific attitude
mental outlook distinguished by an unbiased method & the application of empirical (knowledge based on observation or experience) approaches
curiosity
skepticism
humility
curiosity
1st element of the scientific attitude
does it work?
when put to the test, can its prediction be confirmed?
skepticism
2nd element of the scientific attitude
what do you mean?
how do you know?
must be healthy, meaning
not cynical/doubting everything
not gullible/believing everything
humility
3rd element of the scientific attitude
that was unexpected! let’s explore further
researchers must be
willing to be surprised
follow new ideas
because people & other animals don’t always behave as one’s ideas & beliefs would predict
critical thinking
thinking that does not automatically accept arguments & conclusions
examines assumptions
appraises the source
discerns hidden biases
evaluates evidence
assesses conclusions
hindsight bias
tendency to believe, after learning an outcome, that one would have foreseen it
i-knew-it-all-along phenomenon
overconfidence
tendency to think we know more than we do, to be more confident than correct
confidence drives us to quick thinking rather than correct thinking
perceiving order in random events
like hindsight bias & overconfidence, it’s a flaw in our common sense thinking
scientific method
self-correcting process for evaluating ideas w/ observation & analysis
observation
question
hypothesis
experiment
analysis & conclusions
sharing results
observation (SM)
1st step of the scientific method
theory construction through observing
question (SM)
2nd step of the scientific method
formulate inquiries/asks
hypothesis (SM)
3rd step of the scientific method
make predictions
experiment (SM)
4th step of the scientific method
gather/collect data
design studies/experiments
analysis & conclusions (SM)
5th step of the scientific method
analyze results
draw conclusions
sharing results (SM)
6th step of the scientific method
communicate findings to contribute to scientific knowledge
aid other researchers/scientists through your findings
peer reviewers
scientific experts who evaluate a research article’s theory, originality, & accuracy
theory
explanation using an integrated set of principles that organizes observations & predicts behaviors or events
hypothesis
testable/falsifiable prediction
often implied by a theory
falsifiability
possibility that an idea, hypothesis, or theory can be disproven by observation or experiment
operational definition
carefully worded statement of the exact procedures (operations) used in a research study
also known as operationalization
MUST be measurable
ex. human intelligence = what an intelligence test measures
replication
repeating the essence of a research study
usually w/ different participants in different situations to see whether the basic finding can be reproduced
if similar results are found, confidence in the reliability of the basic finding grows
non-experimental methods
case studies, surveys, naturalistic observations, correlational research
observe & record behavior
nothing is manipulated
no control of variables
single cases may be misleading
case study
non-experimental technique in which one individual or group is studied in depth in the hope of revealing universal principles
ex. brain damage, children’s minds, animal intelligence
naturalistic observation
non-experimental technique of observing & recording behavior in naturally occurring situations w/o trying to manipulate & control the situation
does not explain behavior, but describes behavior
survey
non-experimental technique for obtaining the self-reported attitudes or behaviors of a particular group
usually by questioning a representative, random sample of the group
desirability bias & self-report bias affect this technique negatively, causing the data to be inaccurate
desirability bias
bias from people’s responding in ways that they presume a researcher expects or wishes
self-report bias
bias when people report their behavior inaccurately
sampling bias
flawed sampling process that produces an unrepresentative sample
cannot compensate for an unrepresentative sample by simply adding more people
convenience sampling
collecting research from a group that is readily available
ex. friends at school
random sample
sample that fairly represents a population b/c each member has an equal chance of inclusion
creates a representative sample, better than biased/unrepresentative samples
bigger samples are better than smaller ones
population
all those in a group being studied from which samples may be drawn
except for national studies, does not refer to a country’s whole population
correlational research
non-experimental technique that describes the relationship between 2 or more variables
detect naturally occurring relationships
assess how well one variable predicts the other
collect data on 2 or more variables
nothing is manipulated
cannot specify cause & effect
correlation
measure of the extent to which 2 factors vary together & thus of how well either factor predicts the other
does not equal causation
suggests a possible cause-effect relationship but does not prove it
correlation coefficient
statistical index of the relationship between 2 things
from -1.00 to +1.00
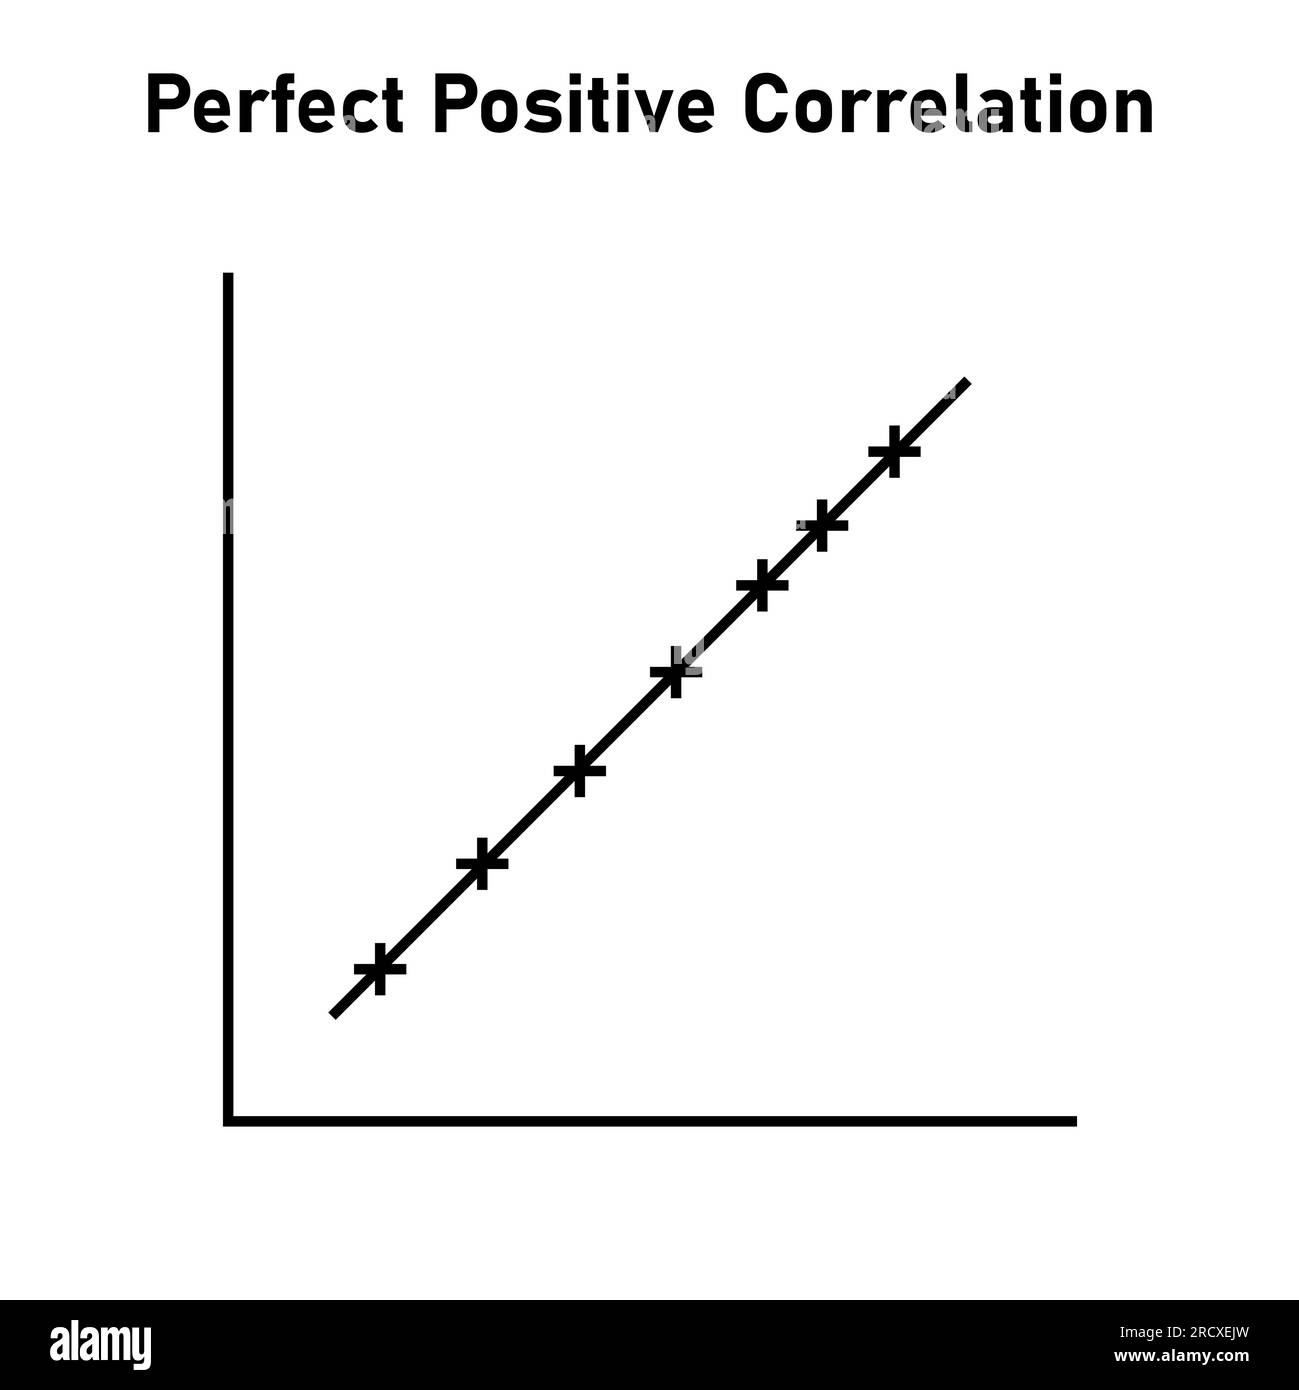
perfect positive correlation
r = +1.00
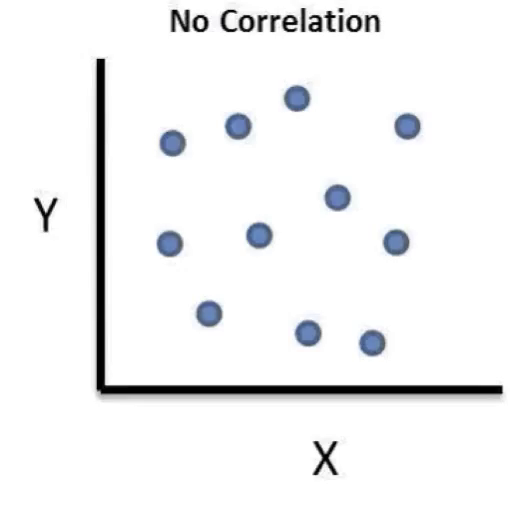
no relationship
r = 0.00
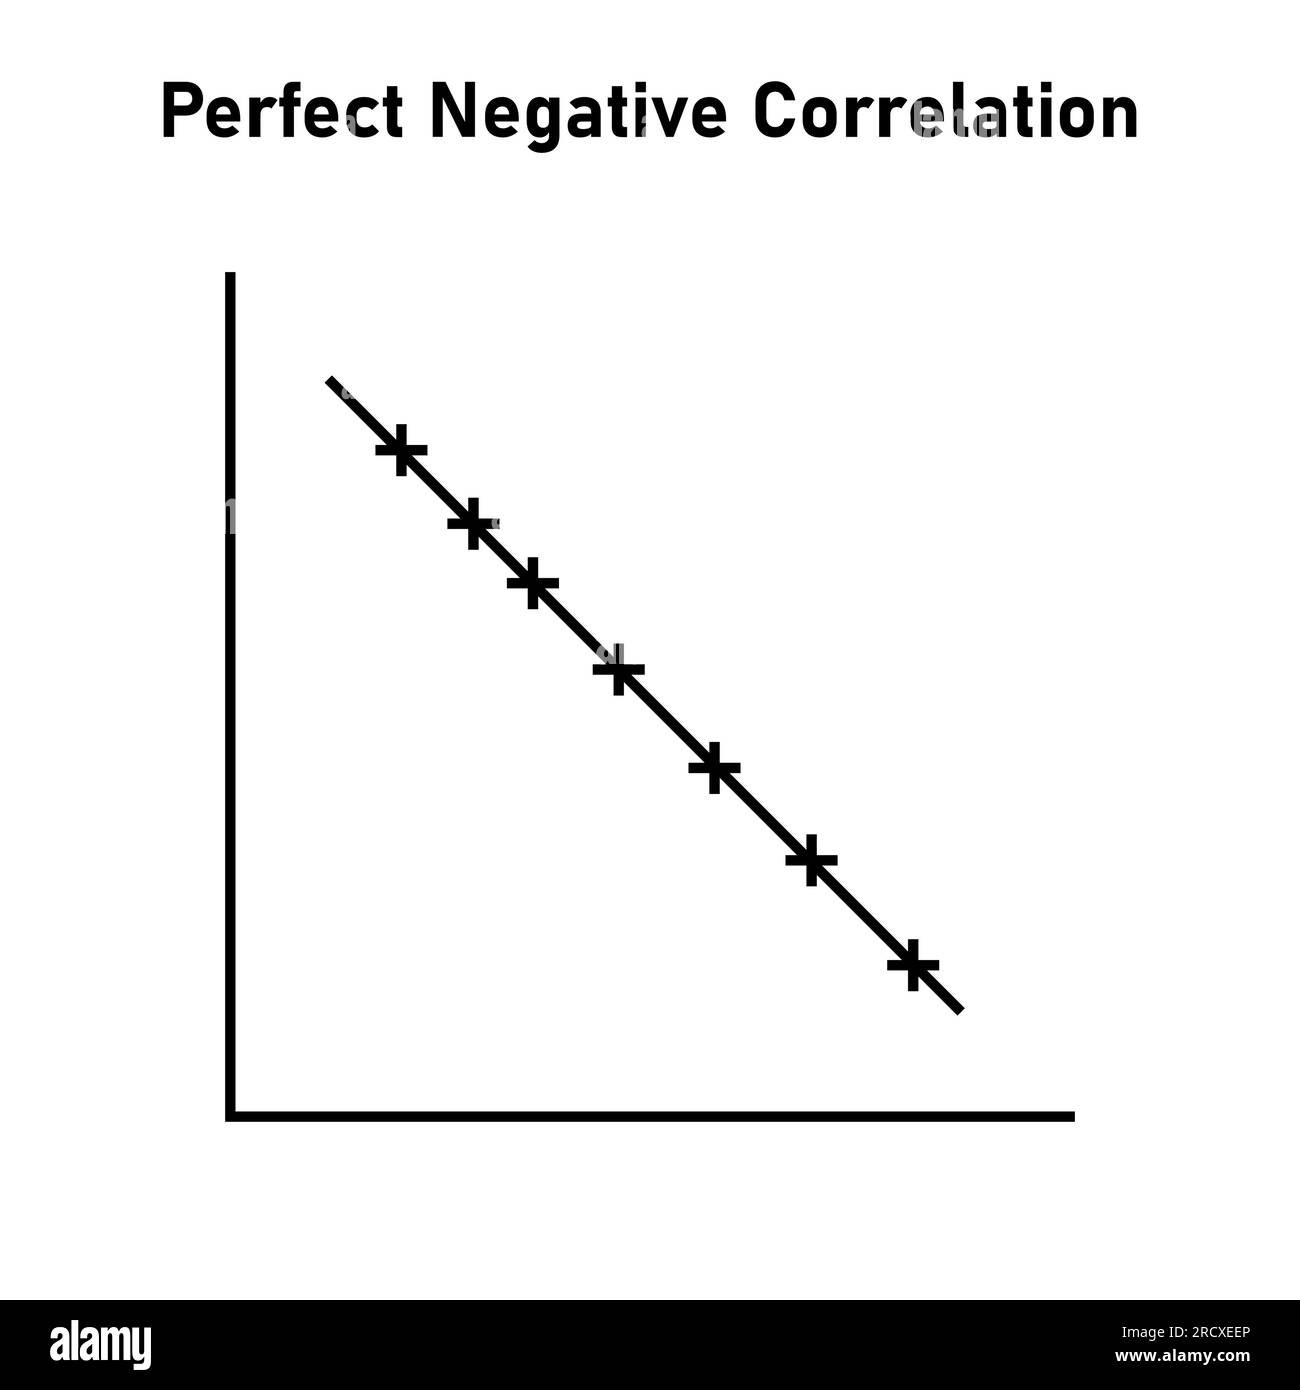
perfect negative correlation
r = -1.00
variables
anything that can vary & is feasible (practical, empirical) & ethical to measure
ex. personality test scores for identical twins, intelligence test scores predicting career achievement
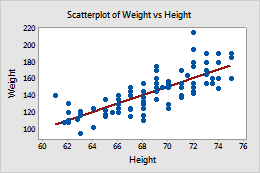
scatterplot
graphed cluster of dots, each of which represents the values of 2 variables
slope of the points suggests the direction of the relationship between the 2 variables
amount of scatter suggests the strength of the correlation (little = weak, lots = strong)
illusory correlation
perceiving a relationship where none exists or perceiving a stronger-than-actual relationship
regression toward the mean
tendency for extreme or unusual scores or events to fall back (regress) toward the average
experimental methods
manipulate variables to see their effects, attempt to establish a cause-&-effect connection
explore cause & effect
manipulate 1 or more factors
use random assignment
manipulate the independent variable(s)
sometimes not feasible
results may not generalize to other contexts
not ethical to manipulate certain variables
experiment
research method in which an experimenter manipulates 1 or more factors (independent variables) to observe the effect on some behavior or mental process (dependent variables)
by random assignment, the experimenter aims to control other relevant factors
experimental group
(in an experiment) group exposed to the treatment or independent variable
control group
(in an experiment) group not exposed to the treatment or independent variable
contrasts w/ the experimental group
serves as a comparison for evaluating the effect of the treatment or independent variable
random assignment
assigning participants to experimental & control groups by chance, minimizing preexisting differences between the different groups
equalizes experimental & control groups
helps control possible confounding variables
single-blind procedure
experimental procedure in which the research participants are ignorant (blind) about whether they have received the treatment or a placebo
help control social desirability bias
double-blind procedure
experimental procedure in which both the research participants & the research staff are ignorant (blind) about whether the research participants have received the treatment or a placebo
commonly used in drug-evaluation studies
researchers check a treatment’s actual effects apart from the participants & staff’s belief in its healing powers
reduce experimenter bias
placebo effect
experimental results caused by the expectations alone
any effect on behavior caused by the administration of an inert (chemically inactive) substance or condition which the recipient assumes is an active agent
thinking you are getting a treatment can boost spirits, relax the body, & relieve symptoms
independent variable
(in an experiment) factor that is manipulated
variable whose effect is being studied
can vary independently of other factors
dependent variable
(in an experiment) outcome that is measured
variable that may change when the independent variable is manipulated
can vary depending on what takes place during the experiment
confounding variable
(in an experiment) factor other than the factor being studied that might influence a study’s results
outlier variable, unexpected
experimenter bias
bias caused when researchers may unintentionally influence results to confirm their own beliefs
validity
extent to which a test or experiment measures or predicts what it is supposed to do/experiment tests what it is supposed to test
quantitative research
research method that relies on quantifiable, numerical data to represent degrees of a variable
quantity
ex. Likert scale
Likert scale
where questionnaire responses fall on a continuum such as from “strongly disagree” to “strongly agree”
qualitative research
research method that relies on in-depth, narrative data that are not translated into numbers
quality
ex. structured interviews to understand the causes & consequences of individuals’ aggression
structured interview
asking questions in a set order to collect data from a topic
interviewer asks a set of prepared closed-ended questions in the form of an interview schedule, which they read out exactly as worded
have a standardized format, meaning the same questions are asked to each interviewee in the same order
ethics codes
from the American Psychological Assocation (APA) & the British Psycholocal Society (BPS)
obtain informed consent
protect participants from greater-than-usual harm & discomfort
keep info about individual participants confidential
fully debrief people
informed consent
giving potential participants enough info about a study to enable them to choose whether they wish to participate
called informed assent in the case of minors
1st of the ethics codes
protection from harm
protect participants in experiments/research from harm
2nd of the ethics codes
protection of participant confidentiality
keep info about the participants confidential
3rd of the ethics codes
debrief
postexperimental explanation of a study including its purpose & any deceptions to its participants
4th of the ethics codes
Instutional Review Boards (IRBs)
established to enforce the ethics codes
compromised of at least 5 people — must include at least 1 scientist, at least 1 non-scientist, & at least 1 community representative
screen research proposals & safeguard “the rights, welfare, & well-being of human research participants”
descriptive statistics
numerical data used to measure & describe characteristics of groups
measures of central tendency
measures of variation
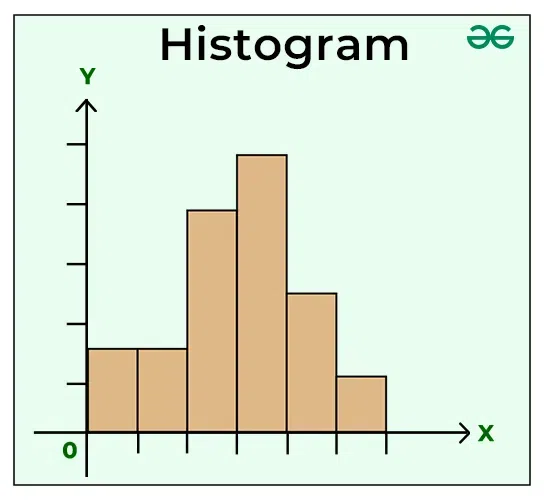
ex. histogram
histogram
bar graph depicting a frequency distribution
measures of central tendency
single score that represents a whole set of scores
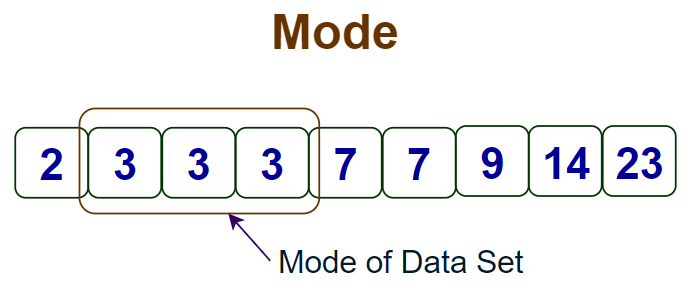
mode
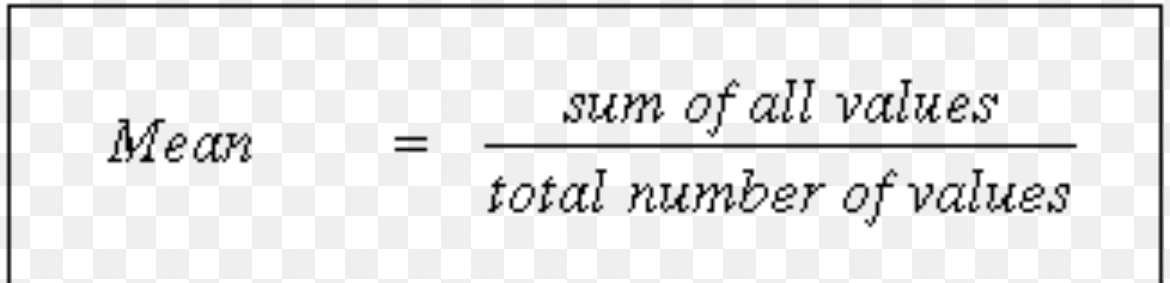
mean
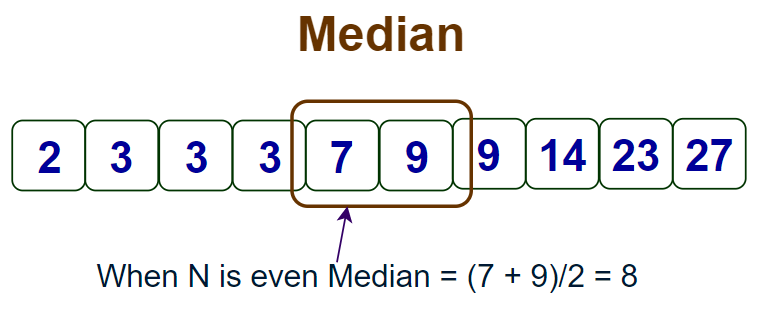
median
mode
most frequently occurring score(s) in a distribution
simplest measure
mean
arithmetic average
total sum of all the scores divided bu the number of scores
median
midpoint of a data distribution or 50th percentile
arrange all scores from highest to lowest, half will be above median & half will be below the median
if there are 2 numbers in the middle, add them together & divide by 2
percentile rank
percentage of scores that are lower than a given score
ex. 79th percentile = score is higher than 79% of other scores
skew
representation of scores that lack symmetry around their average value
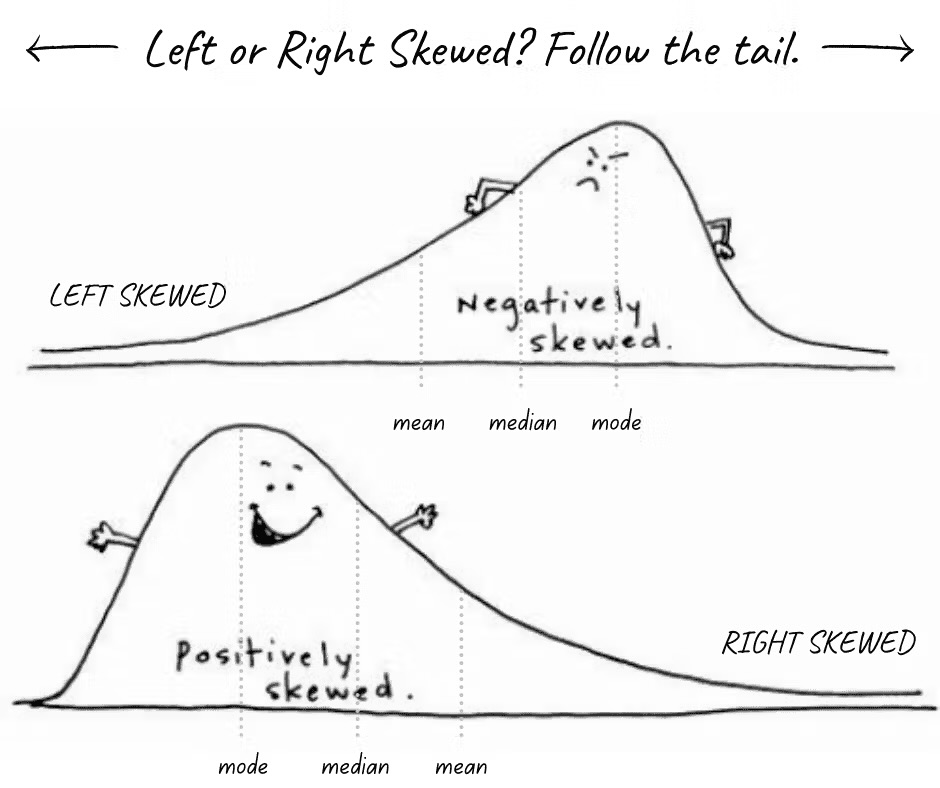
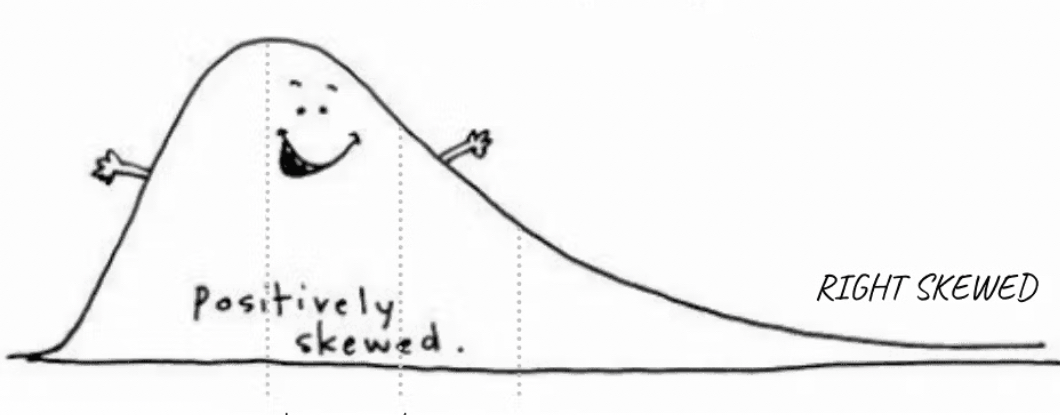
positively skewed/right skewed
the tail of the distribution points to the right
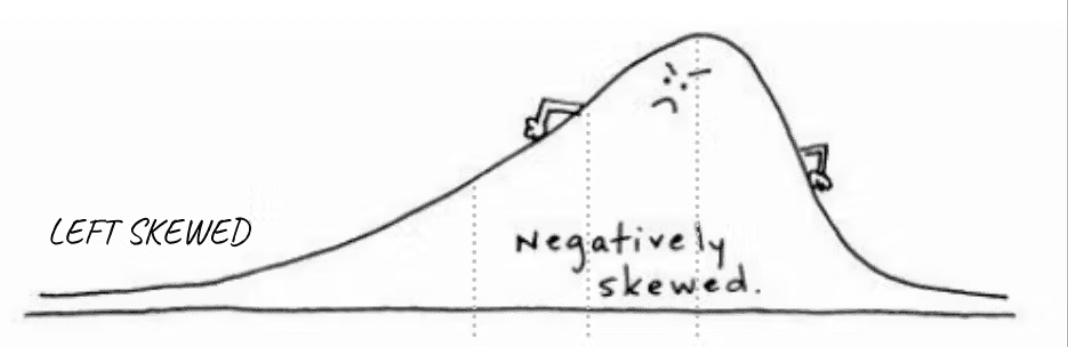
negatively skewed/left skewed
the tail of the distribution points to the left
measures of variation
the similarity or diversity of scores
range
standard deviation
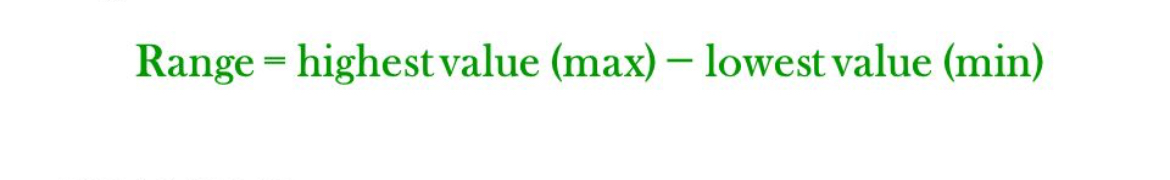
range
difference between the highest & lowest scores in a distribution
highest score minus lowest score
standard deviation
computed measure if how much scores vary around the mean score
gauges whether scores are packed together or dispersed
assembles info about how much each individual scores differ from the mean
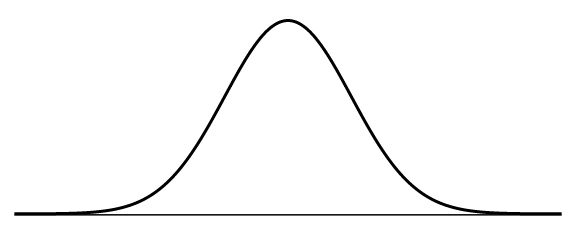
normal curve
symmetrical, bell-shaped curve that describes the distribution of many types of data
most scores fall near the mean (~68% fall w/in 1 standard deviation of it)
fewer & fewer scores lie near the extremes
also called a normal distribution
inferential statistics
numerical data that allow one to generalize, to infer from sample data the probability of something being true of a population
help determine if results can be generalized to a larger population
meta-analysis
statistical procedure for analyzing the results of multiple studies to reach an overall conclusion
null hypothesis
assumption that no difference exists between groups
alternative hypothesis
states the opposite of one’s hypothesis
statistically significant
statistical statement of how likely it is that a result occurred by chance, assuming there is no difference between the populations being studied
effect size
strength of the relationship between 2 variables
larger size = more 1 variable can be explained by the other
smaller size = less 1 variable can be explained by the other