Medical Interventions Unit 3
1/56
There's no tags or description
Looks like no tags are added yet.
Name | Mastery | Learn | Test | Matching | Spaced |
|---|
No study sessions yet.
57 Terms
CT Scan
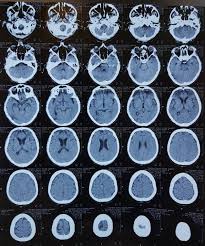
CT rules
bone is white
less dense tissue and fluids are dark
table or brace may be visible
MRI rules
bone is black
less dense tissue and fluids are light
no table or brace is visible
Hyperplasia
increase in number of cells
CT scans are created by
x-rays, formed from cross-sectional “slices”; creates a 3D image
CT scans are used for
organs, soft tissue blood, blood vessels
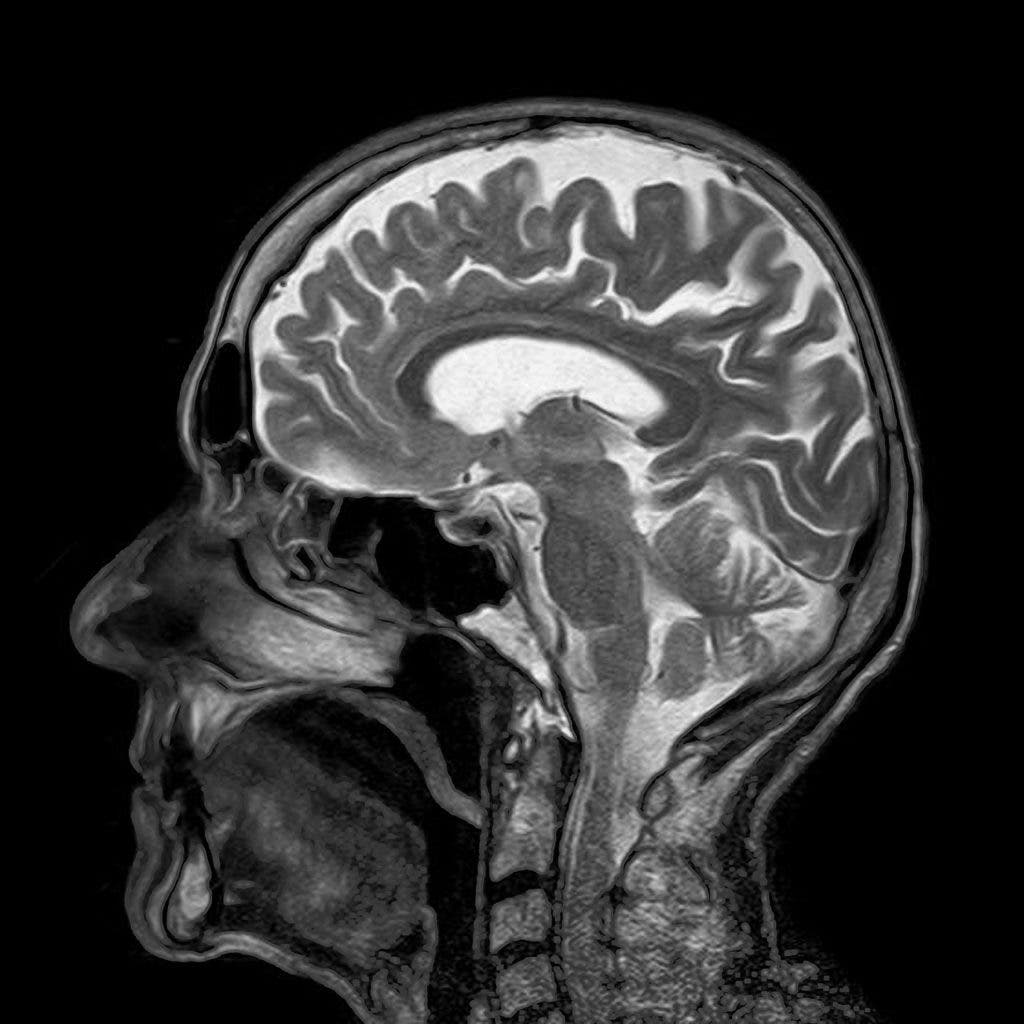
MRI
MRIs are created with
magnets and radio waves; no radiation
MRI’s are used for
diagnose soft tissue issues, joints, tendons, ligaments
muscles
brain
X-ray
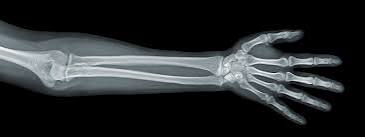
X-rays are created by
electromagnetic radiation; 2-D image
X-rays are used for
dense tissue: bone
bone scan
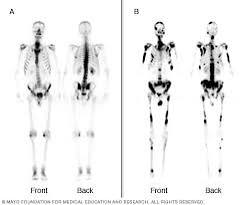
bone scans are used for
whole body scan to determine bone metabolism and cancer metastasis
bone scans are created by
radioactive substances injected and rate of uptake in this tissues is imaged
sarcomas
cancer that affects the bone and soft tissues (connective tissue)
can affect fat, bone, and muscle
arise in cells supporting tissue (ex: bone, cartilage, fat)
carcinomas
cancer in cells that make up lining of organs (epithelia)
can affect breast, skin, colon, lung, prostate, and bladder
arise from cells that cover external/internal surfaces
lymphomas
cancer that begins in cells of the immune system, lymphocytes (t cells or b cells)
leukemia
cancer in the bloodstream/bone marrow
doesn’t form solid tumors
apoptosis
programmed cell death
cancer
disorder in which some of the body’s cells lose the ability to control growth
mitosis
cell division in which the nucleus divides into nuclei containing the same number of chromosomes
cell cycle checkpoints
points of transition between different phases of the cell cycle that are regulated; checks for errors occur
dysplasia
abnormal growth and development of cells and tissue
considered precancerous
metastasis
cancer cells penetrate into lymphatic/blood vessels and circulate in bloodstream
benign tumors
non cancerous
slow growing
can’t spread
malignant tumors
cancerous
fast growing
can spread by invasion or metastasis
angiogenesis
when new blood vessels are formed from existing one
cancer cells stimulate to “feed” tumors
cancer cell characteristic
irregularly shaped dividing cells
large, weird nucleus
disorganized arrangement
variation in cell size/shape
oncogenes
genes that have potential to cause a normal cell to become cancerous
proto-oncogenes
a gene involved in normal cell growth
mutations in proto-oncogenes may cause it to become an oncogene
tumor suppressor genes
genes that slow down cell division, repair DNA mistakes, or tell cells when to die (apoptosis)
absence can lead to cancer
brake pedal of cell growth
p53
“guardian of geneome”
activates genes that stop cell growth or cause cells to die when cell has damaged DNA
involved with cell cycle checkpoints
tumor suppressor
replicate senescense
normal cells have a limited capacity for replication
fixed number of times they can undergo mitosis.
contact inhibition
normal cells stop replicating when they hit a barrier
how do we know if a gene is “turned on”?
it is transcribing mRNA
what are in the wells on a DNA Microarray?
each well has strands of DNA for a specific gene of interest
DNA Microarray
extract RNA from samples
add labeling mix: will create a complimentary DNA strand for each RNA molecule (using reverse transcriptase and a primer); green and red fluorescent markers added
wash over microarray; DNA and cDNA will bind
lasers reveal microarray colors
cDNA
complimentary DNA
obtained from healthy and cancerous tissue
has fluorescent labels that allows us to visualize it (green = healthy, red = cancer)
yellow spots on microarray
gene hybridized to both green and red cDNA
equally transcribed in both cancer and normal tissue
red spot on microarray
genes that produce more mRNA in cancer cells (up-regulated in cancer)
green spots on microarray
genes that produce more mRNA in healthy cells (down-regulated in cancer)
black spots in microarray
gene not transcribed in the healthy cell or cancer cell
when microarray ratio is > 1
gene is induced by tumor formation
when microarray ratio is < 1
gene is suppressed by cancer cells
when microarray ratio = 1
expressed in both cells (not important to research)
when microarray ratio = 0
not expressed in either cell
when base 2 log is positive
up-regulated in cancer
when base 2 log is negative
down-regulated in cancer
when base 2 log is = 1
not affected by tumor formation
when PCC is positive
gene profiles behave similarly; larger = stronger correlation
when PCC is negative
gene profiles behave in opposite waves; larger = more opposite
when PCC is 1
gene expression is identical
when PCC is 0
unrelated gene expression
dendrogram
treelike diagram used to display results; used to link gene expressions that are closely related
correlation
a measure of the relationship between two variables
ex: genes and treatments
risk factors for cancer
alcohol
obesity
smoking
genetics
age