Exam 2 Review
1/71
Earn XP
Description and Tags
Name | Mastery | Learn | Test | Matching | Spaced |
|---|
No study sessions yet.
72 Terms
What is Statistical Inference?
Draw conclusions about population parameters using sample statistics

What is a parameter?
A measurement on a population
What is are two known facts about parameters?
1. They're fixed values
2. The values are often unknown
What is a statistic?
A measurement on a sample
What are two known facts about statistics?
1. They're known, or can be calculated once the sample is collected
2. Once a different sample is taken, it's most likely a diffrent value would be obtained (statistics vary from sample to sample)
If we need to identify the parameter we are conducting inference on, what two questions should we ask ourselves?
1. How many variables are being measured (one or two)?
2. What type of data do we have (categorical or quantitative)?
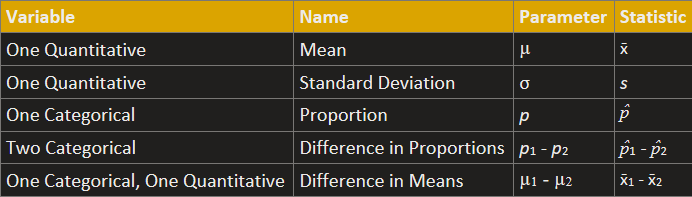
If we have one variable, the only parameters we could be doing inference on would be are what?
Mu or p
If we have one quantitative variable, we use what? (Hint from notes, mean gas price)
M (mu), the population mean
If we have one categorical variable, we use what? (Hint from notes, ESP)
P, the population proportion
If we have two variables that are both categorical, our parameter is the difference between population proportions, notated as what? (Hint, seatbelt use among teens and seniors)
p1 - p2
If we have two cateogrical groups measured using quantitative data, our parameter is the difference between populations means, notated as what? (Hint, word recal for nap and pill groups, or male and female height)
m1 - m2 (pronounced mu 1 - mu 2)
What is a Sampling Distribution?
The distribution of all statistics calculated from all samples of the same size, n, collected from a population. All samples must be collected randomly.
When should sampling distributions be constructed?
Only for two statistics, the sample mean and the sample proportion
Regarding the sampling distribution of the sample proportion, what is shape?
It depends on the size of the sample. With a large enough sample, the shape of the sampling distribution can be bell-shaped and symmetric
Regarding the sampling distribution of the sample proportion, what is center?
In all cases, the mean of the many, many p-hats is the population proportion, p
Regarding the sampling distribution of the sample proportion, what is spread?
As the sample size, n, increases, the standard error (standard deviation of the p-hats) decreases
Regarding the sampling distribution of the sample mean, what is shape?
It depends on the shape of the original population and/or the size of the sample. If the population being samples from is normal, then the sampling distribution will always be normal. If the population is not normal, but we have a large enough sample size (n > 30), the shape of the sampling distribution will also be bell-shaped and symmetric (approximately normal)
Regarding the sampling distribution of the sample mean, what is center?
In all cases, the mean of the many, many sample means (x-bars) is the mean population, m (or Mu)
Regarding the sampling distribution of the sample mean, what is spread?
As the sample size n, increases, the standard error (standard deviation of the x-bars) decreases
What is a confidence interval for a parameter?
An interval computed from sample data by a method that will capture the parameter for a specified proportion of all samples
What is a confidence interval for a statistic?
They supplement a statistic with an indication of the statistic's variability.
What question does a confidence interval answer?
"What is the value of the parameter?" This is a method of estimation.
Does a confidence interval make any claim or statement about the parameter?
No, no statement or claim is made about the parameter using a confidence interval
What two things do confidence intervals provide you with?
1. A range of plausible values for a population parameter
2. A confidence level, which expresses our level of confidence that the interval contains the population parameter
What do we know about confidence level interpretation?
We are 95% confident that the interval captures the true population parameter
In the long run, if we collected many, many samples and constructed many, many 95% confidence intervals, what would we capture?
95% of those confidence intervals will capture the unknown population parameter
How do we calculate the confidence interval?
CI: statistic +/- margin of error
True or False: The margin of error does not include the standard error in its calculation
False, the margin of error DOES include the standard deviation in its calculation
What is bootstrapping?
A method to estimate the standard error of a statistic without any knowledge of the population
True or False: Bootstrapping involves sampling without replacement from the original sample
False, bootstrapping involves sampling WITH replacement from the original sample
True or False: The size of a bootstrap sample will be the same size as the original sample
True, the bootstrap sample will be the SAME SIZE as the original sample
True or False: The center of the bootstrap distribution will be the standard deviation
False, the center of the bootstrap distribution will be the ORIGINAL STATISTIC
If we had a sample of size 6, how many samples would we take from the original sample using the "with replacement" strategy?
A. 12
B. 6
C. 24
D. 3
B. 6
Which of the following are true about bootstrap distributions?
A. The bootstrap distribution will be a collection of many, many bootstrap statistics
B. Most of these distributions are bell-shaped and symmetrical
C. The standard error is given with the bootstrap distribution
D. All of the above
D. All of the above
How do we calculate a 95% confidence interval (CI)?
95% CI: statistic +/- 2(SE)
How do we calculate a 90% or a 99% confidence interval (CI)
Using the percentile method in StatKey (right-tail and left-tail, or two tail)
True or False: As the confidence level increases (e.g. 90% to 95%), the width of the confidence level (CI) decreases
False, the width of the confidence level (CI) INCREASES with the rise of the confidence level
True or False: As the sample size of each sample increases (e.g. n = 50 to n = 500) the width of the CI will decrease (get more narrow)
True, the width of the confidence interval (CI) will DECREASE with the rise of the sample size
What is an hypothesis test?
An hypothesis test is used to judge or test between two different claims about the parameter
True or False: A claim is made about the parameter and a valuefor the parameter is stated in the null hypothesis,which is assumed to be false
False, a claim is made about the parameter and a valuefor the parameter is stated in the null hypothesis, which is assumed to be TRUE
True or False: An hypothesis test is a decision making process for evaluating claims about a staistic
False, an hypothesis test is a decision making process for evaluating claims about a POPULATION
What is the goal of an hypothesis test?
To assess evidence provided by the sample data to test a claim made about a population parameter
True or False: To accomplish an hypothesis test, you must compate the sample statistic obtained from a sample to a specific value claimed to be the sample statistic
False, to accomplish an hypothesis test, you must compate the sample statistic obtained from a sample to a specific value claimed to be the POPULATION PARAMETER
True or False: The true population parameter is a known quantity
False, the true population parameter is an UNKNOWN quantity
There are five steps in conducting an hypothesis test. What is the first step? (Hint, parameters of interest)
State the null and alternative hypotheses (it helps to state the parameters of interest)
There are five steps in conducting an hypothesis test. What is the second step? (Hint, what are we looking at?)
Find the observed sample statistic
There are five steps in conducting an hypothesis test. What is the third step? (Hint, randomization distribution)
Obtain the p-value (using the randomization distribution and Ha)
There are five steps in conducting an hypothesis test. What is the fourth step? (Hint, make a decision)
Make a generic decision about H0: Reject H0 or do not reject H0
There are five steps in conducting an hypothesis test. What is the fifth, and final, step? (Hint, pretend you're writing an essay)
Make a conclusion in context, indicating whether or not we have convincing evidence for Ha and referring back to the question of interest
True or False: Just like bootstrapping, for each randomization sample in a randomization distribution, we calculate the parameter of interest
False, just like bootstrapping, for each randomization sample in a randomization distribution, we calculate the STATISTIC of interest
True or False: Many randomization statistics must be collected in order to generate a randomization distribution; this process must be repreated several times
True, many randomization statistics must be collected in order to generate a randomization distribution; this process MUST be repeated several times
What is true about the randomization distribution?
1. The randomization distribution will be centered at the value indicated by the null hypothesis
2. It shows what values of the sample statistic are likely to occur by random chance if the null hypothesis is true
True or False: The null hypothesis claims the effect we are looking for does exist
False, the null hypothesis claims the effect we are looking for does NOT exist. Also known as the no-change or no-difference hypothesis
True or False: The equal sign is always used in the null hypothesis
True, the equal sign is ALWAYS used in the null hypothesis
True or False: The alternative hypothesis says the claim we are looking for does exist
True, the alternative hypothesis says the claim we are looking for DOES exist (find the claim in the problem)
True or False: We believe the null hypothesis to be true throughout the calculation
True, we believe the null hypothesis to be TRUE throughout the calculation
What do we do after stating the hypotheses and generating a randomization distribution under the belief that the null hypotheiss is true?
Calculate the p-value
What is the p-value?
The proportion of samples that would give a statistic as extreme as (or more extreme than) the observed sample result, when the null hypothesis is true
The p-value gives us a way to numerically measure our surprise. What do smaller proportions mean?
Smaller proportions provide evidence AGAINST the null hypothesis, meaning we're very surprised
The p-value gives us a way to numerically measure our surprise. What do larger proportions mean?
Larger proportions provide NO evidence against the null, meaning we're not surprised at all
What are the steps for calculating the p-value?
1. Locate where the sample statistic lies in our randomization distribution
2. Determine what proportion of simulated statistics on the randomization distribution are as extreme as the observed statistic
True or False: The extreme of the p-value does not depends on the sign of the alternative hypothesis.
False, the extreme DOES depend on the sign of the alternative hypothesis
True or False: Sample statistics farther out on the tail of the randomization distribution give smaller p-values
True, Sample statistics farther out on the tail of the randomization distribution give SMALLER p-values.
In cases where the p-value is smaller, is it likely for the sample statistic to occur by chance alone?
No, in cases where the p-value is small, it is UNLIKELY for the sample statistic to have occured by chance alone
True or False: The smaller the p-value, the weaker the statistical evidence is against the null hypothesis and in support of the alternative hypothesis
False, the smaller the p-value, the STRONGER the statistical evidence is against the null hypothesis and in support of the alternative hypothesis
What is the decision rule for rejecting H0?
If our p-value < a (alpha), then we REJECT H0 (in favor of Ha)
What is the decision rule for not rejecting H0?
If our p-value is > a (alpha), then we DO NOT REJECT H0
What is a Type I Error?
A Type I Error occurs when we reject a true null hypothesis (also known as a false positive)
What is a Type II Error?
A Type II Error occurs when we do not reject a false null hypothesis (also known as a false negative)
True or False: A two-tailed hypothesis test using the significance level "a (alpha)" does not reject the null hypothesis exactly when the value stated in the null hypothesis is not captured by "a (alpha)" (1 - a) confidence interval
False, A two-tailed hypothesis test using the significance level "a (alpha)" REJECTS the null hypothesis exactly when the value stated in the null hypothesis is not captured by "a (alpha)" (1 - a) confidence interval
In regards to a two-tailed hypothesis test, if a 95% confidence interval (CI) does NOT capture the parameter stated in the null hypothesis (H0), then what should happen?
A two-tailed hypothesis test should reject H0 at a 5% significance level
In regards to a two-tailed hypothesis test, if a 95% CI DOES capture the parameter stated in the null hypothesis (H0), then what should happen?
A two-tailed hypothesis test should not reject H0 at a 5% significance level