revenue costs and profits 3.3
1/32
There's no tags or description
Looks like no tags are added yet.
Name | Mastery | Learn | Test | Matching | Spaced | Call with Kai |
|---|
No study sessions yet.
33 Terms
Total costs
the overall costs of production incurred by firms when producing a certain level of output
fixed costs + variable costs
total fixed costs
costs that do not change with output
e.g rent and salaries
total variable cost
costs that change with output
e.g raw materials, electricity, wages
variable cost X quantity
average total cost
cost per unit
ATC=TC/Q
AFC+AVC
Average fixed costs
fixed cost per unit of output
Falls as output rises
TFC/Q
Average variable cost
variable cost per unit of output
TVC/Q
Marginal cost
The extra cost of producing one more unit of output
typically falls at first (due to increasing returns) the rises (law of diminishing returns)
Change in TC/ Change in QUANTITY
Short run
at least one factor of production is fixed
long run
all factors of production are variable
firms can plan for increased capacity and production
marginal product of labour
the change in output that results from adding an additional unit of labour
law of deminishing marginal returns
when additional units of variable factors of production are added to a fixed factor
marginal output (output per worker) will eventually decrease
MP diagram
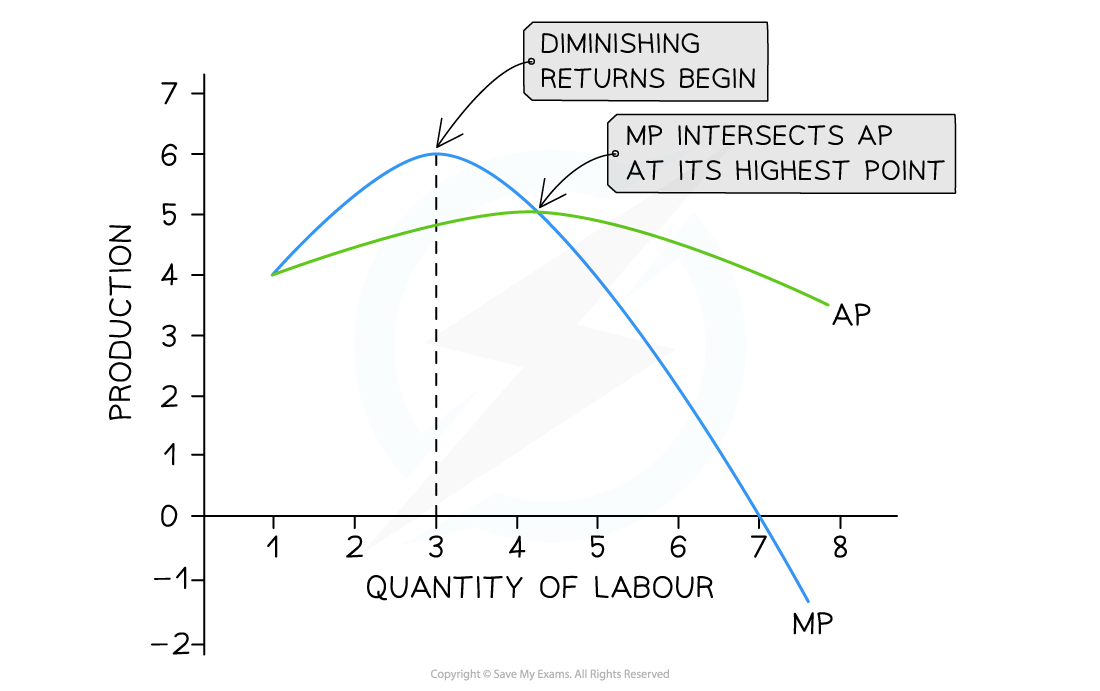
In the short run, marginal product (MP) increases with the addition of three workers before diminishing returns for each additional worker begin
diagram analysis
A small food van selling burgers (product) at a music festival increases productivity up to the addition of a third worker
After that, workers get in each other's way and there is not enough grill space (capital) so MP no longer increases
If more workers are hired, then the MP of each additional worker begins to fall
Adding additional workers up to the 7th worker will keep increasing the total product
With the hiring of the 7th worker, the MP turns negative, which will decrease the total product
connection between DMR and the cost curves
As the marginal product increases, marginal costs decrease
- increasing returns= decreasing costs
decreasing returns= increasing costs
cost curve
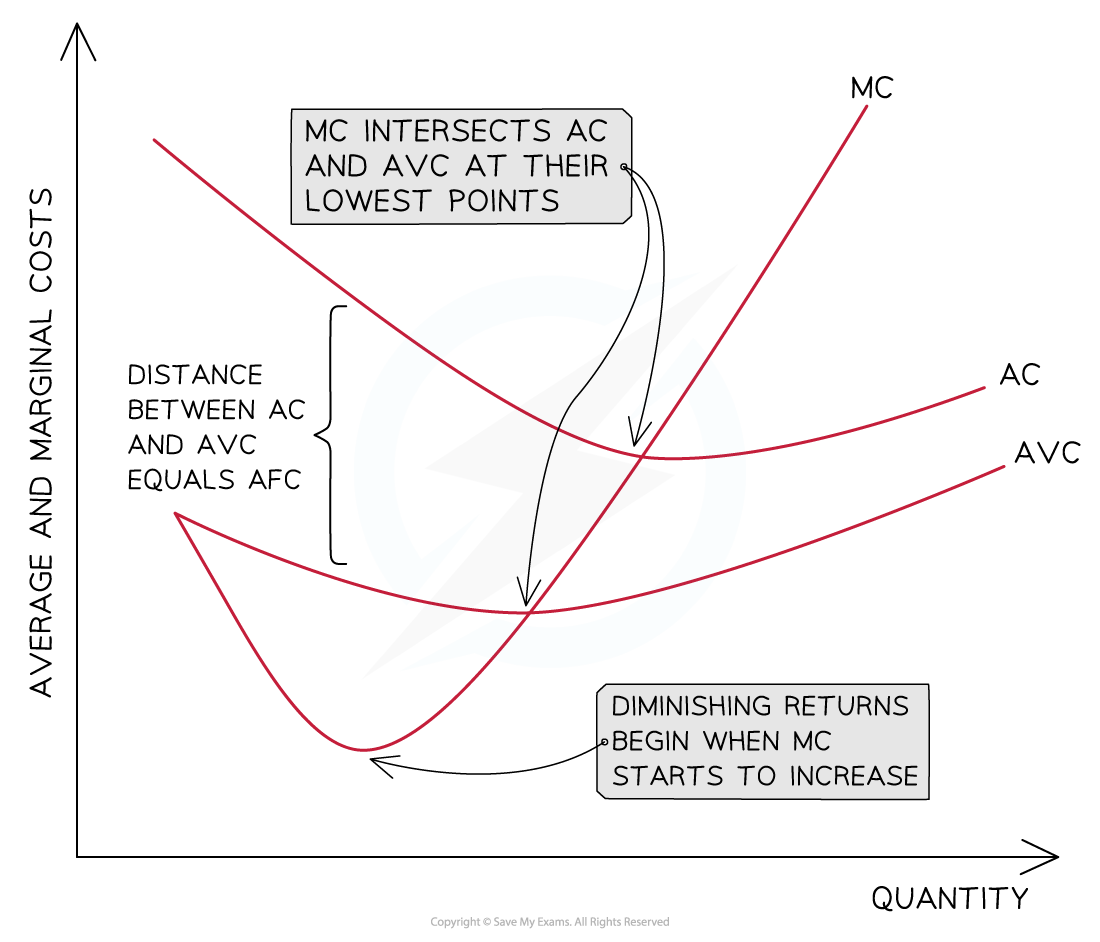
Marginal costs fall as long as there are increasing marginal returns
Diagram analysis
The distance between the AVC and AC = the AFC
AVC converges towards AC as the AFC continuously decreases with an increase in output
AVC decreases as additional workers are added and each worker produces additional product
Marginal costs (MC) decrease initially as additional workers are added and the marginal product is increasing
Diminishing returns begin when the MC starts to increase
MC will cross the AVC and AC curves at their lowest point
As long as the cost of producing the next unit (MC) is lower than the average, it will pull down the average
When the cost of producing the next unit (MC) is higher than the average, it will pull up the average
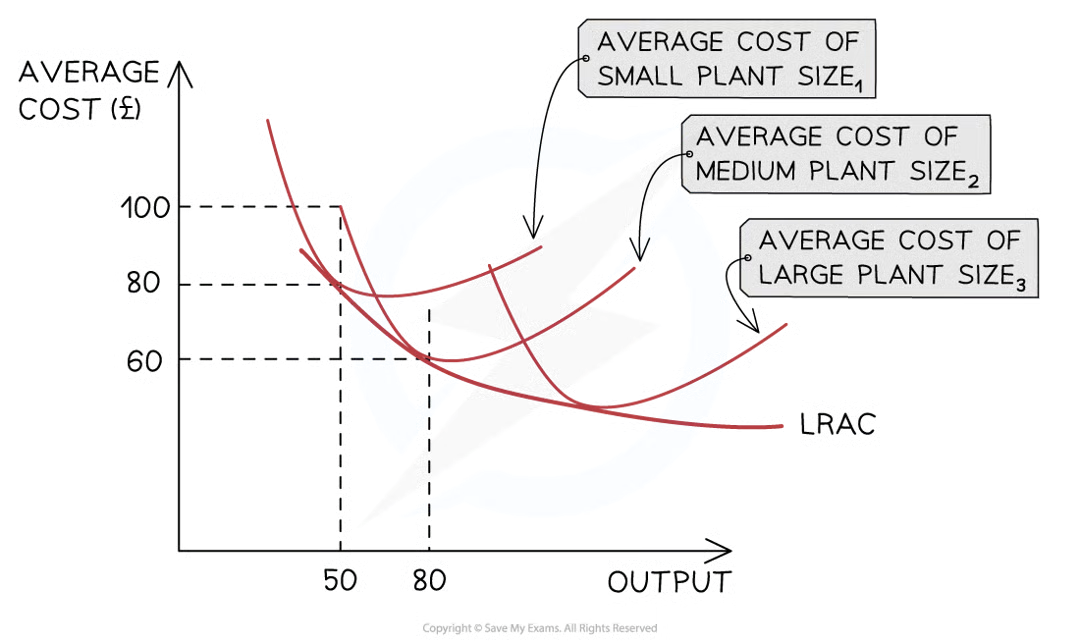
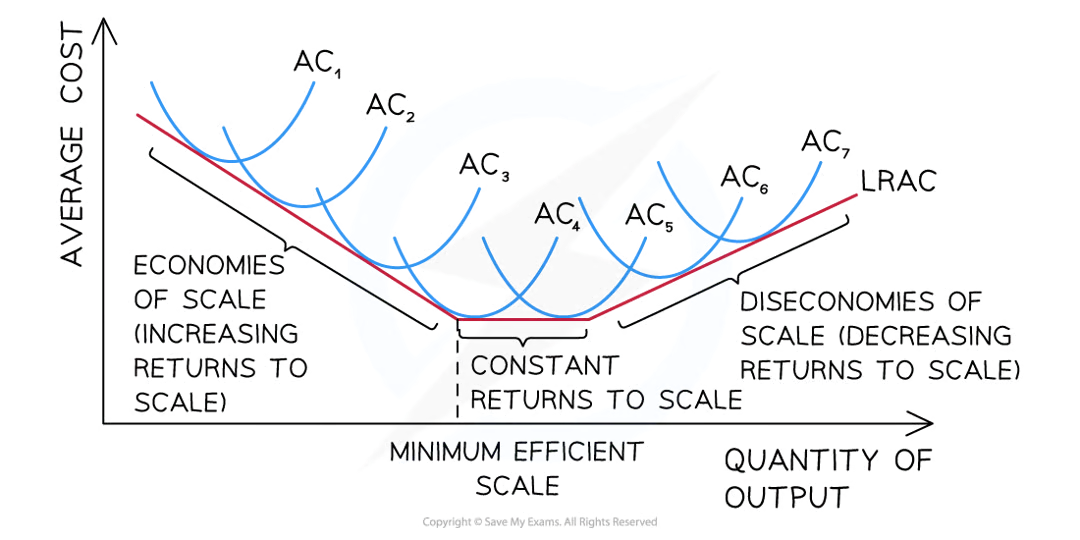
LRAC curve
is the line of best fit between the lowest points of the short-run ATC curves
In the long-run, they are able to plan to increase the scale of production
Total revenue
The total value of all sales a firm incurs
PxQ
Marginal revenue
The extra revenue received from the sale of an additional unit of output
change in TR/ change in Q
price taker
Firms that have no market power and are unable to influence price- they take the ‘going price’ offered by the market
economies of scale
long run average costs decrease
firms enjoy increasing returns to scale- Occurs when an increase in sales leads to a larger then proportional increase in output
decreasing returns to scale
Occurs when an increase in the qty of inputs leads to a less than proportional increase in the qty of output
types of economies of scale
Financial economies- lower interest rates on loans
Managerial Economies- large firms can employ specialist managers
Purchasing economies- when large firms bulk buy raw materials which lower AC
Types of diseconomies of scale
management diseconomies- managers work in self interest rather than interest of firm
communcation diseconomies- when a firm has multiple layer of management in different locations slow responses, increases AC
Geographical diseconomies- when a firm has widespread bases of operations
minimum efficient scale
The lowest cost point on a LRAC curve
it represents the lower possible cost per unit that a firm in the industry can achieve in the long run
Internal economies of scale
Occurs as a result of the growth in the sale of production within the firm
external economies of scale
occur when there is an increase in the size of the industry in which the firm operates
The firm is able to benefit from lower LRATC generated by factors outside of the firm
conditions for profit maximisation
MC=MR
profit
TR- TC
Normal profit
TR = TC
Supernormal profit
TR > TC
SR shut down point
In the short-run, if the selling price (average revenue) is higher than the average variable cost (AVC), the firm should keep producing (AR > AVC)
If the selling price (AR) falls to the AVC it should shut down (AR = AVC)
The firm produces at the profit maximisation level of output (Q) where MC=MR
At this level, the P = AVC
This means that there is no contribution towards the firm's fixed costs
The selling price literally only covers the cost of the raw materials used in production
There is no point in continuing production and the firm should shut down

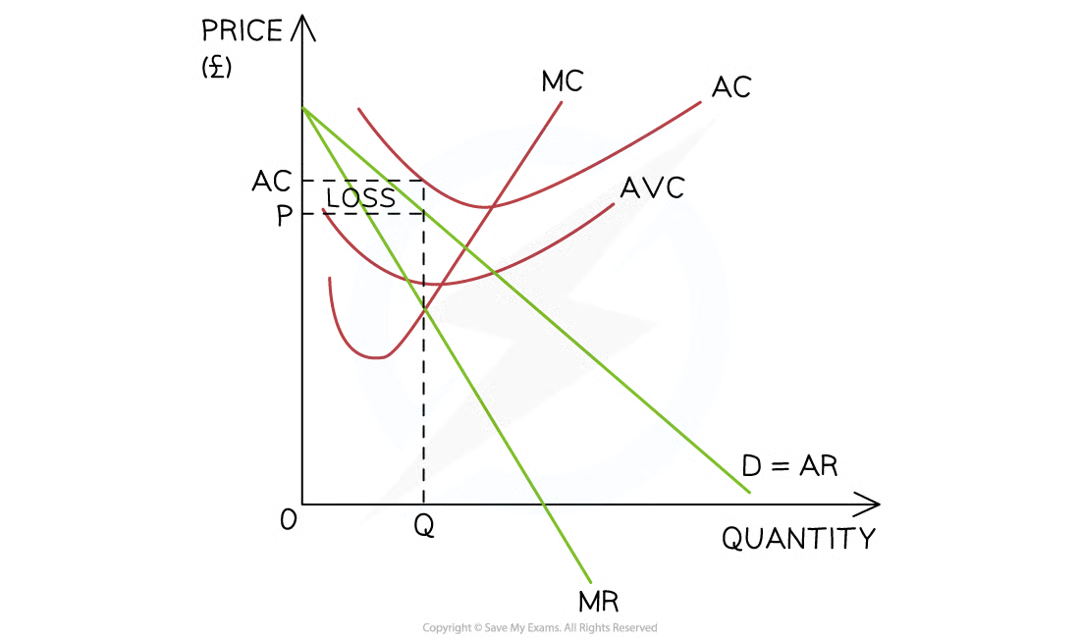
LR shut down point
In the long-run, if the selling price (AR) is higher than the average cost (AC) the firm should remain open (AR > AC)
if the selling price (AR) is equal to or lower than the average cost (AC), the firm should shut down (AR = AC)
The firm produces at the profit maximisation level of output (Q) where MC=MR
At this level, P < AC
It could continue operating in the short-run as the AR > AVC, but in the long-run they are making a loss and the firm will shut down