Quiz 2 (+ standard deviation notes )
1/35
There's no tags or description
Looks like no tags are added yet.
Name | Mastery | Learn | Test | Matching | Spaced | Call with Kai |
|---|
No study sessions yet.
36 Terms
__ are the only method that can be used to prove causation between 2 variables
Experiments
Negatives to experiments
Results might not be able to be generalized to the real world
other variables might play a role in the results ( confounding variables )
Causal relationship
Causation/ Cause and effect
One of the main reasons experiments are used is to prove
causation
Experiment set up
Experimental group receives IV
control receives no change or placebo
Group members need to be randomly assigned ( Equal chance to be placed in each group p)
Double blind study ( neither participants or research know who is receiving the IV
Confounding Variables
Any other variables that might affect the experiment
Researchers try to control these
Ways to reduce bias in a experiment ( list and explain )
Random Assignment
SIngle Blind: reduces participant bias by not telling them which group they are in
Double blind: reduced bias in both participant and experimenter
Peer review : Allows independent peers to help identify potential sources of experimental bias
Operational Definitions
Detailed definition of your variables to clearly indicate how to measure or quantitfy a concept.
Ex: “Happy” is defined as 5 smiles per 30 minutes.
Naturalistic Observation (explanation + pros and cons )
Descriptive method of serving in participants natural environment
Pros : no side effects or responsibility or managing controlled environment because shows in natural environment
Negative: cannot explain behavior ( because cannot interact with a participant ) AND subjects may act differently if they know they are watched
Case Study( explanation + pros and cons )
Descriptive research where detailed information is gathered over time on a specific individual or small group
Pros : In depth information AND interaction is allowed
Negative: Cannot assume a finding is true for all people BECAUSE of the small experimental group ( GENERALIZATION ) AND often time consuming
Meta-Analysis ( Explanation + Pros and Cons )
Statistical procedure for analyzing the results from 2 + separate studies to reach an overall conclusion
Pros: Increase precision in findings AND can settle controveries/conflicting claims
Negatives: not using new information and may be missing potentially useful information from original research if not reported ( something may not be relevant to original study but is relevant to meta analysis )
Correlation Study ( Explanation + Pros and Cons )
Looking at 2 variables to see if there is a statistical connection/relationship
You can gather data from any of the other types of research
Positive: Correlation proves some sort of relationship ( or lack thereof ) statistically
Negatives: CORRELATION DOES NOT PROVE CAUSATION ( OTHER FACTORS COULD BE AT PLAY )
Correlation Coefficient ( definition, important things to note )
Shows the type of relationship and strength between 2 variables
-1.0 = strongest NEGATIVE relationship ( Inverse relation )
0 = no relation
+1.0 = strongest POSITIVE ( direct )
When looking at strength of correlation coefficient, ignore the sign at look at if the number is closest to 1
Graph data on a scatter plot
1 variable on x axis and 2 variables on y axis
What is the strongest strength based on correlation coefficient ?
A ) + 0.6 B) -0.85 C)+ 0.2 D) -0.9
D, because it is the closest to 1 when you only look at magnitude
Ex Post Facto
( after the fact ) , looking back at something after the fact
Longitudinal Study
Looks at the same group of people at different points of their lives ( takes many years )
Cross Sectional
Looks at people at a variety of ages all at the same time ( only happens at one period in time )
Survey
collect attitudes, optionion, or behaviors by asking questions to a representative sample of a certain population
How to pick a simple for a survey?
Identify relevant populations
Random Selections ( every member of population has an equal chance of being chosen )
Survey concerns ( List and Explanations )
Self-reporting Bias : People give inaccurate answers often due to social desirability
Sampling Bias : Flaw in sampling skews data
Framing: the wording used for questions influence the interpretation and response to them
All research must pass a review conducted by…. to determine..
Institutional Review Board ( IRB ) to determine whether or not the study is ethical and poses a risk to those involved before it is conducted
In research specific criteria must be followed as set by the
American Psychology Association
Goals of ethical guidelines ( 3 )
Ensure benefits outweigh risks
Maintain concern and respect for well being and autonomy of individuals
Ensure fair procedures
Ethics codes ( 5 )
Obtain voluntary informed consent ( includes option to withdraw, for minors they give ASSENT )
Protect participants from unnecessary harm of discomfot
Protect confidentiality of all participants
Debrief individuals afterward ( explain results and indicate if there was any deception )
Receive approval from Institutional Review Board
Ethics for Animal Experiment ( 3 )
Provide humane conditions
minimize pain and discomfort
use anesthesia whenever possible
veterinarians must be consulted whenever using live animals
Can prove benefits of society outweigh costs ( pain on animal )
Have planned end date for study
Qualitative Research ( relies on… + example )
-Relies on in depth , narrative data ( not numbers)
Ex: Structured interviews
Quantitative Research ( Relies on… + Example )
Relies on quantifiable , numerical data
example: Likert Scale
Likert Scale
Linear or continuum scale to measure attitudes
Improve operational definitions
Strongly Disagree = (1) , Disagree ( 2 ) , Undecided ( 3) , Agree ( 4 ) , Strongly Agree ( 5 )
Measures of central tendency , ideal
Mean , median, and mode.
Ideally these are all the same number to get the standard bell curve standard deviation
When scores are closer in range, the standard deviation curve …
will appear skinnier / taller and have a smaller standard deviation
When scores are more spread out the curve..
will be shorter/fatter and have a larger standard deviation
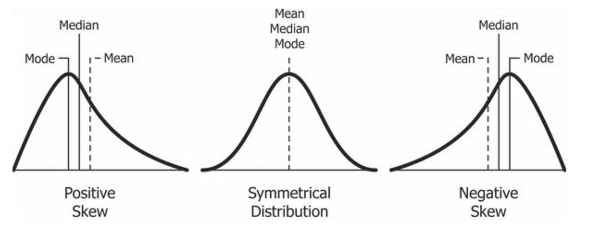
Normal vs skewed distribution ( explanation , not a list of skewed distribution )
Normal = mean , median, and mode are all this ame
Skewed = extreme scores or when mean median and mode are not the same value
When it comes to skewed Distribution , the __ is a better measure of central tendency than the _
Median, mean
Types of skewed Distributions
Positive
Group has one high score and it contains more low scores
Negative
One low outlier and there is more high scores
Bimodel Distribution
2 different values appear most frequently in the data set
AKA 2 diff modes
creates a 2 hump curve
