AP Human Geography (Unit 1)
 Call Kai
 Learn
Learn Practice Test
 Spaced Repetition
 Match
Match Flashcards
 Knowt Play
1/19

There's no tags or description
Looks like no tags are added yet.
Name | Mastery | Learn | Test | Matching | Spaced | Call with Kai | Chat |
|---|
No analytics yet
Send a link to your students to track their progress
20 Terms
Absolute Direction
A compass direction that measures miles and kilometers
Relative Direction
A direction using terms like left, right and forward integrated from abstract, cultural, and economic ideas
Spatial perspective
a way of looking at the world to make sense of how we use space — explains why things happen where they are
Spatial patterns
Similarities between arrangements of objects on Earth’s surface
Clustered
Grouped closely together
Dispersed
Spread out
Reference maps
Contain general data like political (States, countries), physical, and road data.
Toponyms
Place names (I.e Memphis or Philadelphia)
Types of Distortions
Shape, Relative Size, Distance, and Direction distortions

Mercator Projection
A map created in 1569 that is rectangular in nature and very distorted when it comes to European countries and the Atlantic Ocean
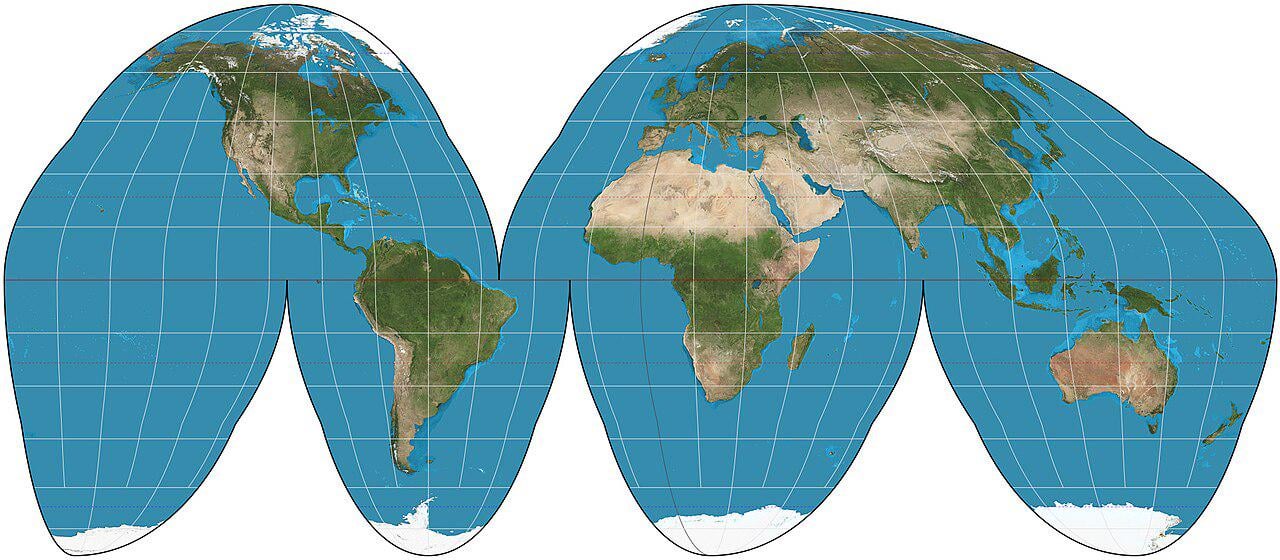
Goode-Homolosine projection
Look like if you peeled a globe and put it flat lol

Robinson Projection
A compromise between the Mercator and Peters projection that has slight distortion but overall favorable
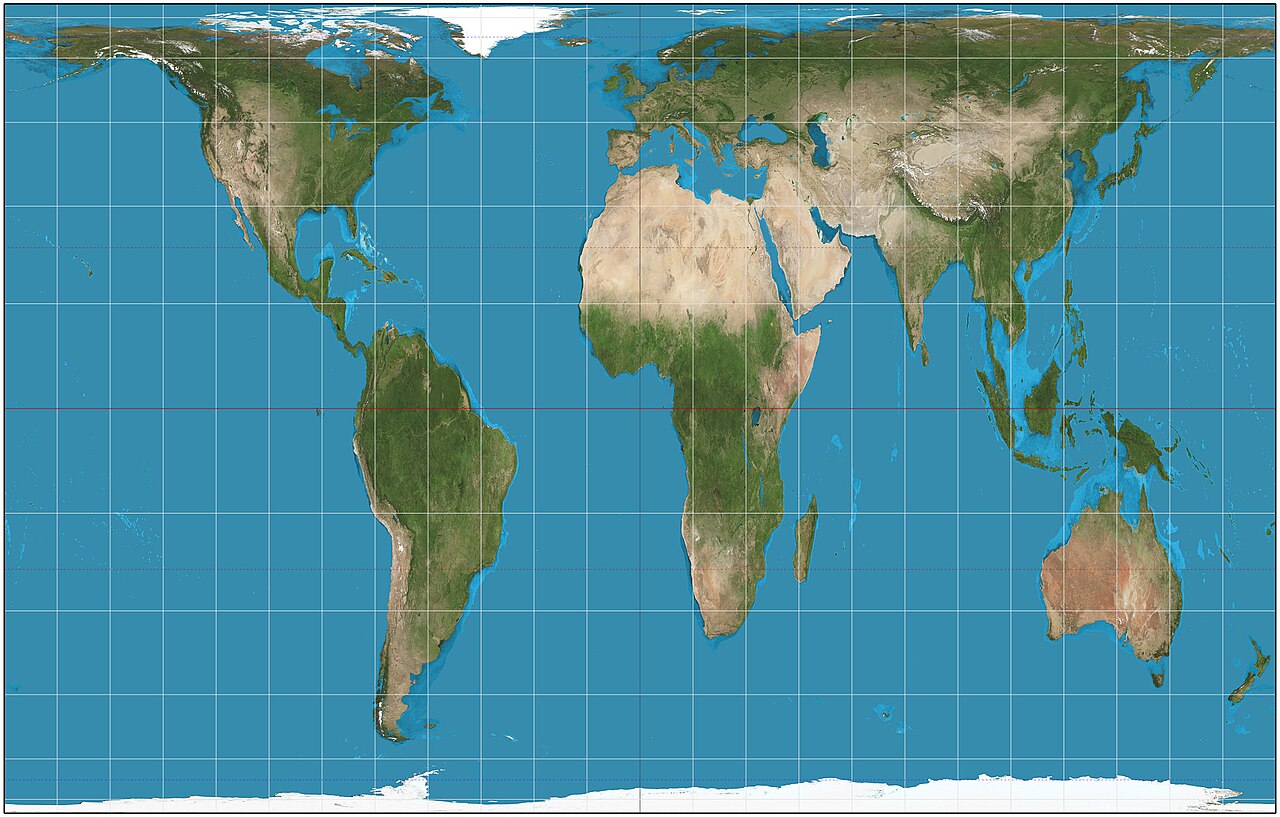
Peters Projection
A world map where landmasses relative sizes are accurate, however, other elements like distance and size are distorted
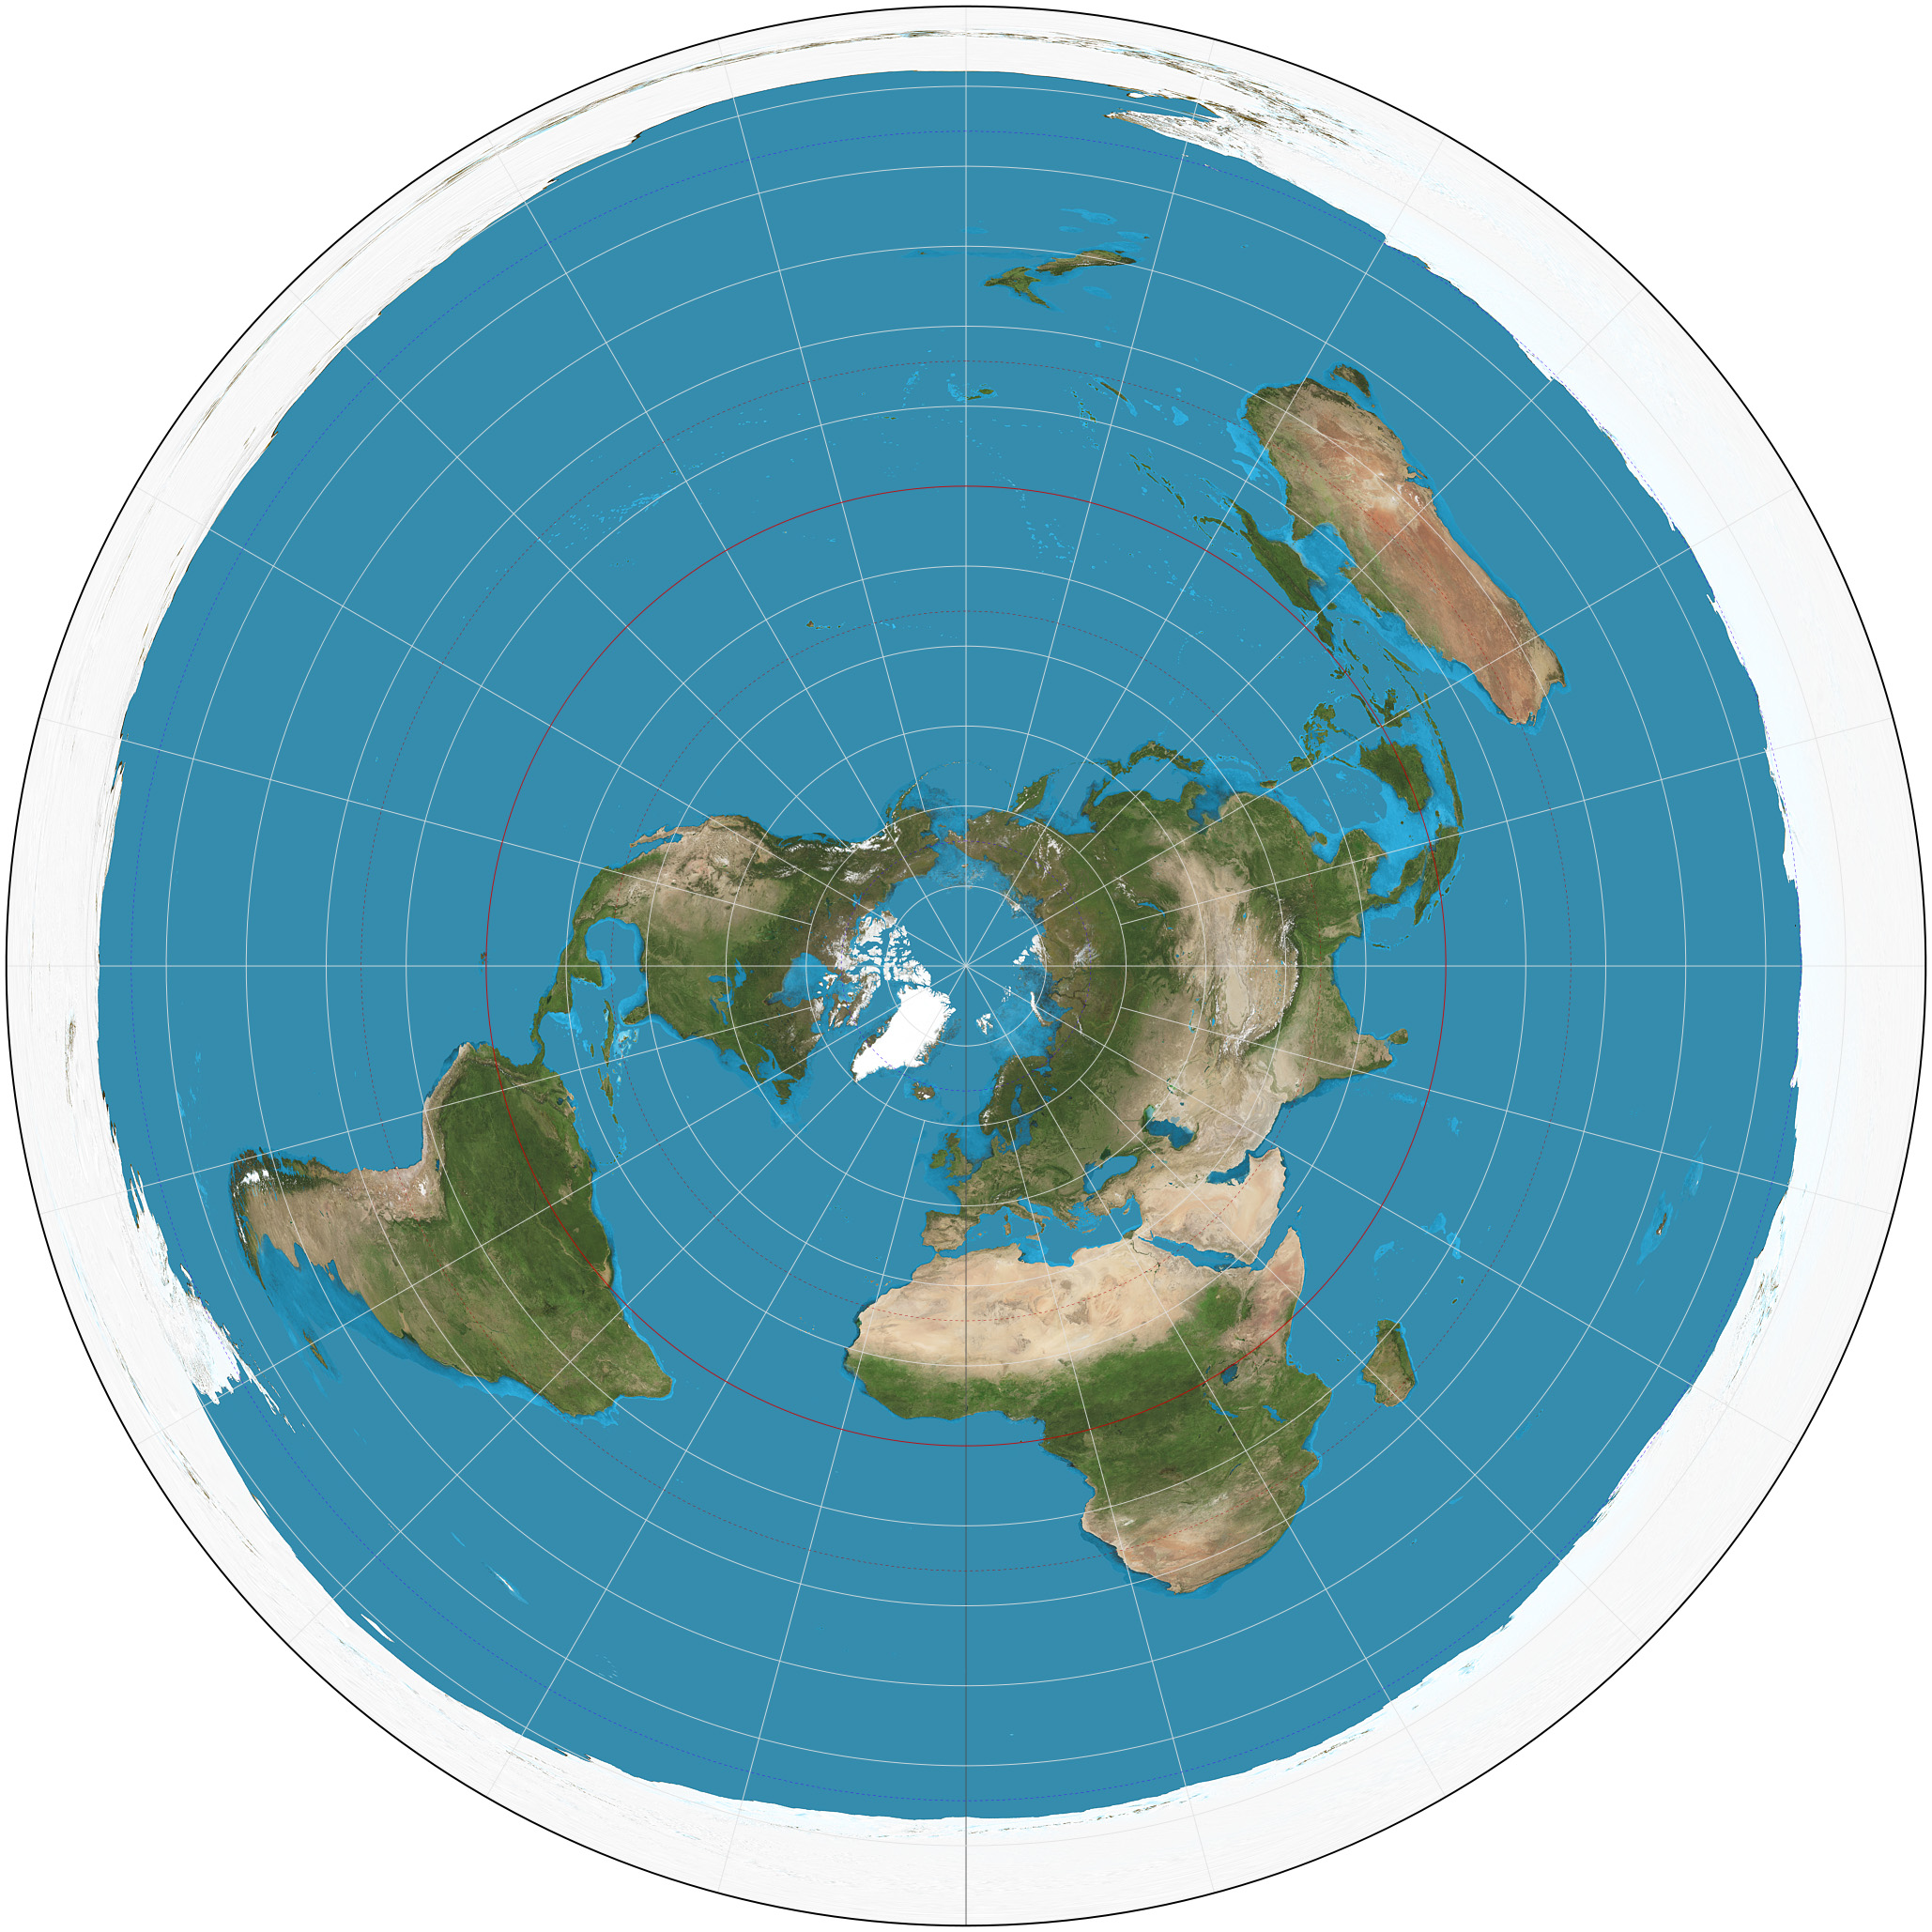
Azimuthal projection
Less common, looks a Earth from the North Pole (birds eye view map)
Thematic Maps
Focus on data representation. Though they do rely on reference maps, they take data from field observations, media reports, etc. (Think Google Maps)
Jerrymandering
drawing up election borders to help a certain candidate or party with their chance of winning
Scale of Inquiry
taking into consideration how we view something (kinda like perspective)
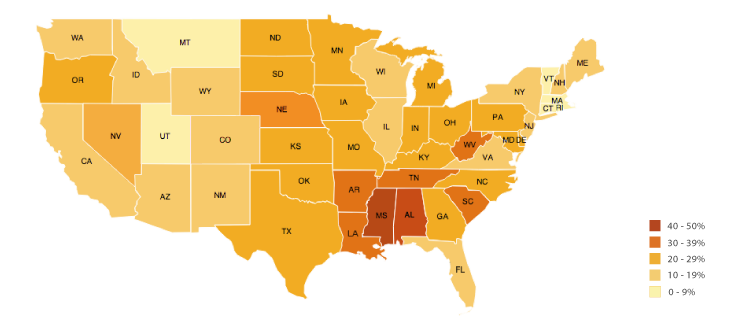
Choropleth map
uses shading or coloring to indicate the average values of variables in those areas (political maps)
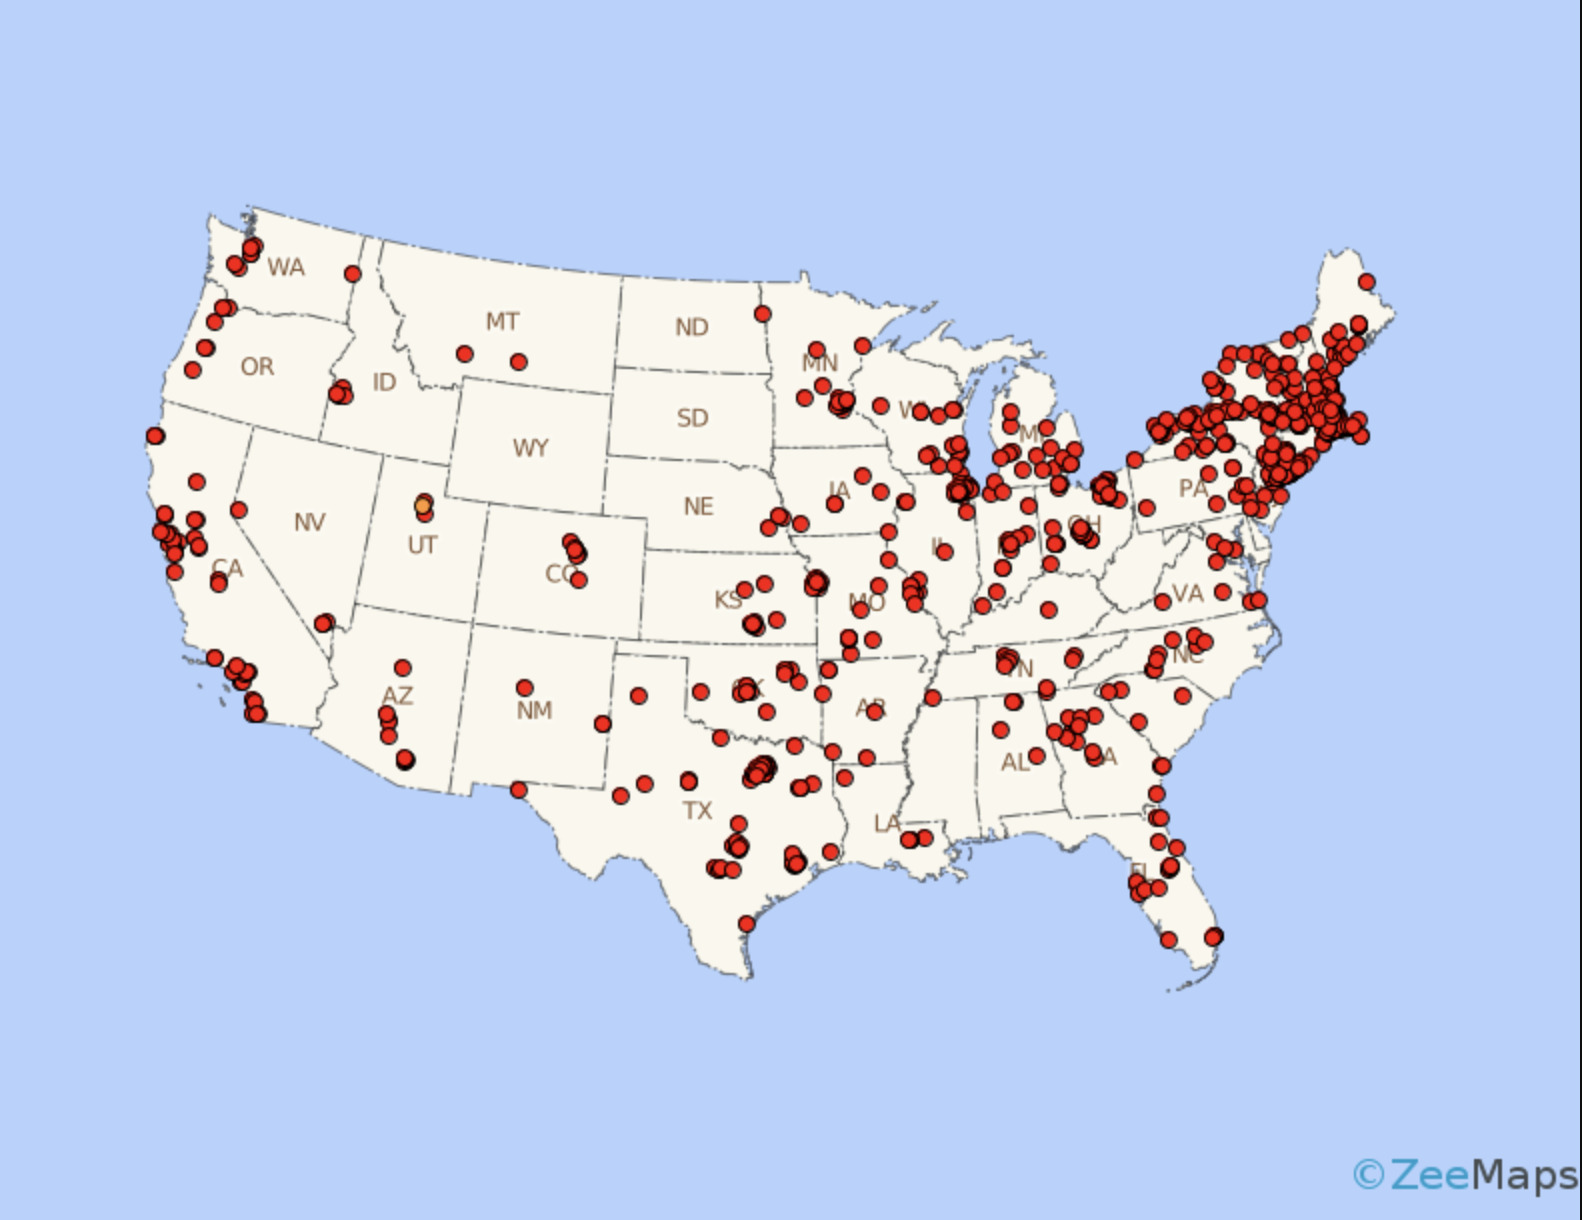
Dot Distribution Map
uses dots to indicate objects or counts (can be 1 to 1 or 1 to Many)
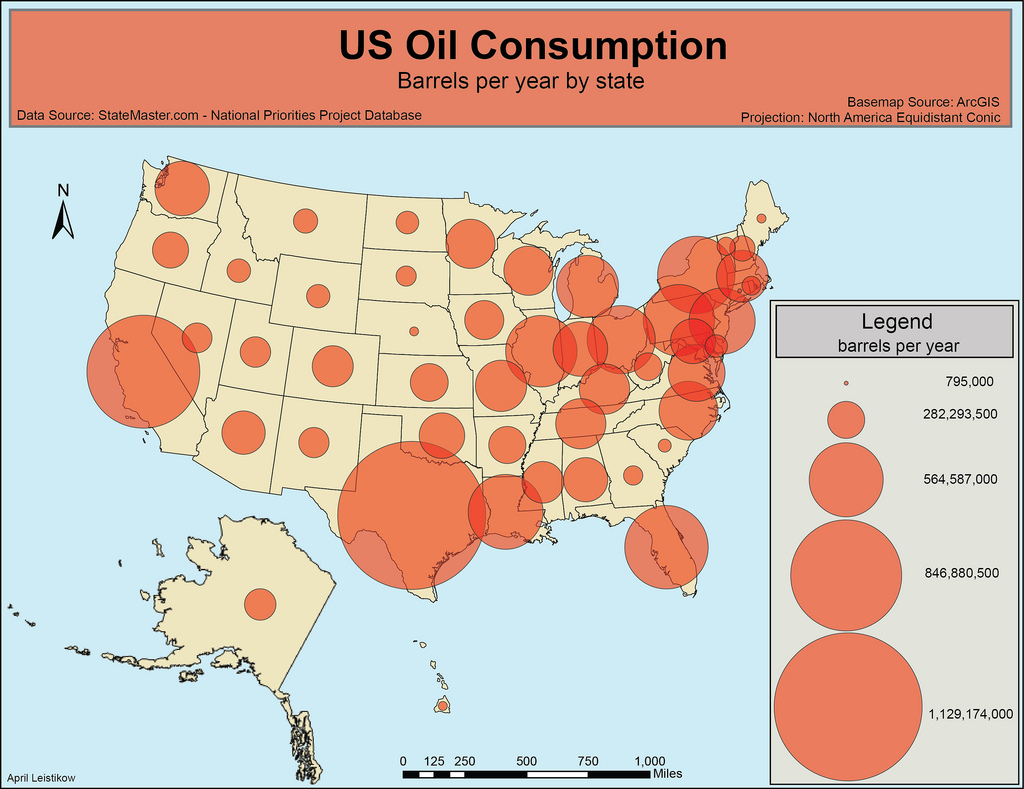
Proportional Circle Map
use circles of different sizes to represent numerical values