International B - Kyoto protocol
1/23
There's no tags or description
Looks like no tags are added yet.
Name | Mastery | Learn | Test | Matching | Spaced | Call with Kai |
|---|
No study sessions yet.
24 Terms
Post KP developments
Key nations didnt ratify / withdrew
Developing nations E increased massively
Hot air
Economies in transition (EiT) were former communist nations where economies & E crashed post cold war and USSR split
EiT given generous targets based on previous economy capacity (targets above current E) - could choose target year so chose target when economy booming
made reductions look dramatic
lots of spare Manufacturing capacity
Meant E targets non binding
EiT could trade spare capacity permits - can increase overall E produced
EU & burden sharing
Agree as bloc (of 15 members in 1997) to reduce E as a whole by 8%
Divided it among nations - burden sharing
some has E increase as a target (poorer)
Germany included E.Germany so some hot air
Some nations had already started to reduce E for non CC reasons - UK coal → gas + France nuclear
Exceeded target: -11.7%
Other Annex B targets
Japan T: -6% R: +0.3%
Fukishima disaster shifted power away from nuclear
OECD T: -6%. R: -7.8%
Total T: -4% R: -22%
US T: -7% R: +12% never ratified KP
BRICS nations had major E increase during this window
Flexibility mechanism
Ways of trading E internationally to reduce cost of reaching E target / abatement
cheaper to abate abroad where MAC cheaper
May lead to nations accepting stricter targets
Flexibility mechanisms types
E trading
Joint implementation
Clean development mechanism (CDM)
E trading
At national Govt level - not project based
Assigned amount units (AAUs) - E amount each nation entitled to
Western nations reluctant to buy from hot air nations
E trading and hot air
EiT sells surplus E to nations who need extra credits
Surplus of 13bn t Co2e (over 5 years)
only 350mn / 13bn sold
often only when combined with green investment schemes (GIS)
Lots of spare AAUs carried over
Joint implementation
Firm level between countries in Annex B
Additionality - project that reduces E wouldnt have taken place unless financed by foreign
F credited for E reduction abroad
AAUs converted to ERUs
JI during KP compliance period
Not much happened until near end of window
late 2012 300m credits generated in a few weeks
Only Ukraine & Russia shifting hot air
Clean development mechanisms
Firm level between Annex B & non-Annex B
Stricter rules than under JI as outside of Annex B - so no E target in these nations
E reduction must be certified (CERs)
additionality + real/measurable LR impact
High D for firms in EU ETS
CERs
Temporary (tCERs) given for afforestation
1.5bn tCO2e CERs generated
>7,500 projects in 90 countries
Additionality rules tightened
CERs caveat
Production of HCFCs created byproduct which had no commercial use but was very polluting
Factories could get a big income from destroying it from CERs trading
Factories would produce a lot just to destroy it for the CERs trading revenue
Eventually banned
Compliance / carry-over
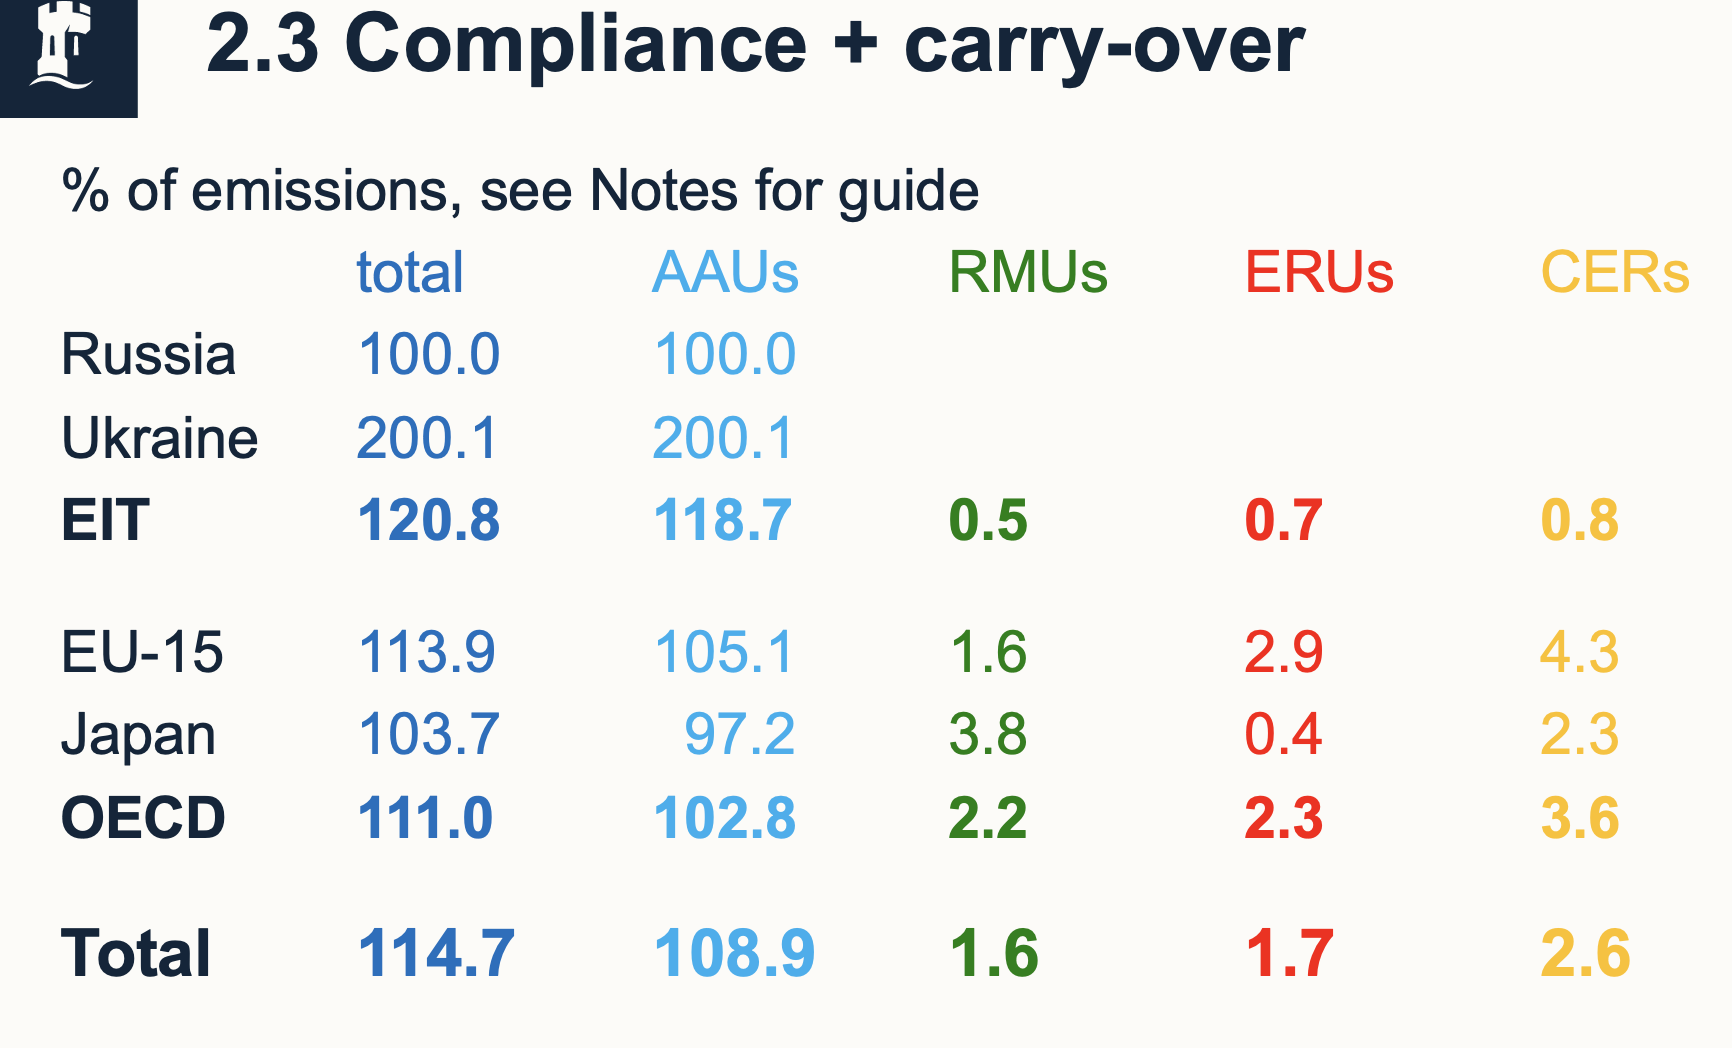
Any surplus could be carried over
AAUs > 100 - carry over E as spare from target
Effectiveness of KP
Annex B who stayed in KP reduced E more than target collectively
Almer & Winkler (2017) - effectiveness of KP OV
Used synthetic control to find good counterfactual to annex B group
non annex B nations + US states
Treatment group - 15 larger Annex B nations
small nations acn have larger swings in E
Excluded EiT as non binding from hot ait
Almer & Winkler (2017) - effectiveness of KP RESULTS
Deviation from Synthetic control counterfactual - not sig effect of KP
Comparing with just US states - some sig effects
Both +ve & -ve
E increases in some nations compared to counterfactual
NO EVIDENCE THAT KP REDUCED E
Almer & Winkler (2017) - effectiveness of KP - Robustness checks
Change tratement yr
1997 adoption vs 2004 ratified
hardly any difference
Alternative dependent variables
Co2 pc / GHGs / Co2/GDP
Fewer positive effects on E
Effect of Flexibility mechanisms as robustness
Decreases E in non-Annex B but increases E in Annex B
Excluding major CDM hubs:
hardly any difference
E minus credit acquisition
increase in negative effect but small as not many bought much of allowance
Using DiD as robustness check
When not controlling for pre-trends
KP caused large reduction in E
When controlling for pre-trends - needed for common trend assumption
No sig effect
Maamoun (2019) - effects of KP OV
Generalised synthetic control method - not unique synthetic control for each treated unit
Treated = 34 Annex B
included EiT + all Annex B
Included all GHG E (not just Co2)
Treatment year = 2005 (KP ratified)
Control group = Non AnnexB + US
Controls - GDP, population
Maamoun (2019) - effects of KP RESULTS
KP reduced E by 6.8% - sig at 5%
Maamoun (2019) - effects of KP robustness
Removed EU - as may have done CC policy without KP
-7% E at 10% lvl
Removed EiT - hot air
-17% E 5%
Removed main CDM hosts (80% projects)
-8.5% E 1% lvl
Controls for industrialisation
- 7.2% 1% lvl
Comparing papers
Different method + treatment year
Taking US states as control group in Maamoun still results in E reduction (-6.7%)