Geography Revision- Short Answer
5.0(3)
Studied by 18 peopleCard Sorting
1/47
Earn XP
Last updated 10:32 PM on 5/18/23
Name | Mastery | Learn | Test | Matching | Spaced | Call with Kai | Chat |
|---|
No analytics yet
Send a link to your students to track their progress
48 Terms
1
New cards
Wellbeing
Living well through access to all things needed to live long happy + healthy lives
2
New cards
Absolute poverty
A severe deprivation of basic human needs, the inability to meet a minimum standard of living.
3
New cards
Relative poverty
Lacking ability to participate in society- 50% less than the average household.
4
New cards
Low economically developed country
A country with high poverty rates, limited access to education and healthcare, and a reliance on agriculture or resource extraction industries. E.g. Afghanistan, Sudan, Cambodia
5
New cards
High economically developed country
A country that has a high standard of living, advanced technological infrastructure, and a diversified economy. E.g. US, Canada, UK
6
New cards
Newly industrialising country
A country that has recently shifted from an agricultural-based economy to a manufacturing-based one, with rapid economic growth and increasing urbanisation. E.g. China, India, Brazil.
7
New cards
Indicators
Tools used to measure wellbeing
8
New cards
Quantitative indicators
Use numerical data to assess and evaluate a particular phenomenon, such as poverty, health, education, or economic growth. E.g. GDP, poverty rate, literacy rate, and infant mortality rate.
9
New cards
Qualitative indicators
Qualitative indicators are non-numerical measures not easily calculated e.g Happiness Indexes
10
New cards
Composite indicators
Mathematical combinations of a set of indicators
11
New cards
GDP
Total monetary value of goods/services produced in countries. High GDP = USA, Japan, South Korea
12
New cards
Infant Mortality
Number of deaths in first year of life per 1000 births
13
New cards
Determiners of infant mortality
Sanitation, healthcare, education, maternal welfare, food security, access to contraception
14
New cards
HDI
* Life expectancy at birth
* Expected years of schooling
* Mean years of schooling
* GNI per capita
* Expected years of schooling
* Mean years of schooling
* GNI per capita
15
New cards
Top 3 HDI countries
Switzerland, Norway, Iceland
16
New cards
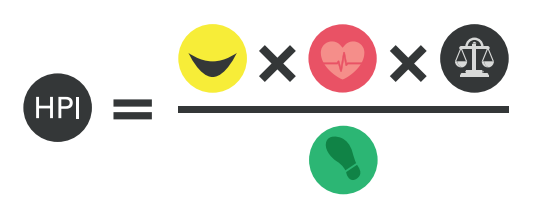
Happy Planet Index
Life satisfaction x Life expectancy x Inequality / Ecological footprint
17
New cards
Top 3 HPI
Costa Rice, Vanuatu, Colombia
18
New cards
Factors that determine life expectancy
These include access to medical care, welfare system, strong civil society and access to employment, housing, safe water, a clean environment, and education.
19
New cards
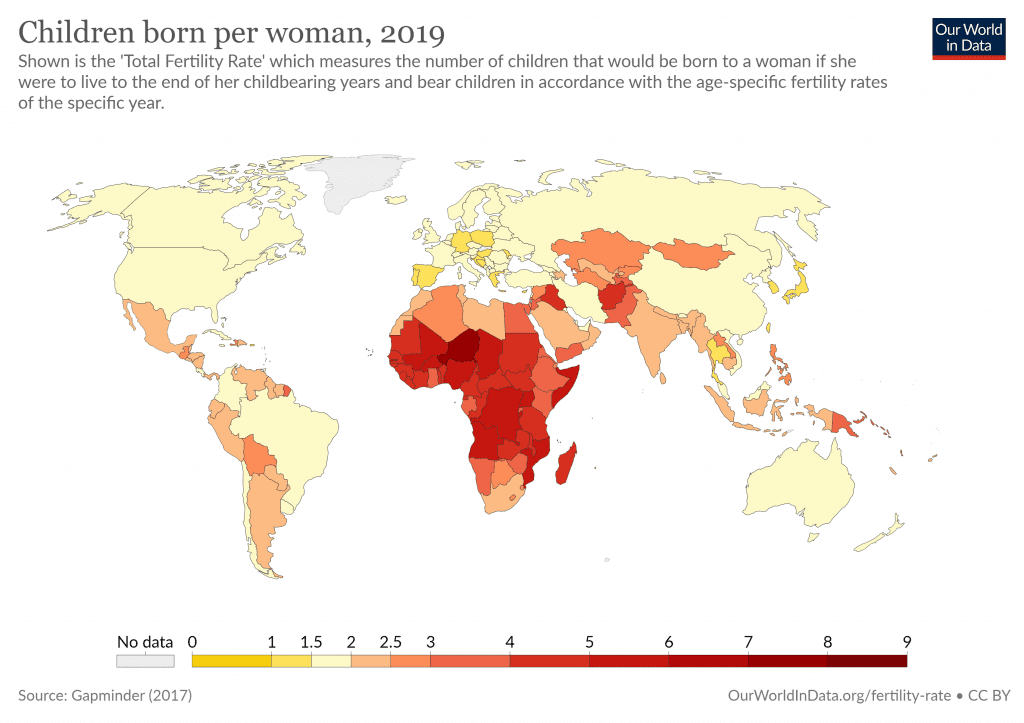
Fertility rates
Average number of children per woman of childbearing age. Global fertility rate = 2.3, just above the 2.1 replacement rate
20
New cards
Factors that determine fertility rates
Marriage, age women have first child, educational opportunities, contraception, healthcare, culture of many children, need for many children to provide
21
New cards
India location
* South Asian in Northern Hemisphere
* Cut by Tropic of Cancer
* Bordered by China, Afghanistan, Nepal, Bhutan and Pakistan
* India surrounded by Bay of Bengal
* Cut by Tropic of Cancer
* Bordered by China, Afghanistan, Nepal, Bhutan and Pakistan
* India surrounded by Bay of Bengal
22
New cards
India population
1\.419 billion
23
New cards
India population distribution
* Population pyramid is tapering off from a beehive.
* 360 million under 15
* Transitioning from a low economically developed country to a medium economically developed country
\
24
New cards
Reasons why less women than men in India
* Domestic violence and femicide
* Families prioritising the health of sons over daughters
* Women dying in childbirth
25
New cards
Why India population is expected to grow
* Women don’t have access to contraception and can’t make decisions on their own fertility
* Women do not work, this creates a a necessity for a larger family to provide for each other.
* Culture of large families in India, and this value isn’t waning like it is in other nations.
26
New cards
India HDI
132rd- medium development country
27
New cards
Inequality in India
* 456 million live on less than $1.25 a day
* 50% of children suffer from malnutrition
* 6% have access to clean running water
* 50% of children suffer from malnutrition
* 6% have access to clean running water
28
New cards
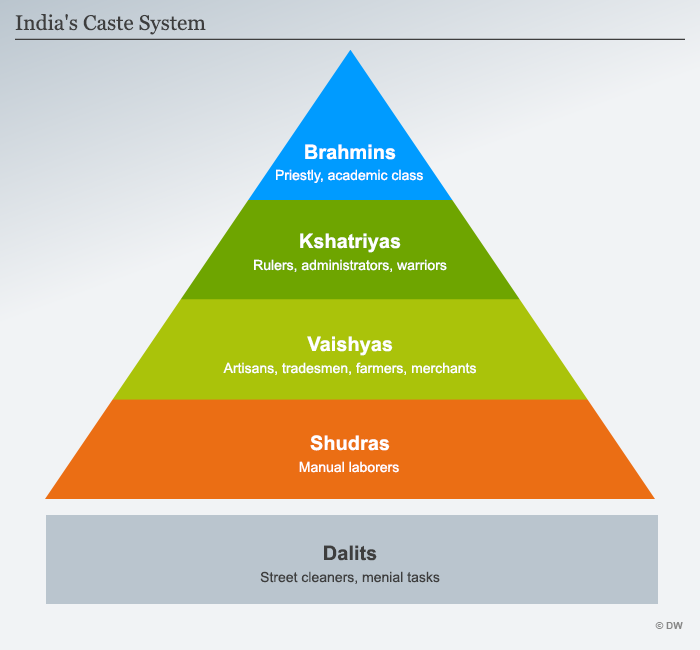
Caste system
* Hierarchical system that categorises people and communities into levels, determining their entire life.
* Unable to mix, marry and work with other castes
* Highest level= Brahmins
* Lowest level= Dalits
* Dalits clean and deal with dead bodies and are unable to lift themselves out of poverty
* System now against the law
* Unable to mix, marry and work with other castes
* Highest level= Brahmins
* Lowest level= Dalits
* Dalits clean and deal with dead bodies and are unable to lift themselves out of poverty
* System now against the law
29
New cards
Number of Dalits
160 million
30
New cards
31
New cards
Ratio of men to women in India
918 girls to 1000 boys
32
New cards
Role of women in India
* Their value only coming from birthing sons- common blessing is “may you be the mother of a hundred sons”
* Only 29% in a formalised workforce.
* Not valuable, a financial burden on the family, and are just a curse.
* Only 29% in a formalised workforce.
* Not valuable, a financial burden on the family, and are just a curse.
33
New cards
Attitude of men towards women in India
* Dehumanise women- with a strong rape culture
* See women as objects to play with
* 92% of women experience sexual violence in public places
* See women as objects to play with
* 92% of women experience sexual violence in public places
34
New cards
Infanticide in India
* Killing infants- predominantly female- now illegal
* Can’t afford to take care of daughters, huge financial burden
* Can’t afford to take care of daughters, huge financial burden
35
New cards
Dowry deaths
Acid attacks and burning to disfigure and disable women if they don’t pay an additional dowry
36
New cards
Dowry death frequency
9000 reported a year- just 10% of what is occuring
37
New cards
Those most at risk of Dowry death
* Young married women in poor rural as 40% are married before 18 years of age and 63% are illiterate
* Live with husband can often feel isolated and voiceless.
* Live with husband can often feel isolated and voiceless.
38
New cards
Menstruation in India
* Religion sees periods as impure and polluting everything a woman touches
* 80% of women using unhygienic menstrual sanitation
* Have to stay home from school or work during periods
* 80% of women using unhygienic menstrual sanitation
* Have to stay home from school or work during periods
39
New cards
Urban
An area that is densely populated and developed- cities and towns
40
New cards
Rural
Countryside- agricultural and low economically developed
41
New cards
Major change in urbanisation in 2010
50% of world’s population living in u
42
New cards
Pull factors for migration
* Healthcare
* Money
* Education
* Food
* Peace
* Money
* Education
* Food
* Peace
43
New cards
Push factors for migration
* Unemployment
* Low wages
* Crop failure
* Poor living conditions
* Few facilities
* Natural disasters
* War
* Low wages
* Crop failure
* Poor living conditions
* Few facilities
* Natural disasters
* War
44
New cards
Urbanisation in Australia
Urban population in Australia increased from 65% in 1973 to 86% in 2020
45
New cards
Where is urban growth occurring
90% of urbanisation occurring in developing world
46
New cards
Urbanisation
The population shift from rural to urban areas
47
New cards
Positive consequences of urbanisation
* Better educational opportunities
* Better economic growth
* Better health services
* Better economic growth
* Better health services
48
New cards
Negative consequences of urbanisation
* Slums
* Poor waste disposal and sanitation
* Unemployment and urban crime
* Poor environmental quality
* Traffic congestion
* Poor waste disposal and sanitation
* Unemployment and urban crime
* Poor environmental quality
* Traffic congestion