Costs,revenues and profits
1/29
There's no tags or description
Looks like no tags are added yet.
Name | Mastery | Learn | Test | Matching | Spaced |
|---|
No study sessions yet.
30 Terms
Total cost
Total Cost (TC)
TC=TFC+TVC\text{TC} = \text{TFC} + \text{TVC}TC=TFC+TVC
Where:
TFC = Total Fixed Cost
TVC = Total Variable Cost
Average total cost
ATC= TC / Q
average fixed cost
TFC / Q
Total revenue
TR=P×Q
Total revenue that is gained from all sales
Normal profit
Occurs when TR = TC (i.e. just covering opportunity costs).
Supernormal profit
Occurs when TR > TC.
Explain how PED will influence the average revenue curve of a firm
The average revenue curve is the demand curve for the firm
So, PED affects average revenue in the same way that it affects demand
Goods with more elastic demand will face an AR curve that is nearer to being horizontal
Goods with more inelastic demand will face an AR curve that is nearer to being vertical
Explain the meaning of a firm being a “price taker”
Some firms are unable to influence the market price
These firms are referred to as price takers
This is true if:
They produce a good which is similar/identical to other firms (homogeneous good)
They have an insignificant market share
Explain the meaning of a firm being a “Price setter”
A price setter is a firm with market power, meaning it can influence or determine the price of its product, rather than taking the market price as given. This is typical in imperfectly competitive markets like monopoly or oligopoly.
Unlike price takers, price setters face a downward-sloping demand curve. To sell more, they must lower the price — so they choose both the profit-maximising output (where MC = MR) and the price consumers will pay at that quantity (from the AR curve).
For example, Apple can set higher prices due to strong brand loyalty and product differentiation, which give it pricing power.
However, this power is limited by the price elasticity of demand, potential competition, and possible regulation if prices harm consumers or reduce market efficiency.
Average cost

Average variable cost

The concept of diminishing marginal productivity
Occurs in the short run
As you add increasing amounts of a variable input (often labour) to fixed inputs (capital and land) the marginal output starts to fall
Diminishing returns to labour occurs when marginal product of labour starts to fall – i.e. total output will be increasing at a decreasing rate
external economies of scale
Increases in the size of the industry or a wider change in the economy which allows firms in the industry to increase their scale
explanation of internal economies of scale
Internal economies of scale are cost advantages a firm gains as it increases production, leading to lower average costs. These come from within the firm, due to growing efficiency and specialisation.
Toyota benefits from technical economies using robotics to cut production costs.
🔹 Evaluation:
But if a firm grows too large, it may face diseconomies of scale like poor communication or inefficiency.
financial economies of scale
Explanation:
Larger firms usually have better credit ratings and are seen as less risky by lenders, so they can access loans at lower interest rates. They may also issue shares or bonds more easily.
Example:
A multinational like Unilever can borrow at lower interest rates than a small startup because it’s more financially stable and diversified.
risk bearing economies of scale
Explanation:
Large firms can spread risk across different products, markets, or regions, making them less vulnerable to a downturn in any one area.
Example:
Amazon sells a wide range of products and operates globally. If demand falls in one country or product line, it can still rely on others, reducing overall risk.
diseconomies of scale
Diseconomies of scale occur when a business grows so large that the costs per unit increase. As output rises, it is not inevitable that unit costs will fall.
Sometimes a business can get too big.
Diseconomies of scale generally occur as a result of the difficulties of managing a larger workforce.
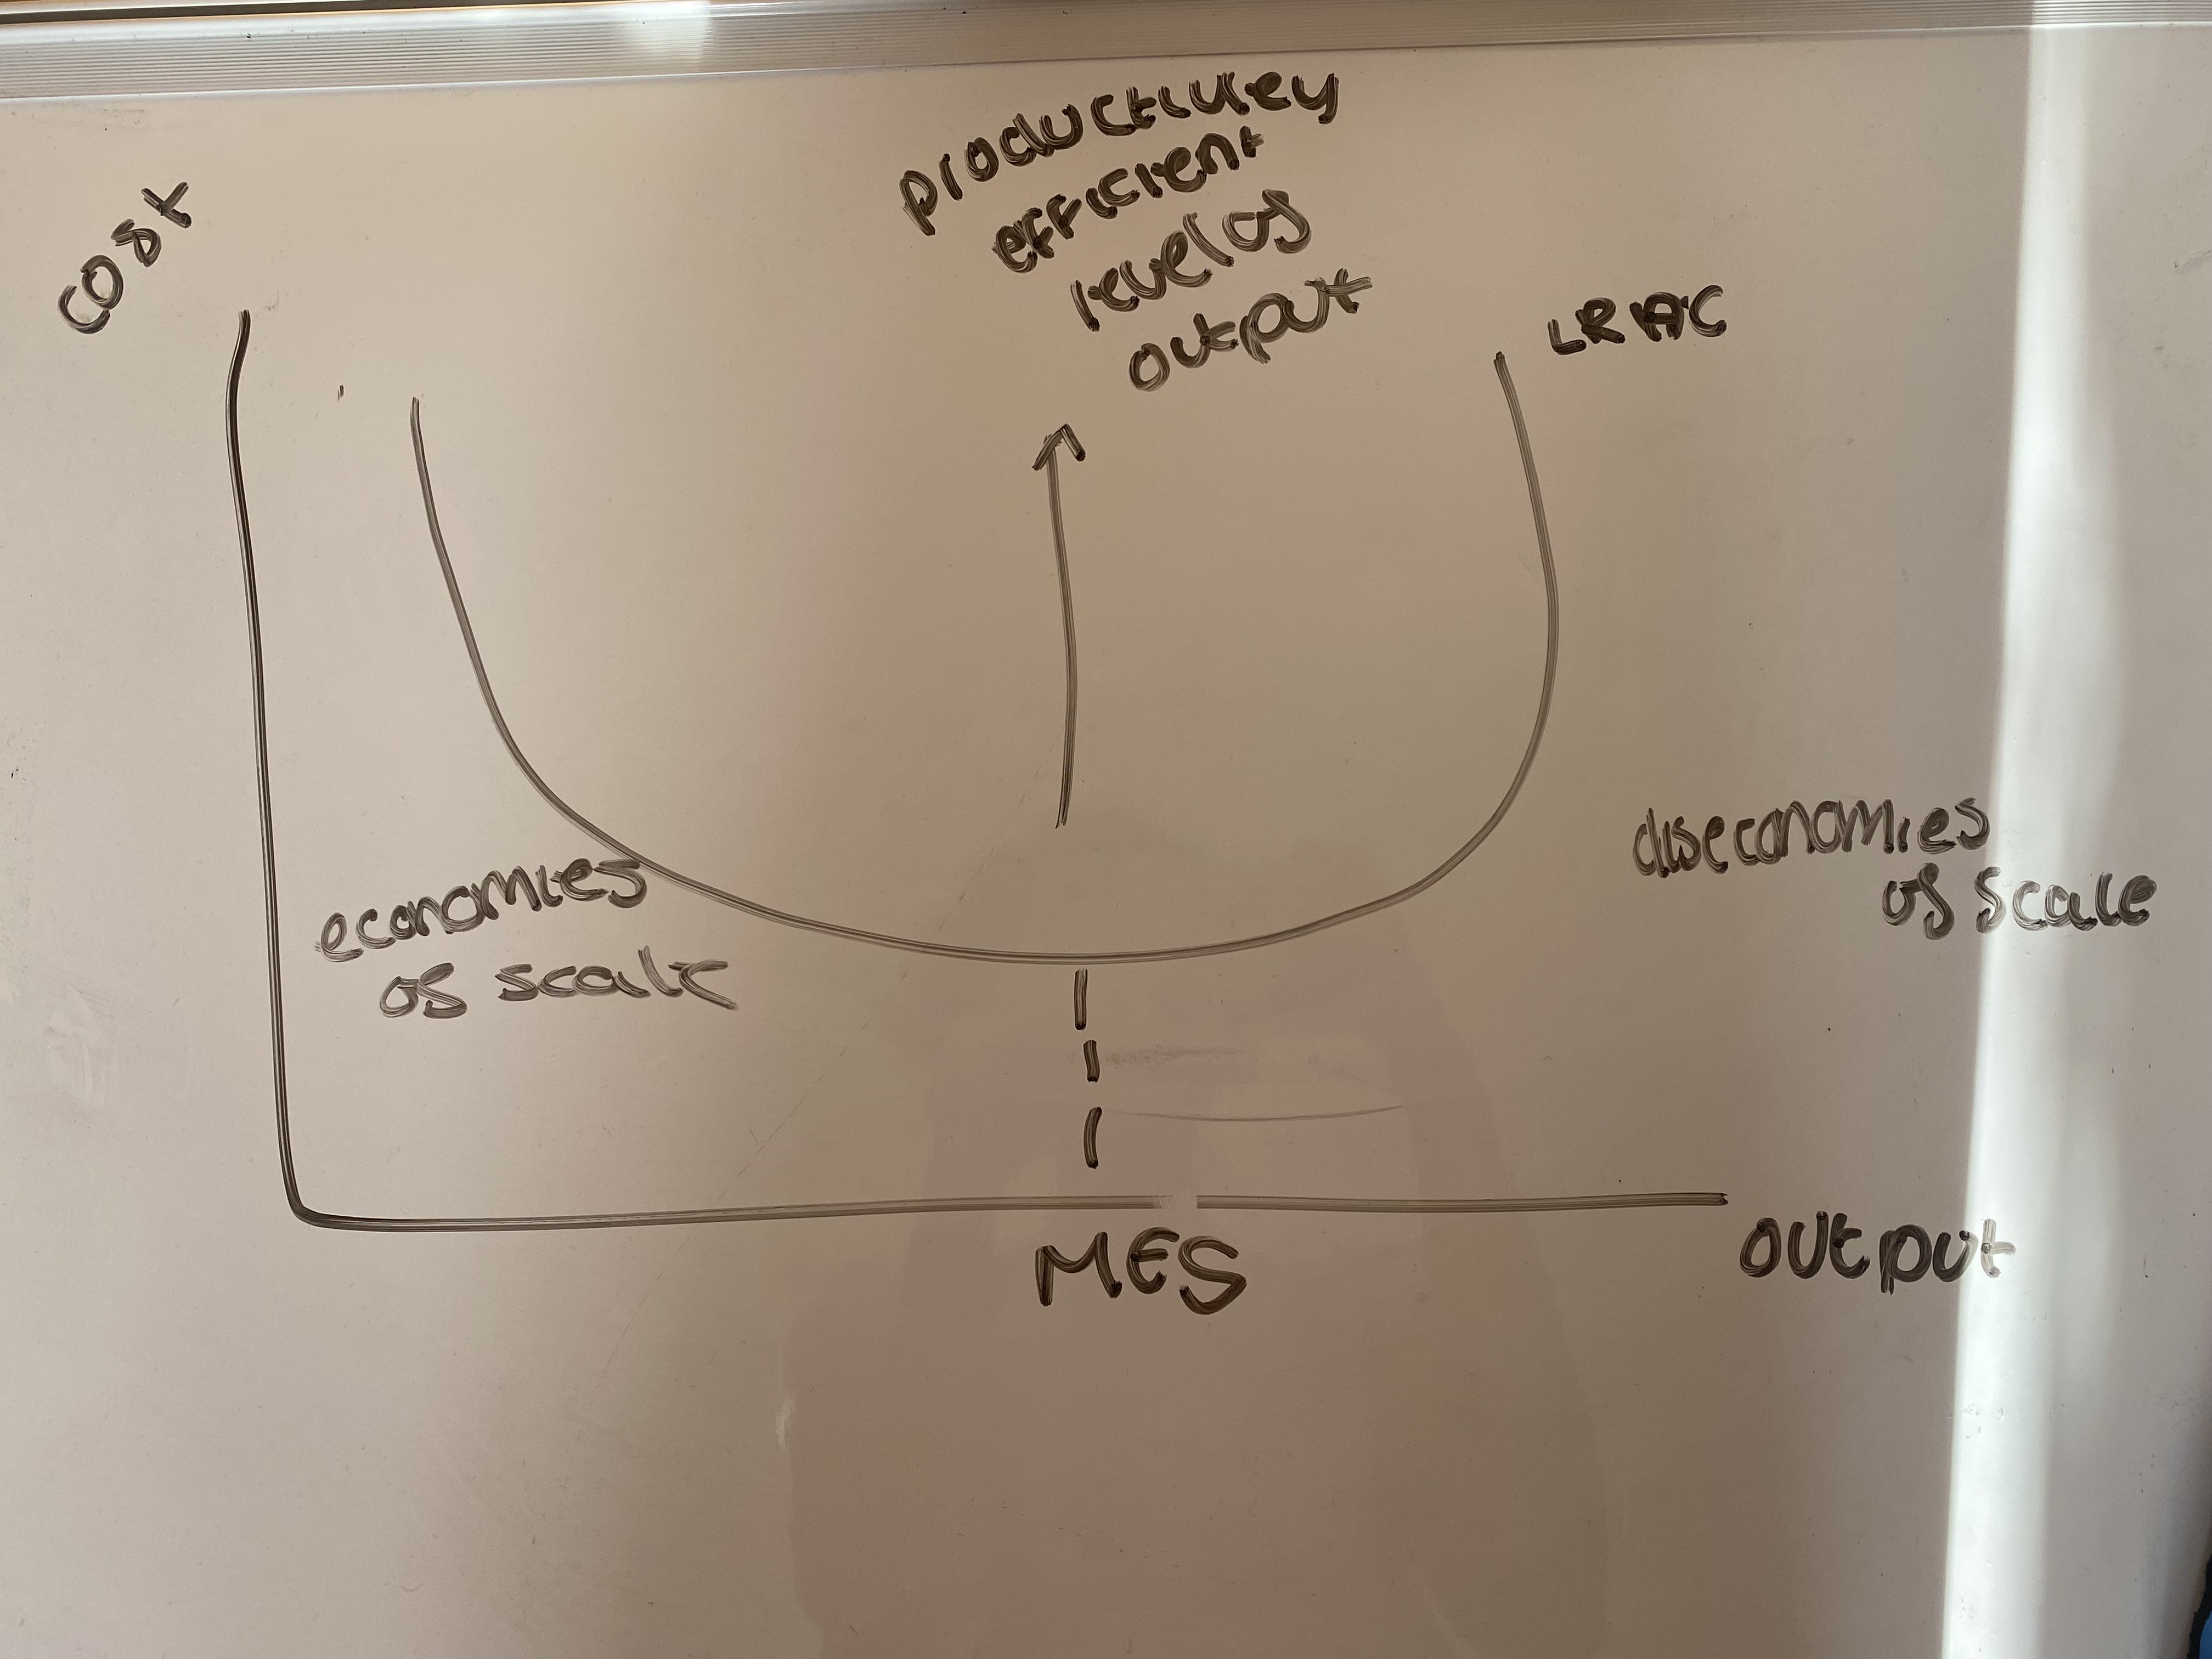
explain the concept of the minimum efficient scale of production
The minimum efficient scale is the lowest level of output at which a firm can produce at the lowest possible average cost in the long run, having fully exploited internal economies of scale.
It marks the point where the long-run average cost (LRAC) curve flattens, and further increases in output no longer reduce average costs.
🔹 Why it matters:
Determines the optimal firm size for efficiency.
In industries with a high MES (e.g. energy or steel), only a few large firms can compete efficiently — often leading to natural monopolies.
With a low MES, many small firms can operate efficiently, increasing market competition.
🔹 Example:
Car manufacturers like Volkswagen operate at high MES to spread fixed costs like R&D and machinery over millions of units.
🔹 Evaluation:
Firms below MES face higher average costs, while firms that grow too large may suffer diseconomies of scale (e.g. coordination issues).
Show on a diagram ; economies and diseconomies of scale,minimum efficient scale
Normal profit
Normal profit is the minimum level of profit required to keep a firm in its current line of production. It covers explicit and implicit (opportunity) costs, meaning the entrepreneur is earning just enough to make staying in business worthwhile.
It occurs when:
Total Revenue (TR)=Total Cost (TC)\text{Total Revenue (TR)} = \text{Total Cost (TC)} Total Revenue (TR)=Total Cost (TC)
(including opportunity cost)
In perfectly competitive markets, firms tend to make normal profit in the long run, due to free entry and exit.
Supernormal profit
Supernormal profit is any profit above normal profit — i.e., when total revenue exceeds all costs, including opportunity costs.
It occurs when:
TR>TC\text{TR} > \text{TC}TR>TC
It reflects market power, efficiency, or barriers to entry preventing new firms from competing it away.
explain the role of barriers to entry in determining whether normal or supernormal profits can be earned in the long run
Barriers to entry are obstacles that prevent new firms from entering a market easily, influencing whether existing firms earn normal or supernormal profits in the long run.
When barriers are low, new firms enter freely if supernormal profits exist, increasing supply and driving profits down to normal profits (zero economic profit). This is typical in perfect competition.
When barriers are high — like high startup costs, patents, or brand loyalty — firms can block new entrants and sustain supernormal profits indefinitely, as seen in monopolies or oligopolies.
Evaluation:
Barriers protect profits but may cause inefficiency and higher prices. However, some barriers (e.g., patents) encourage innovation by rewarding firms with temporary monopoly profits.
explain the meaning of “shut-down point”
Shut-Down Point (Condensed A*)
The shut-down point is the output and price level where a firm’s total revenue equals its total variable costs. At this point, the firm is indifferent between producing or shutting down in the short run.
If price falls below average variable cost (AVC), the firm cannot cover variable costs and should shut down to minimize losses.
If price is above AVC but below average total cost (ATC), it continues producing to cover variable costs and part of fixed costs.
🔹 Graphically:
The shut-down point is where the price equals the minimum AVC.
🔹 Evaluation:
This is a short-run decision; in the long run, if losses persist, the firm will exit the market.
Explain the conditions under which a firm would reach “shut-down point” in the long run
In the long run, a firm will shut down if it cannot cover all its costs (both fixed and variable), meaning total revenue is less than total cost, including opportunity costs.
This happens when the market price falls below the minimum point of the long-run average cost (LRAC) curve.
Persistent losses and no expected future profit make it rational for the firm to exit the market.
In perfect competition, loss-making firms exit, reducing supply and pushing prices back to normal profit levels.
🔹 Evaluation:
Long-run shut-down reflects efficient resource allocation, as unprofitable firms leave the industry.
Explain the conditions under which a firm would reach “shut-down point” in the short run
A firm reaches the shut-down point in the short run when the market price falls below average variable cost (AVC). At this point, total revenue can’t cover variable costs, so the firm minimizes losses by shutting down.
Fixed costs must be paid regardless in the short run.
If price is above AVC but below average total cost (ATC), the firm keeps producing to cover some fixed costs.
Shutdown occurs immediately if price drops below AVC.
🔹 Evaluation:
This is a temporary loss-minimizing decision; prolonged losses may lead to long-run exit.
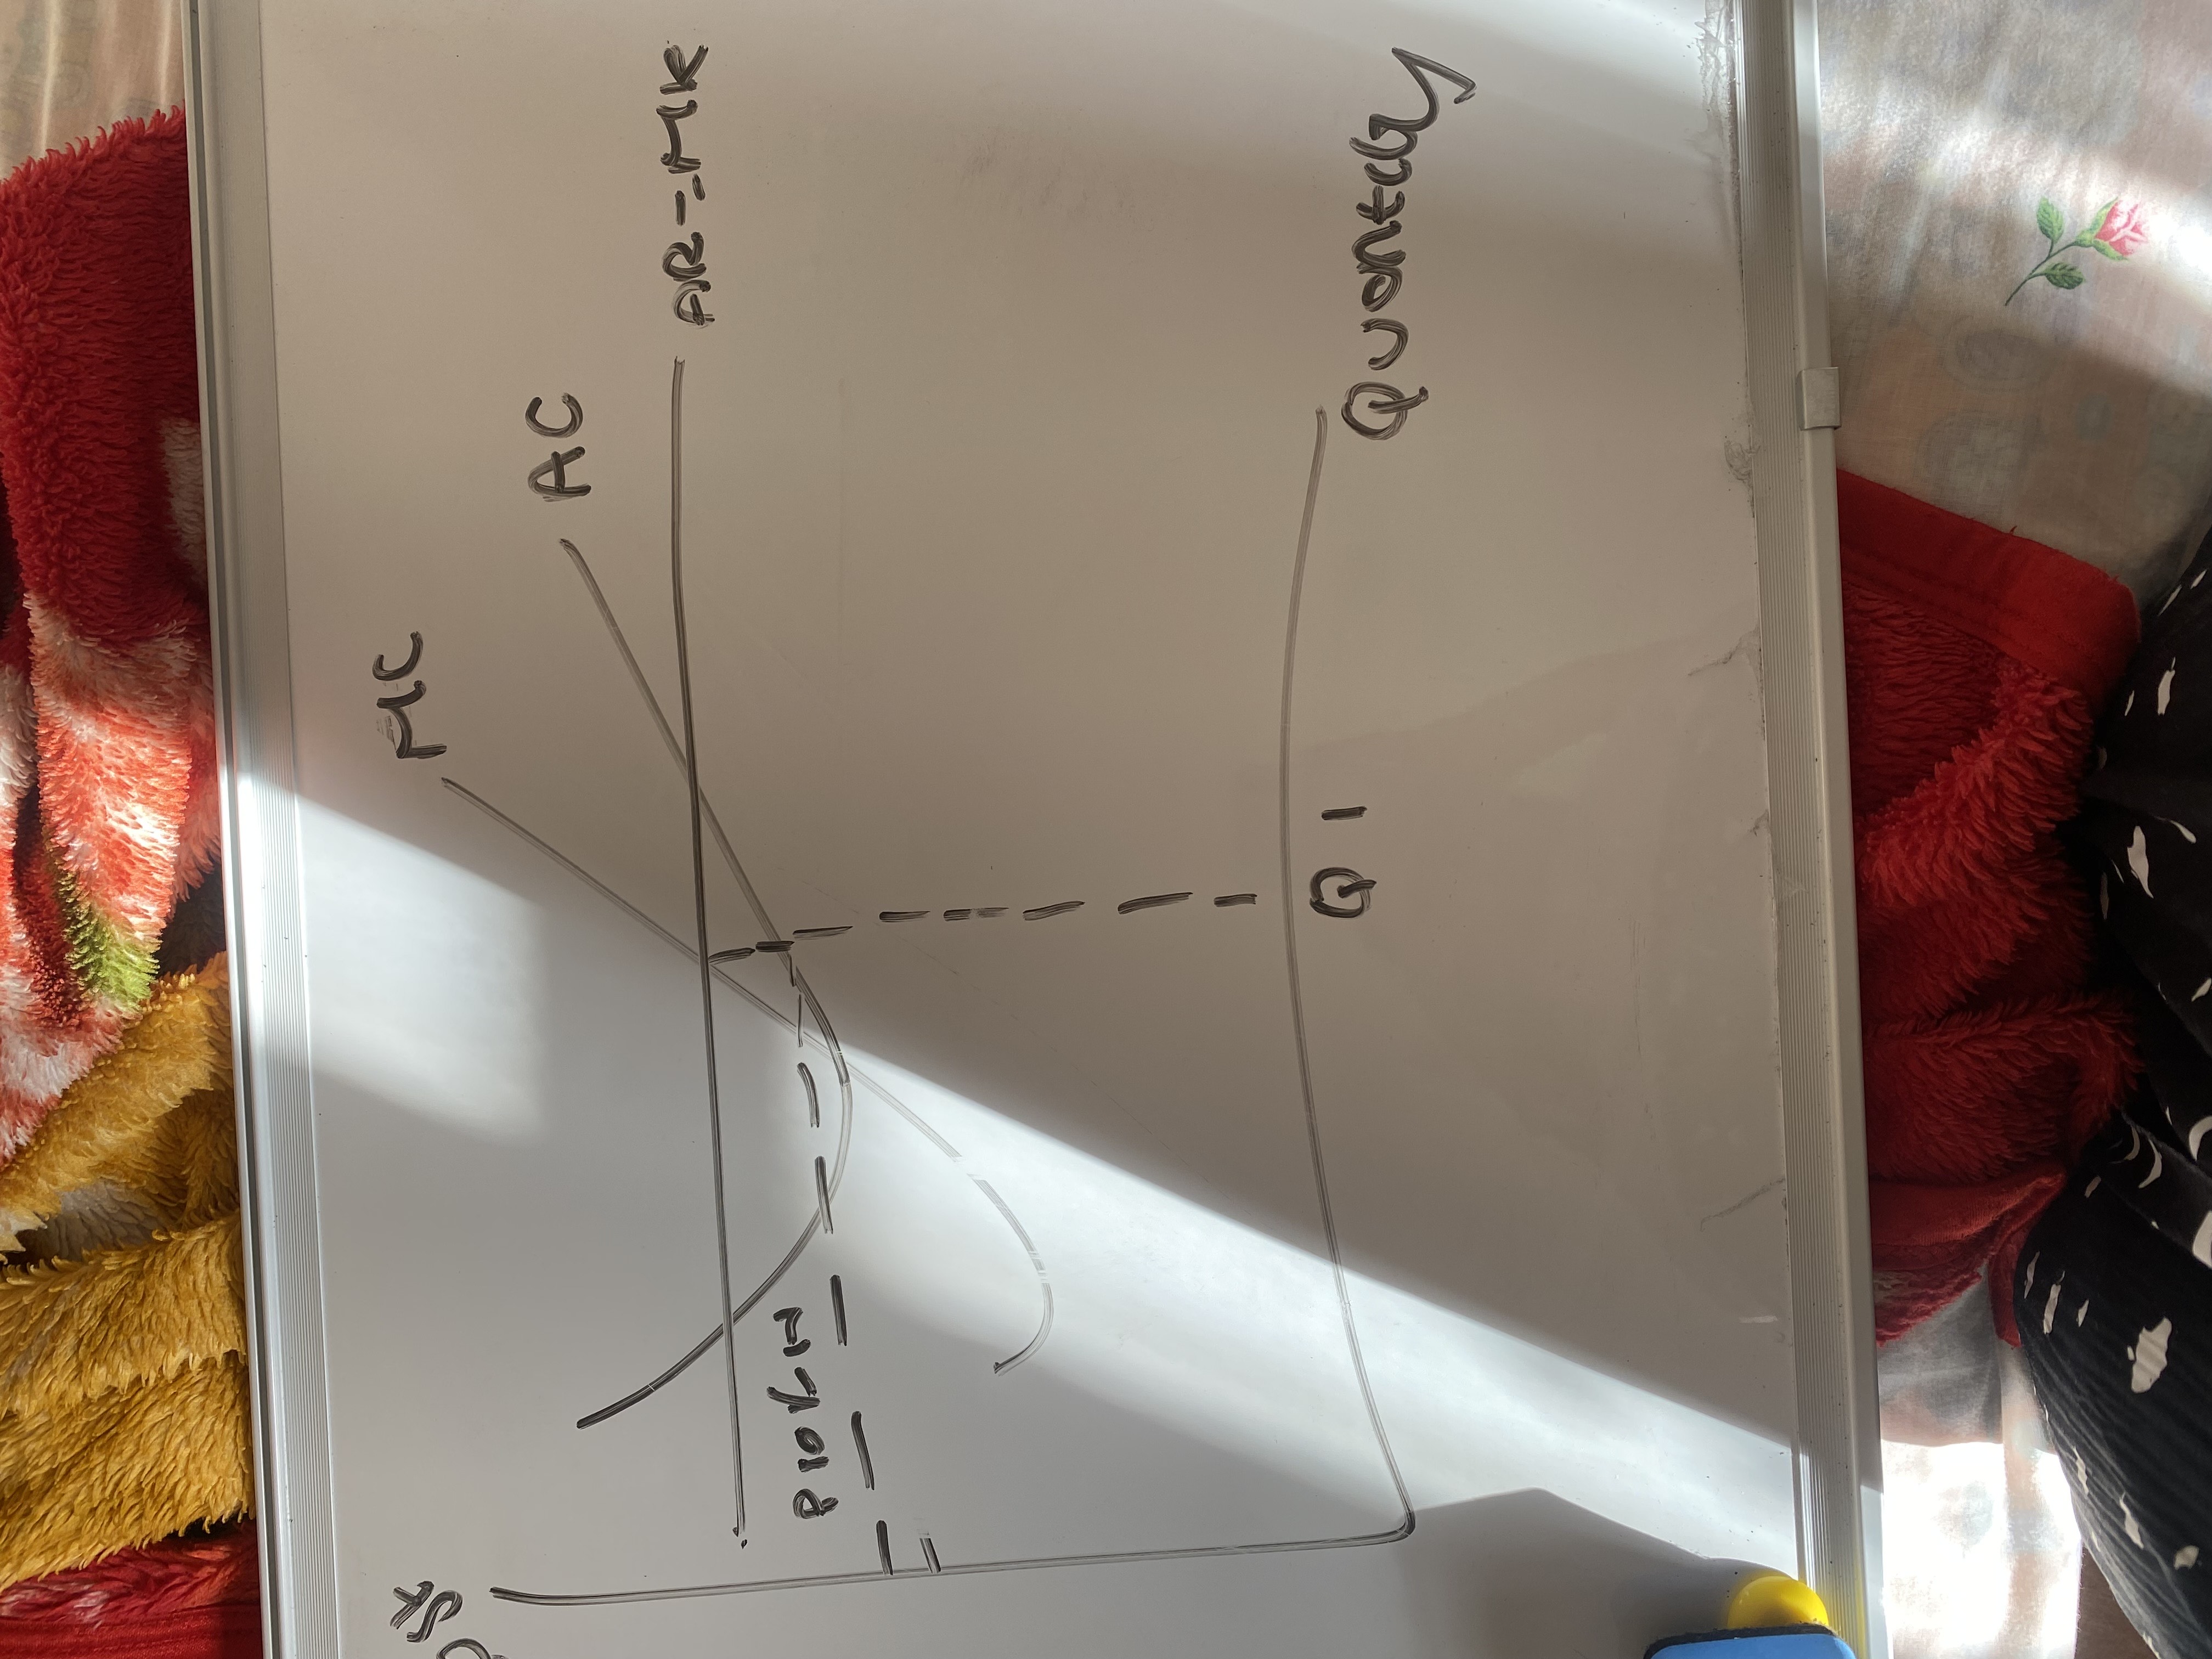
Draw a diagram showing a price taking firm making a loss but that should continue in the SR

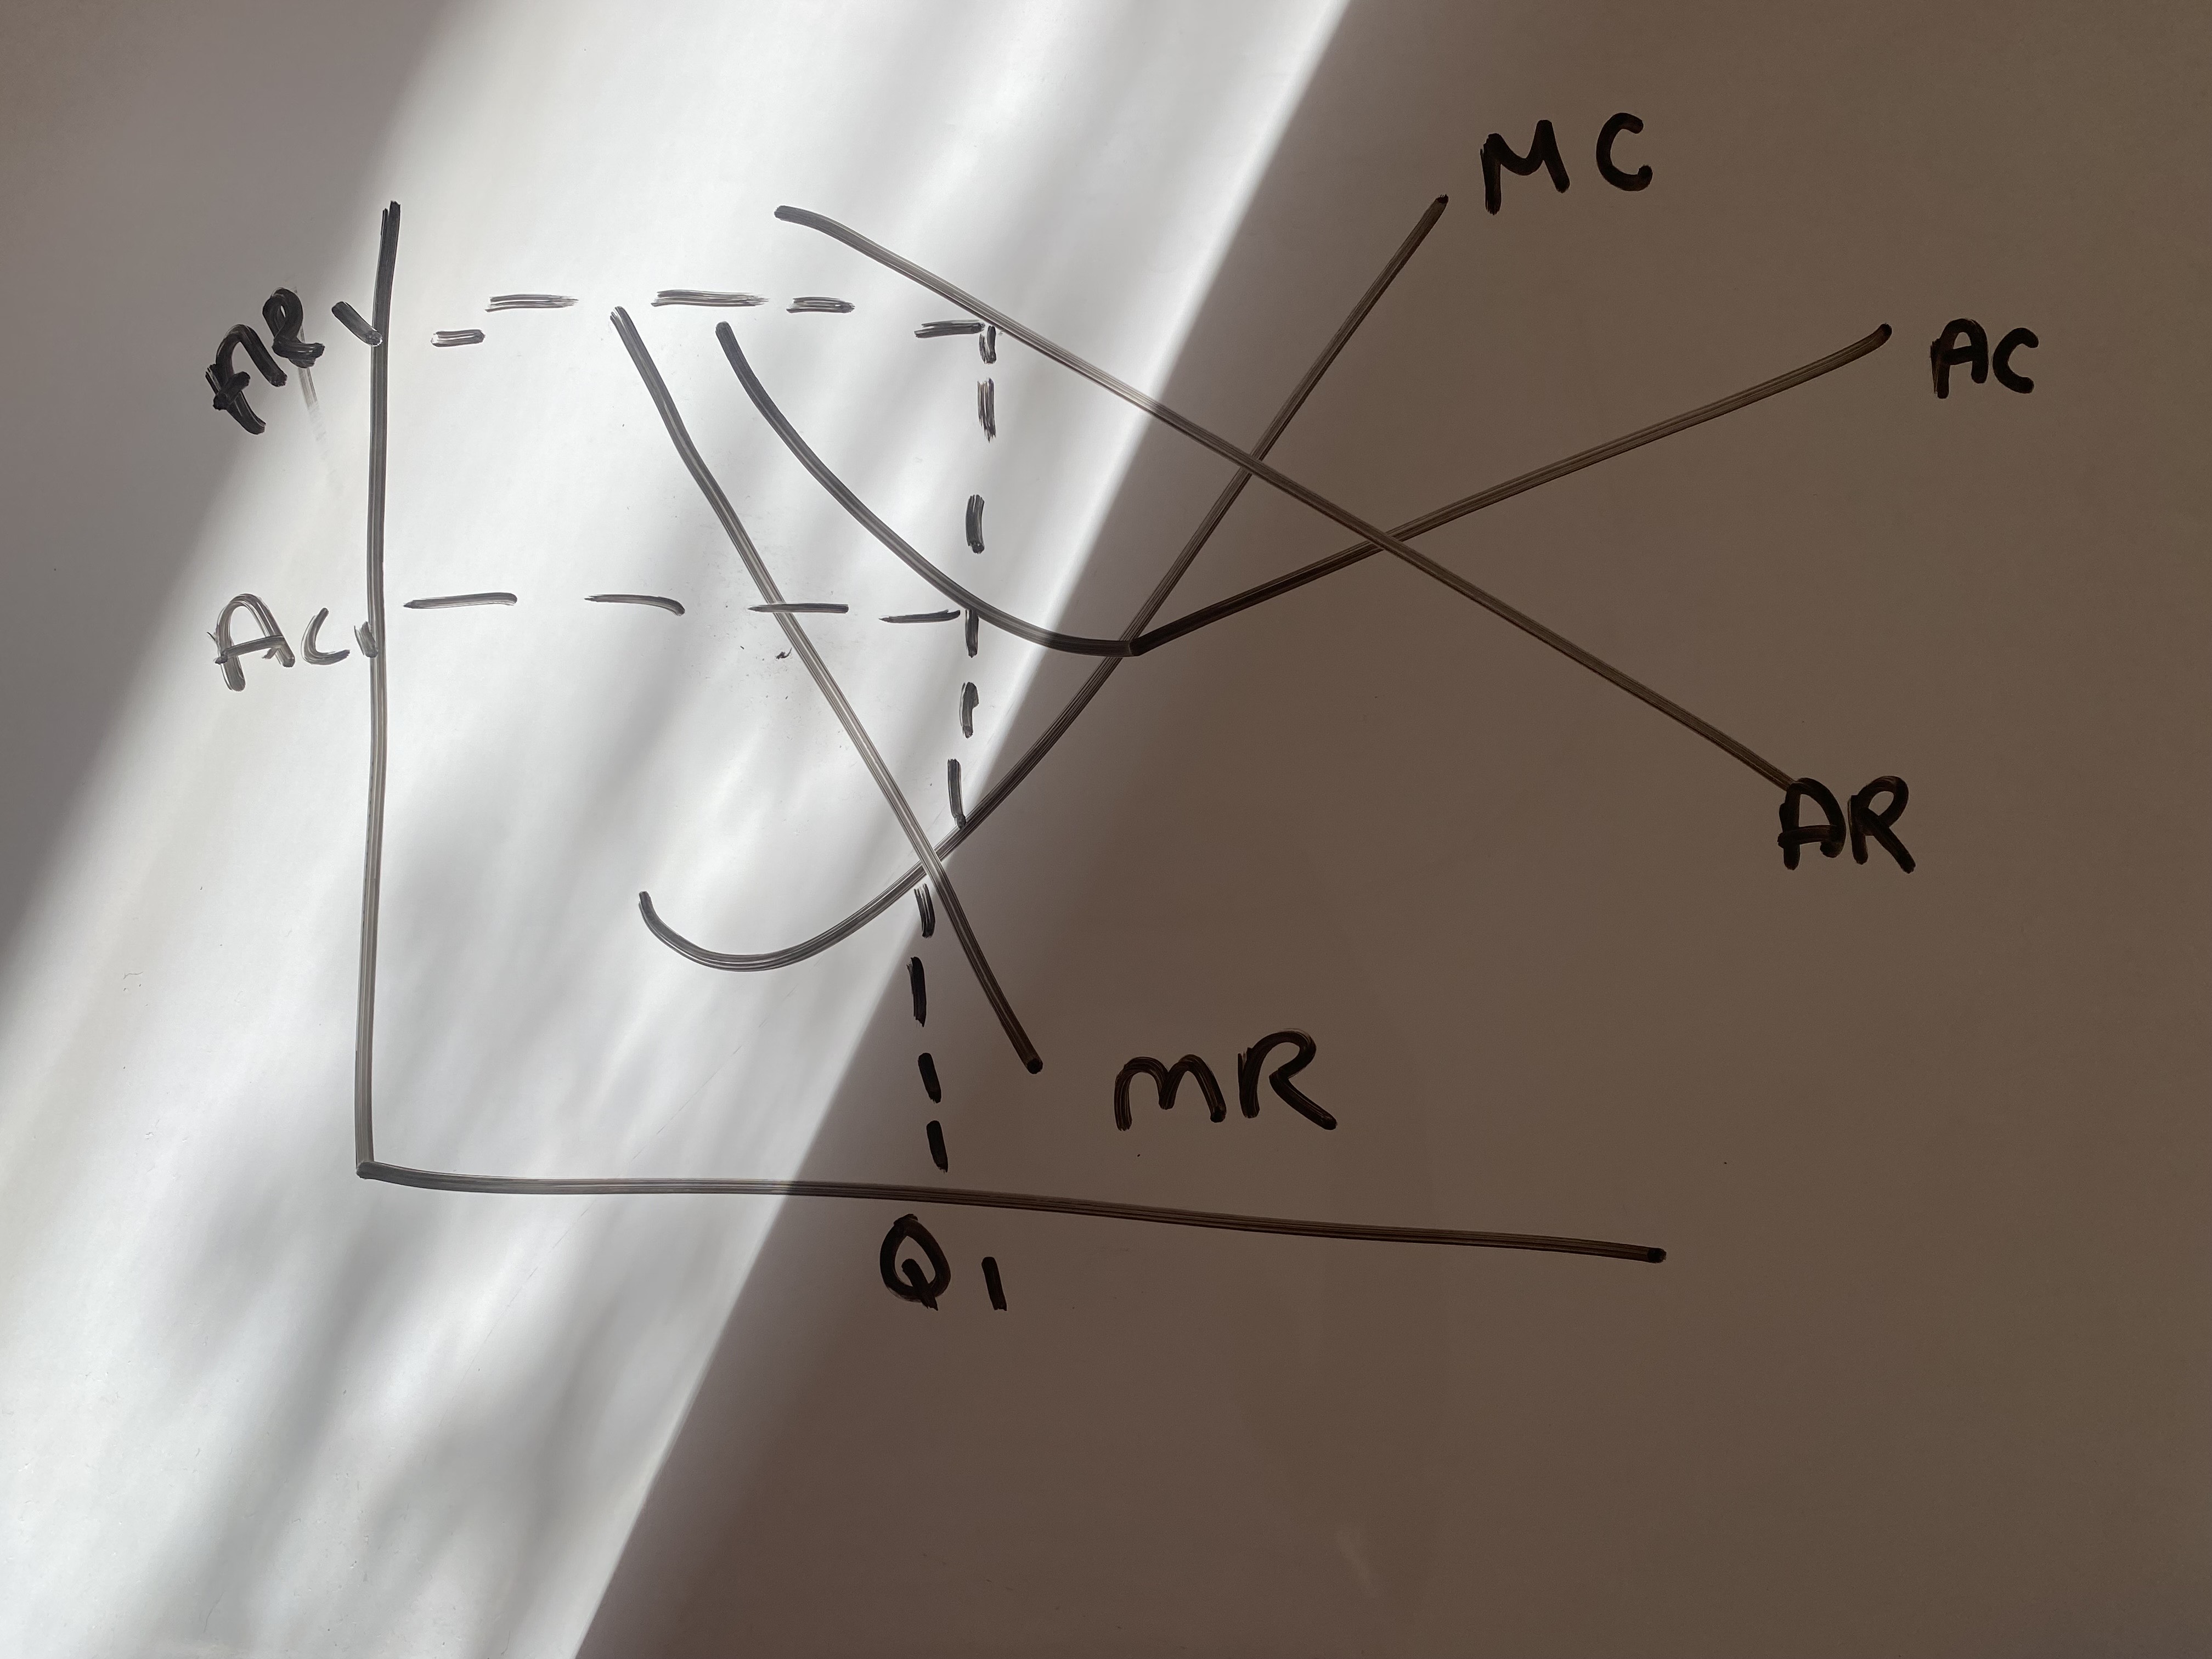
MC,AC on a diagram and AR and MR for a price setting firm design it in such a way to represent a firm
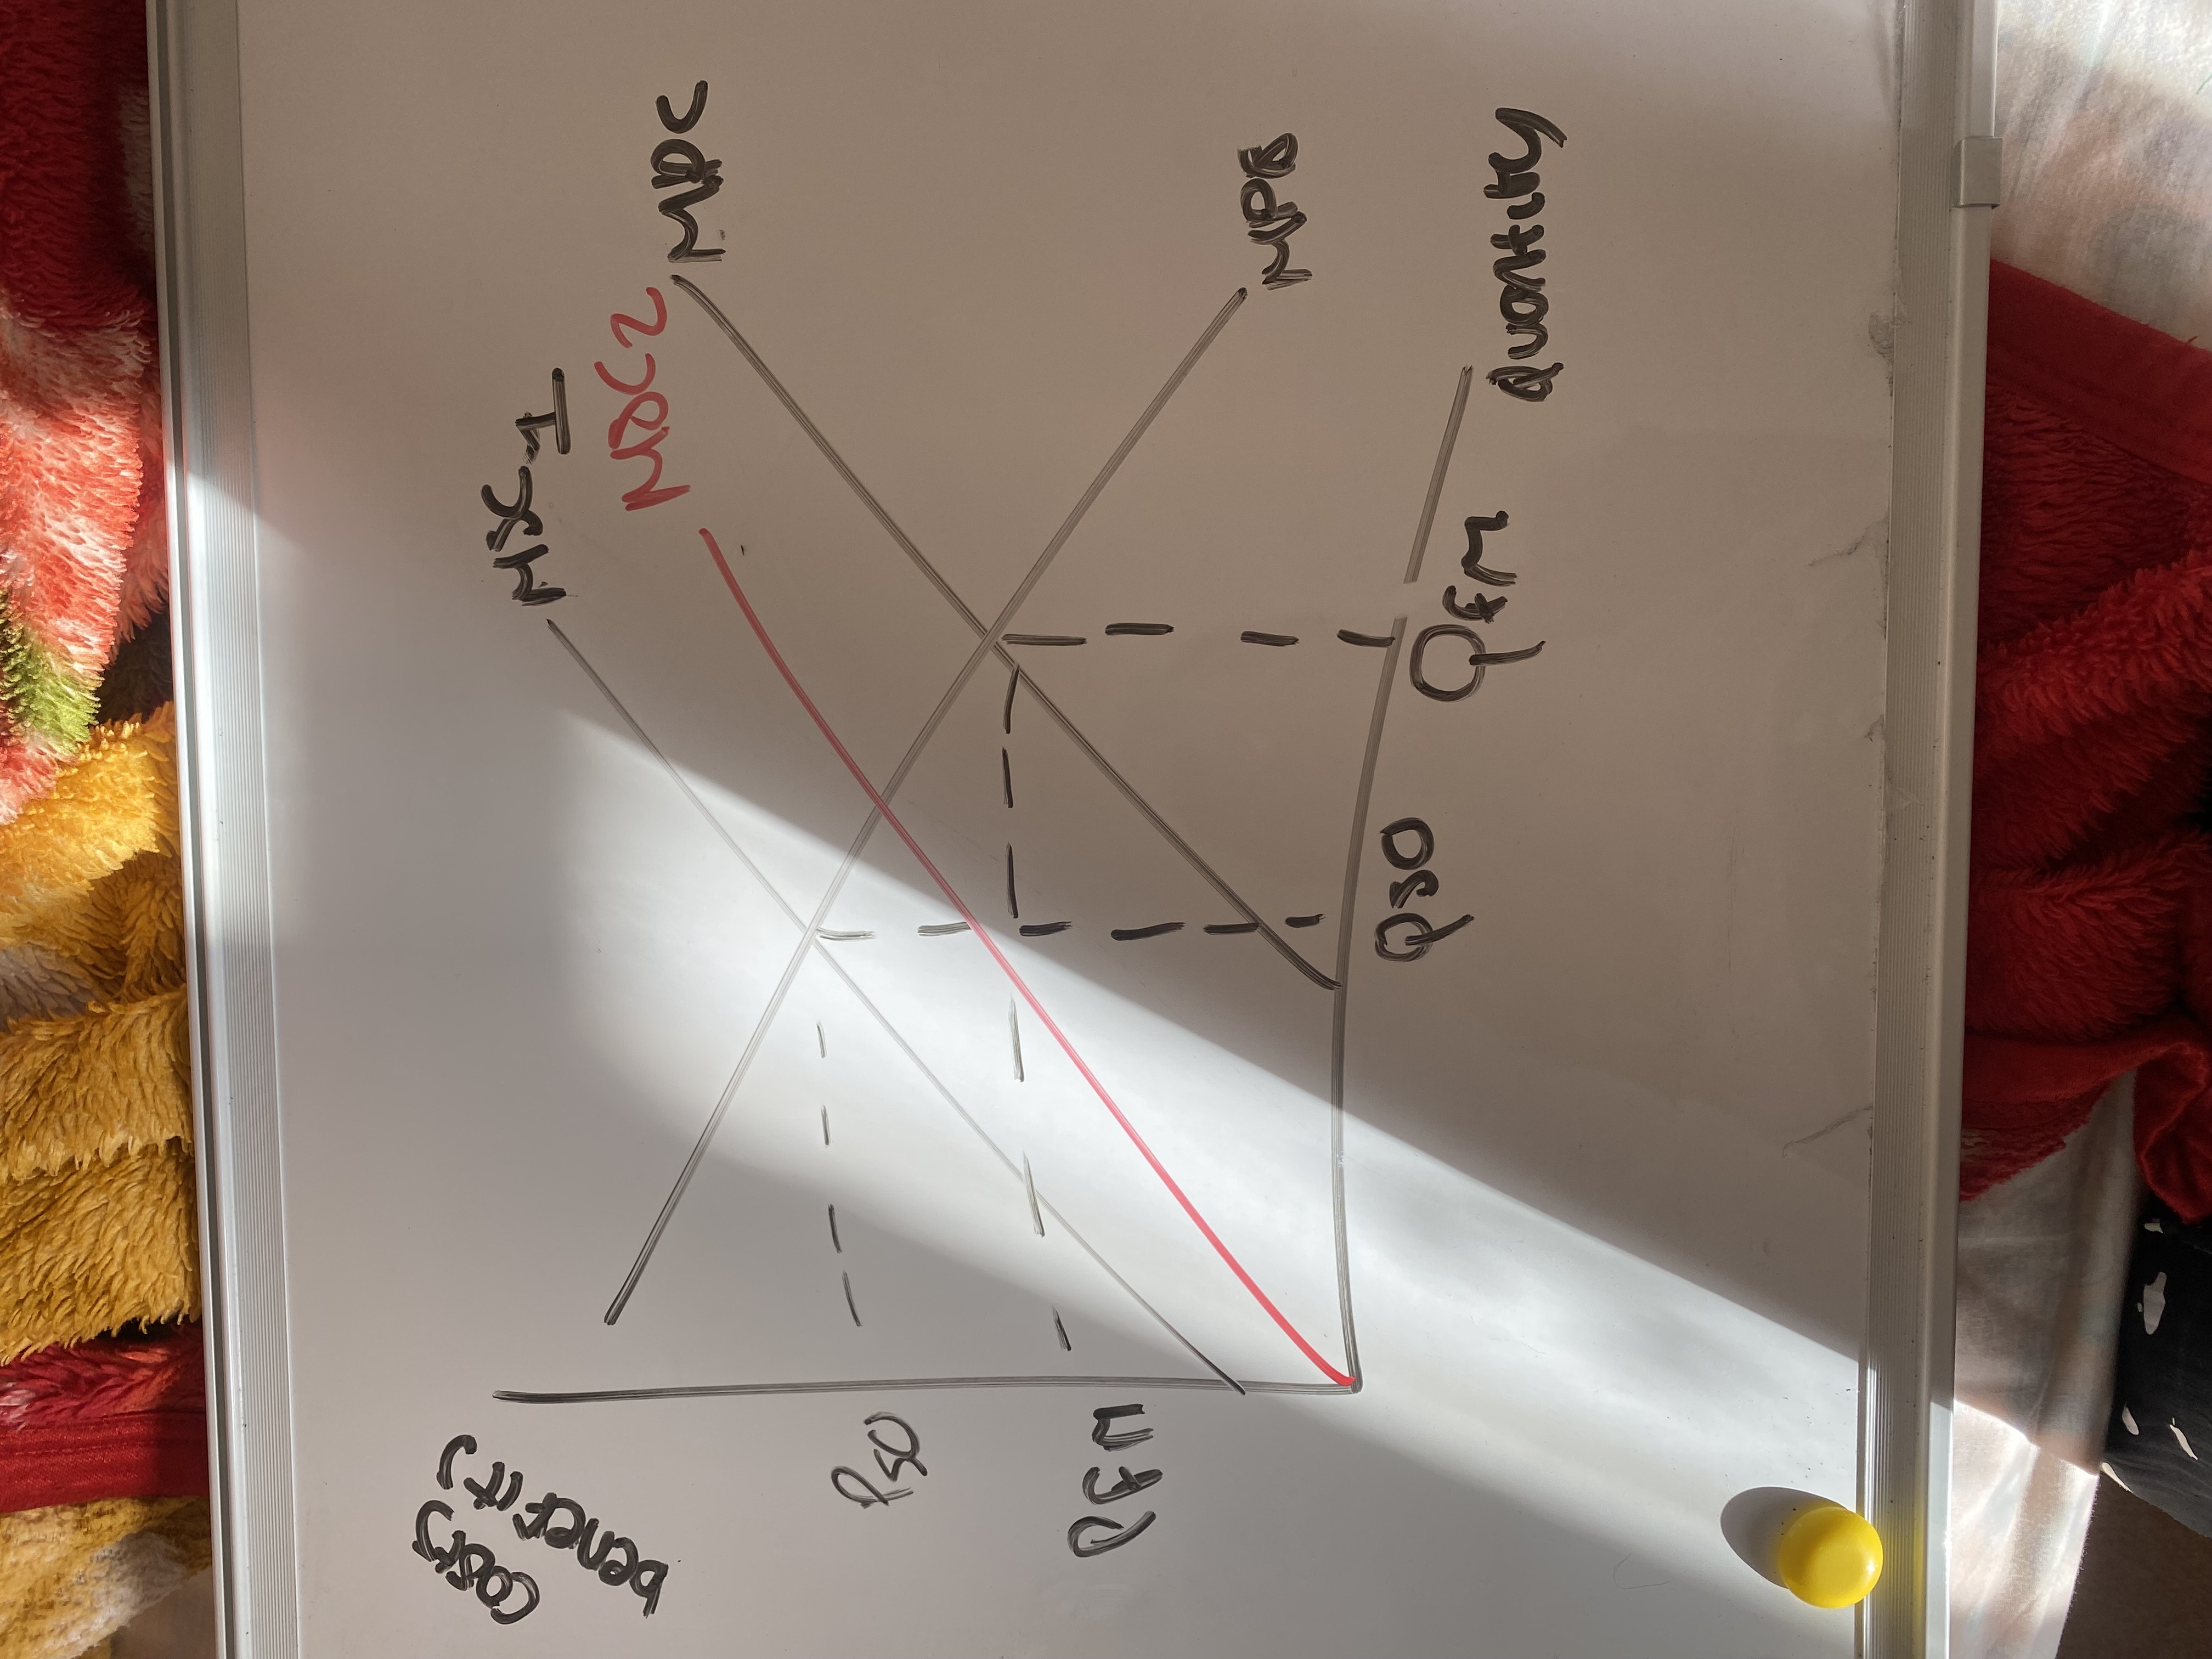
Firm reducing their social cost
Price taker making a supernormal profit