GEOG 481 Final Exam Flashcards
1/62
There's no tags or description
Looks like no tags are added yet.
Name | Mastery | Learn | Test | Matching | Spaced |
|---|
No study sessions yet.
63 Terms
Topology
A mathematic study of “knowing what’s next to what”
“Raster is faster, vector is corrector”
With raster, you’re able to perform analysis and calculations faster and is more performance-efficient, while vector is known to be more precise. Choosing between raster and vector depends on the type of analysis you’re doing.
Continuous data
Data exclusive to raster GIS that generally have high spatial autocorrelation (gradually changing values).
Ex: Elevation, slope, flow accumulation
Discrete data
Data representing distinct spatial objects (belonging to a class)
Ex: LU codes
Nominal data
Numbers with NO numerical meaning
Ex: LU codes
Ordinal data
Number determining a rank relative to other cells
Soil drainage (soil is very well drained/poorly drained)
High resolution raster
A raster with smaller cells relative to its size, resulting in a higher total number of cells in a raster. This allows for more precise and accurate analysis.
Low resolution raster
A raster with bigger cells relative to its size, resulting in a lower number of cells in a raster. Analyses with low resolution rasters may result in lower accuracy results.
DEM
Rasters with elevation data of the bare earth.
Also known as the heart of raster.
DSM
Rasters with elevation data may also depict elevations derived by tree tops building, or other features.
Map algebra
A system used in the raster calculator tool to manipulate raster layers
+ (ADD) in Raster Calculator
Raster equivalent of Geoprocessing Union for vector
* (MULITPLY) in Raster Calculator
Vector equivalent of Geoprocessing Intersect
Raster priority
Using raster calculator to multiply certain layers by factors of 10. You can “union'“ (+) these layers to create a result raster with symbology representing certain criteria met.
Ex: Conducting an analysis on which locations on a raster are more susceptible to landslides.
Slope percent
The steepness of the terrain expressed in percentage (0-∞%)
Slope in degrees
The steepness of the terrain expressed in degrees (0°-360°)
Aspect
The direction one is facing when going downslope on surface (0°-360°)
Interpolation
Predicting unknown values for a cell in a raster from a limited number of known data points
IDW
Predicting unknown values for a cell in a raster based on its distance relative to known points
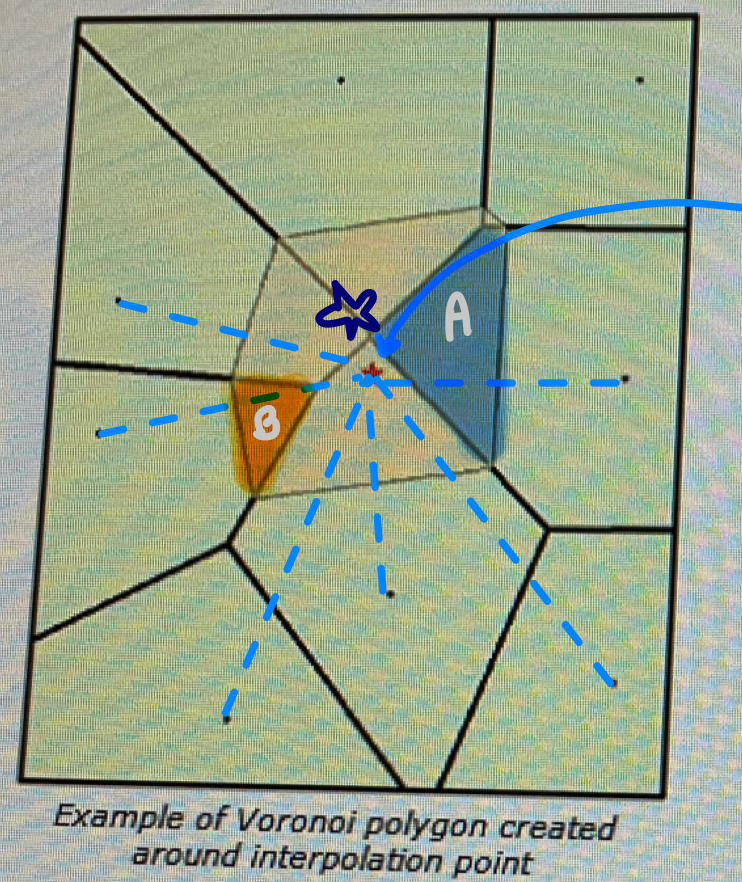
NN
Voronoi (Thiessen) polygons are formed around the center of mass of known points.
A new polygon is formed about an unknown point
The areas of existing polygons are weighted based on how much area they contribute to the new polygon.
Spline
A mathematical equivalent of a flexible ruler.
Inexact: Creates smooth surfaces between points, but may not also represent the known dataset.
Global interpolation
Considers all known values in a dataset to interpolate unknown values
Ex: Kriging
Local interpolation
Uses nearby data (within a designated search radius) to interpolate unknown values
Exact interpolation
Predicting unknown values while preserving the values of the known dataset
Inexact interpolation
Predicting unknown values without preserving the values of the known dataset
Spatial autocorrolation
Tobler’s First Law of Geography: Features closer to each other are more similar than features far away from each other
Deterministic (non-statistical) interpolation
Uses mathematical formulas to predict unknown values for points using a set of known points.
Uses spatial autocorrelation to predict values
Ex: IDW
Geostatistical interpolation
Uses the statistical properties of known points to quantify spatial autocorrelation
Takes into account uncertainty in its predictions
Ex: Kriging
Sink
A cell with an undefined drainage direction and disrupts the flow of H2O

Pour point
The lowest elevation point of a sink. If the sink were to be filled with H2O, this is where the H2O would pour out.
Why sinks should filled
To ensure proper delineation of basins and streams
To identify the boundary of a watershed
Set Null
A tool identifies cells with a known value to be set to “NoData” (null)
Flow direction
Designates a direction of the flow of H2O in a filled DEM
D8
Single directional flow algorithm: A method of calculating flow direction, assigning flow direction to its steepest descent in 1 of 8 directions
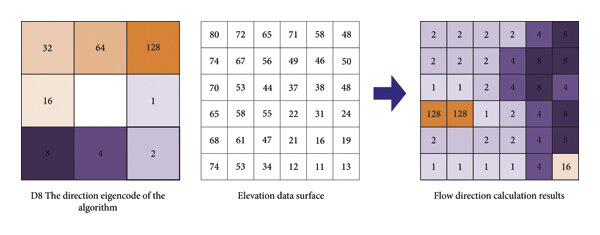
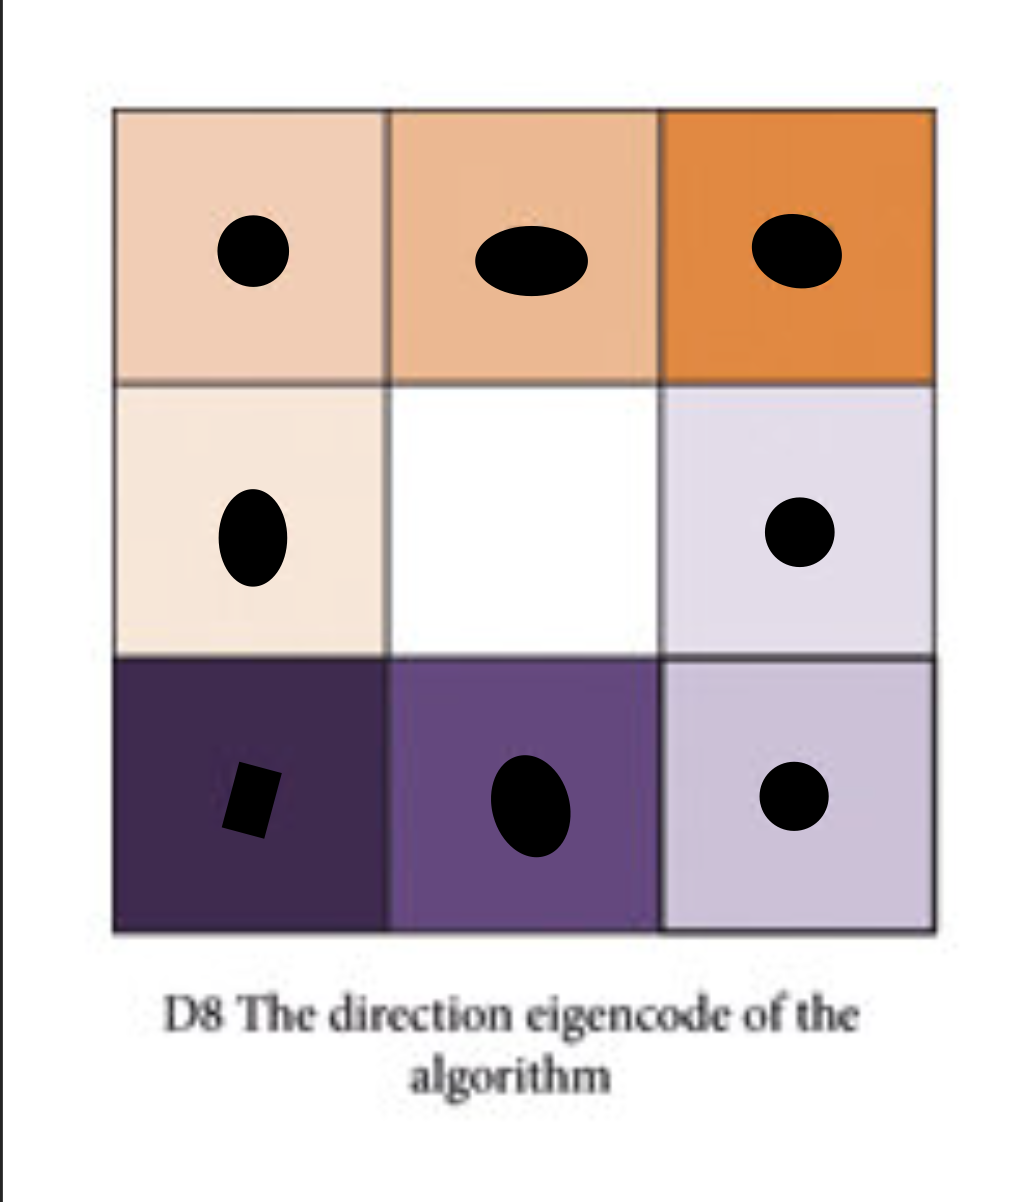
D8 directional values
1 = east
2 = south east
4 = south
8 = south west
16 = west
32 = north west
64 = north
128 = north east
D8 is too simple
Only assigns a cell to flow in one direction, not realistic!
Flow accumulation
Calculating a value with the # of cells that drain into that cell
Upslope area
(The number of cells) x (Grid cell resolution) = the area of land that drains into a particular cell
Grid size resolution
The size of one cell on a raster grid
How flow accumulation can be used in spatial hydrology
Create a stream network (using Raster calculator) to identify flow accumulations above a certain threshold.
CON
Performs a conditional evaluation on each input cells of an input raster
“IF ___, THEN ___.”
How are CON and SetNull used together in spatial hydrology?
To identify cells with a certain value and reclassify them as “NoData”
2 methods of stream order
Strahler and Shreve
Shreve method
Stream orders are additive downslope.
When 2 links intersect, their orders are added, regardless if they are of the same order or not.
The 2nd stream order method created
Strahler method
Stream orders increases when links of the same order intersect.
Links with different stream orders will maintain the highest stream order downslope
The most common method!
The original stream order method
Which stream order method is more likely to result in more stream orders (1, 2, 3, and so on…)
Shreve. Stream orders of streams that intersect are additive, regardless of if they’re the same stream order or not.
Spatial hydrology tool workflow in ArcGIS Pro
Unfilled DEM → Fill DEM
→Raster calculator → Residual grid
Filled DEM → Set Null
→Flow direction grid
→Flow accumulation grid
→CON to identify stream network
→Set Null: non-stream cells → INPUT STREAM RASTER
→ Stream order (Strahler or Shreve)
FD → Basin to delineate all drainage basins
Basin
Creates a raster delineating all drainage basins
Fill
Fills all sinks in a surface raster
Stream order
Assigns a numeric order to linked within a stream network. Stream orders may increase when links intersect.
Triangulation
A method of precisely locating something using 3 or more satellites
Errors in GPS data
Blocked signal
Molecules in our atmosphere messing with radio signals
Multipath error
Satellite geometry (too few satellites/poor satellite elevation)
Multipath error
Satellite signals hit things on their path to the object being located → inaccurate location due to longer travel time
Differentiation GPS
Utilizing ground-based reference stations alongside satellites to increase GPS accuracy.
The more satellites/reference stations in contact, the more accurate the location.
Error
Getting something wrong (Mistakes = inevitable)
Errors left unchecked → GIS analyses’ results are questionable
Uncertainty
Our lack of knowledge (“I don’t know”)
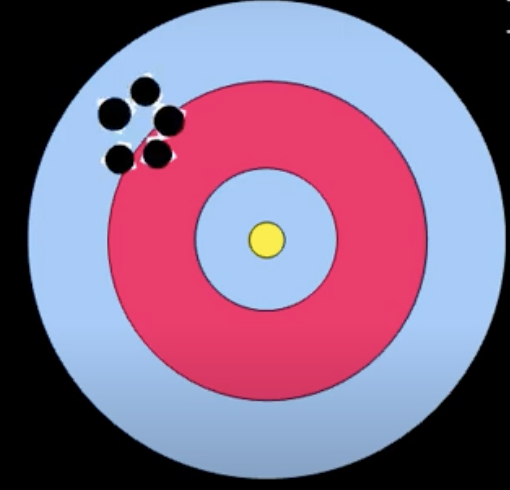
Accuracy
The degree to which information on a map matches the truth.
Precision
The level of exactness of information on a map
Repeated samples are near the same value, but may not necessarily reflect reality.
Ex: Not using the right datum → poor accuracy, but high precision.
Sources of error in spatial data
Grid cell resolution
Density of observations (ex: number of weather stations)
Areal coverage (ex: gaps in DEM coverage)
Outdated data
Map accuracy standard for maps with a scale greater than 1:20,000 (more zoomed in)
No more than 10% of the points may be off by 1/30th of an inch
Map accuracy standard for maps with a scale less than 1:20,000 (more zoomed out)
No more than 10% of the points may be off by 1/50th of an inch
Small scale
Less detail; more zoomed out
Large scale
More detail; more zoomed in