1 - psychophysics
1/29
Earn XP
Description and Tags
Name | Mastery | Learn | Test | Matching | Spaced |
|---|
No study sessions yet.
30 Terms
why measure perception?
physical stimuli are “real” and can be measured
perception is a private experience
some say can measure perception bc may offer clues abt nature of the brain, the way it processes info and ultimately bio processes that lead to sensation + perception
in clinical setting, allow for proper diagnostic
what are methods used to study sensation + perception?
threshold: faintest sound you can hear
scaling - measuring provite experience: rate on scale
signal detector theory - measuring difficult decisions: takes cog processes into consideration
e.g., did you see light or was that imagination?
sensory neurosci: how do sensory receptors and nerves underlie our perceptual experience?
neuro imaging: what parts of brain active during crt tasks?
computational models: can we create models of sensory sys that adapt and learn, like humans?
what is classical psychphysics?
pioneered by Gustav Fechner
true father of experimental psych
psychophysics → study of quantitative relationships bet. physical stimuli and psych experiences
mind meets matter
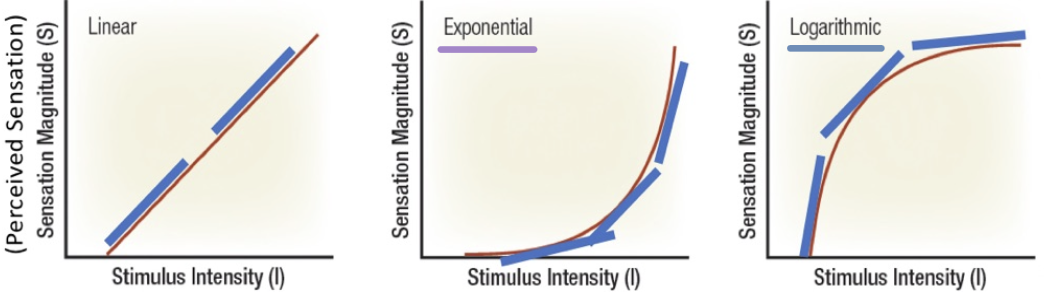
how can we describe the relationship between mind and matter?
relate physical stimuli to perceptual experiences using mathematical models bc useful to compare data
func: mathematical description of how one variable is related to another; generally formula
exponential: at lower intensities, no change pain sensation but w/ higher intensities you get increased perception pain
log: small increases at lower intensities = high sensation
high slope at low intensity
what is absol thresh, subthresh & suprathresh?
absol thresh → min stimulus lvl required to be registered by brain as sensory event; where func begins
subthresh: below lvl detection
suprathresh: above lvl detection
how can we measure thresholds?
method of adjustment
method of limits
method of constant stimuli
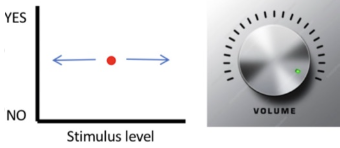
what is method of adjustment?
simplest
light shine computer and turn knob until can detect it OR turn it down until can just barely see it
what is method of limits?
series stimuli
start w/ subthresh and increase intensity OR w/ suprathresh n decrease intensities
avg of thresh = absol
what is method of constant stimuli?
random order
more accurate bc no bias in expectation
why do we need to repeat measures over and over when measuring thresholds?
variability in NS + computer screen, not same thresh each time
what type of data does a psychophysics experiment generate?
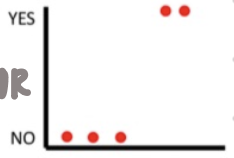
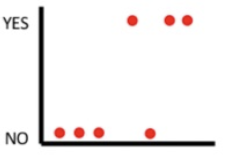
ideal detector:
always sense suprathresh stimuli
NOT TYPICAL
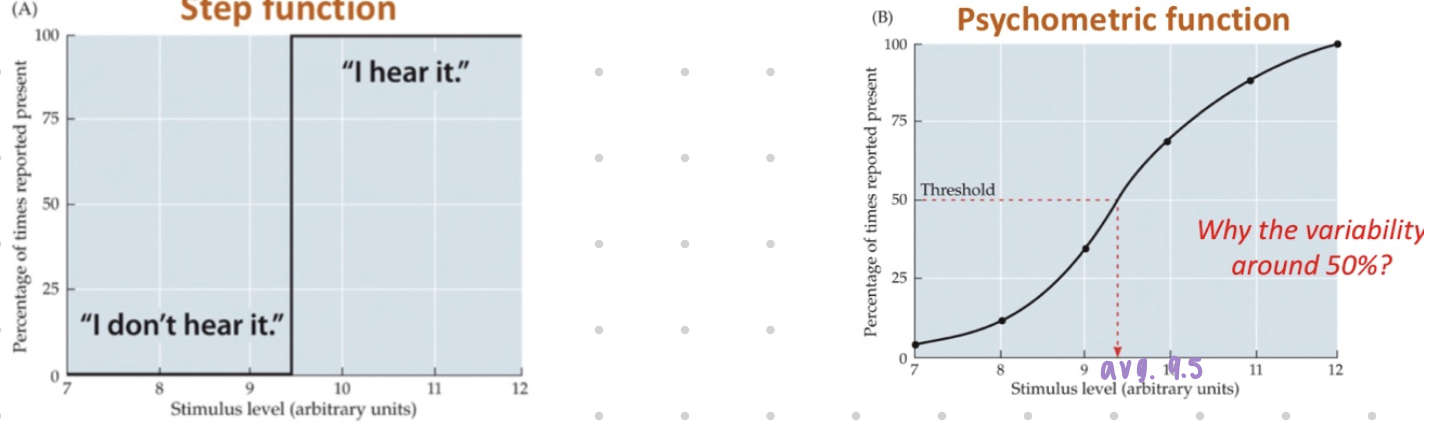
psychometric func: uncertainty arund stimulus intensities near abs. thresh
select a 50% response lvl as abs. thresh bc bio, cog + physical variability
normally, S-shaped funcs → ogive
what determines the shape of the psychometric func?
absol thresh. only gives starting pnt
for rest of func, need to have idea of:
what slope at suprathrsh lvl and
how slope changes w/ increasing intensities
difference thresh (or just noticeable difference, JND), ΔI (Ernst Weber): how does stimulus need to change in order to produce a detectable change in perception?
how to find diff thresh?
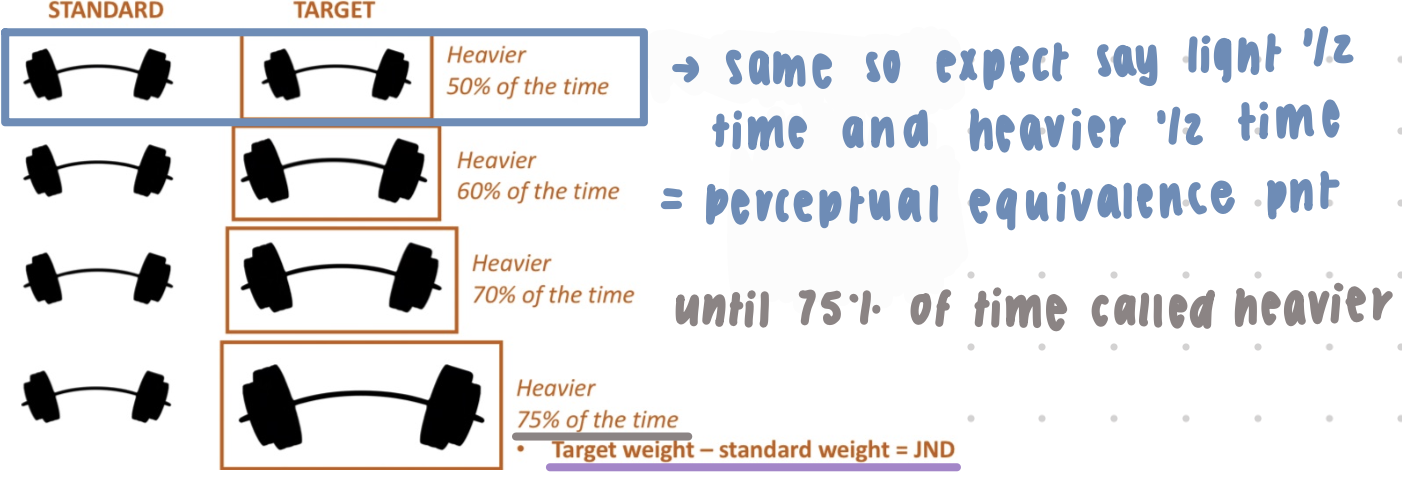
experiment: present subject w/ 2 stimulis and ask which is heavier (i.e., greater stimulus “intensity“) → repeat
one is standard and other is target
calc % of times subj said target heavier than standard
2 alternatives → forced choice
when said target is heavier 50% of the time → same so expect say light ½ time and heavier ½ time = perceptual equivalence pnt
until get to 75% of the time target called heavier
target weight - standard weight = JND
if change the weight of standard → need a larger change in weight to detect a change at all when stimulus intensity is increased
describing Weber’s observations mathematically
Weber’s law: ΔI = K’
ΔI is a const. proportion (k) of stimulus intensity (I)
Weber’s fraction, k, must be experimentally determined
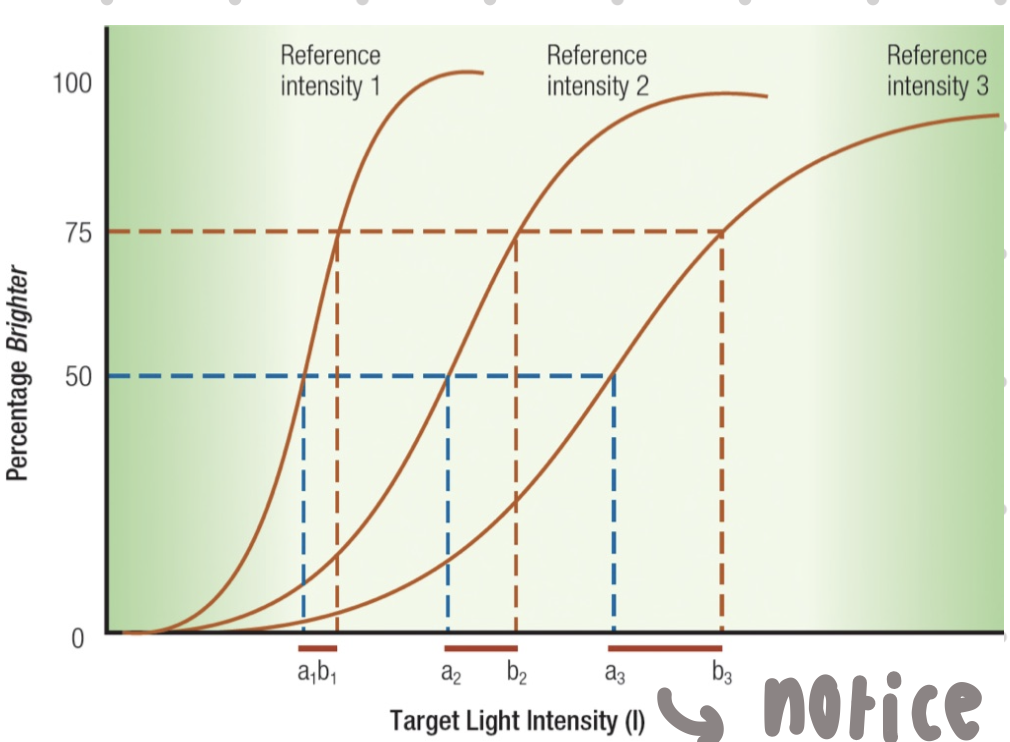
in graph → notice w/ increasing standard light intensity func get flatter
there is also increase in thresh w/ intensity (need a lil light to notice diff at low intensities)
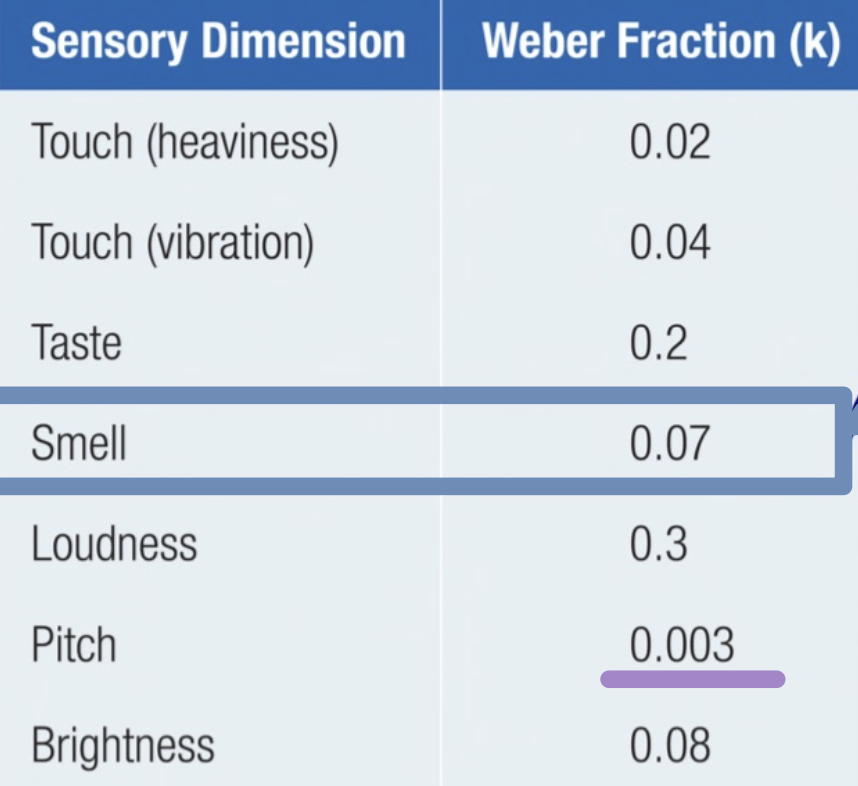
sensory dimension and weber fraction (k)
e.g., for smell → means need to add 7% of stimulus order to detect diff in intensity
pitch is the most sensitive (need to change v lil)
how is the JND related to changes in perception?
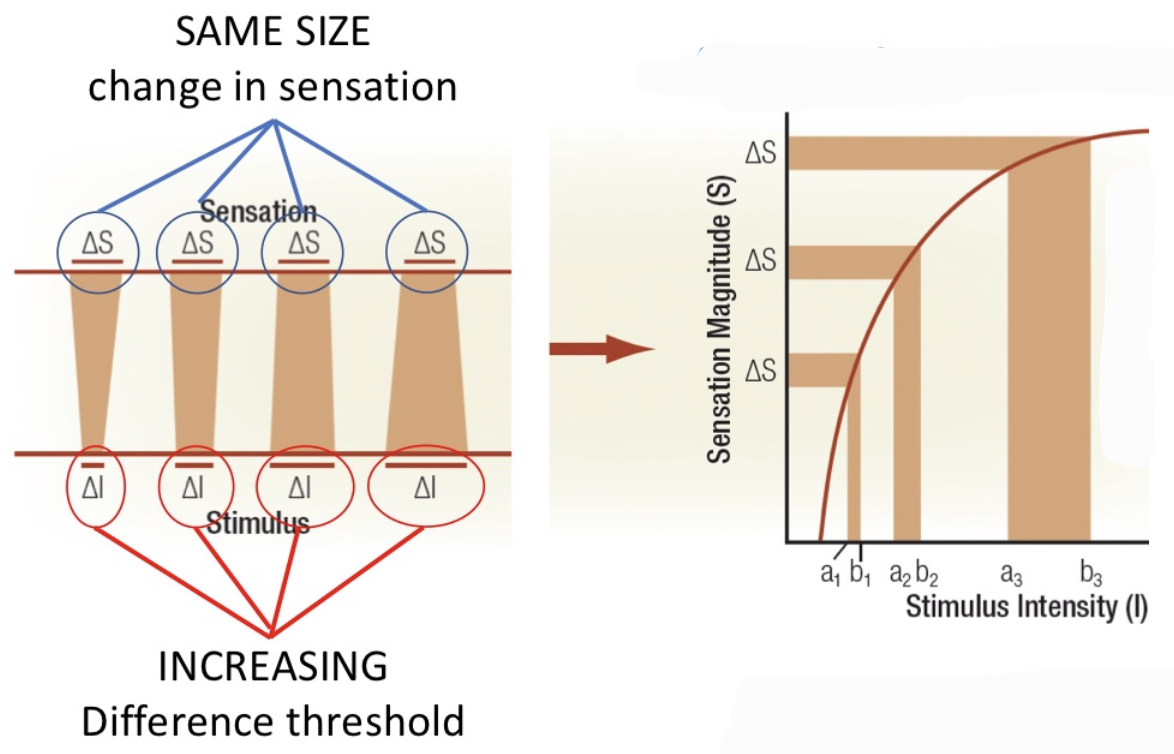
assumption: JND is like unit sensory perception = unit change in sensory perception
difference = 1 unit change
only func work as increase JND and keep sensation same → Fechner’s law
S = K ^log (I)
S = psych sensation/perception
k = constant (NOT same k)
I = stimulus lvl/intensity
law assumes that all JNDs are perceptually equivalent, i.e., ΔI is a “unit of the mind”
need to ad more to keep ΔS
psych experinence increases less quickly than actual physical stimulus increases → slope decreases as intensity increases
NOT TRUE for ALL sensory modality
what is modern psychophysics?
debate: whether stimulus-sensation relationship could be measured continued after Fechner and Weber’s work
Stevens proposed new set method studying perception:
beleived could directly measure sensation
beegan era of modern psychophysics
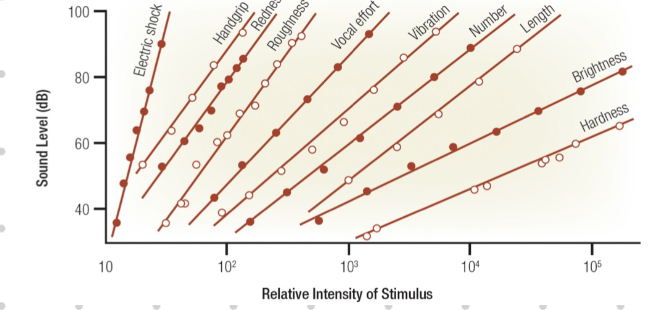
magnitude estimation & power law
scaling: a general psychophysical procedure to estimate the amount of sum related to perception
magnitude perception: a scaling approach in which subject provide direct ratings of thir sensations
experiment: subj assign num to the standard stimulus (modulus) and provide a relative numerical rating for other stimulus of varying intensities
discovered relationship bet. stimulus and sesation can be direction measured bu subj
subj ratings were consistent w/ power law
S = a x I^b
S = sensory experience
a - scaling const
B = exponent that determines if increases lot/lil at diff intensities

what is the val of power exponent (b)?
each sensory experience is related to stimulus intensity by a specific exponent
nature of the relationship, or “power func” or decreasing, depending on exponent
NOTE: for exponents >1, Fechner’s law does NOT hold, use Steven’s power law
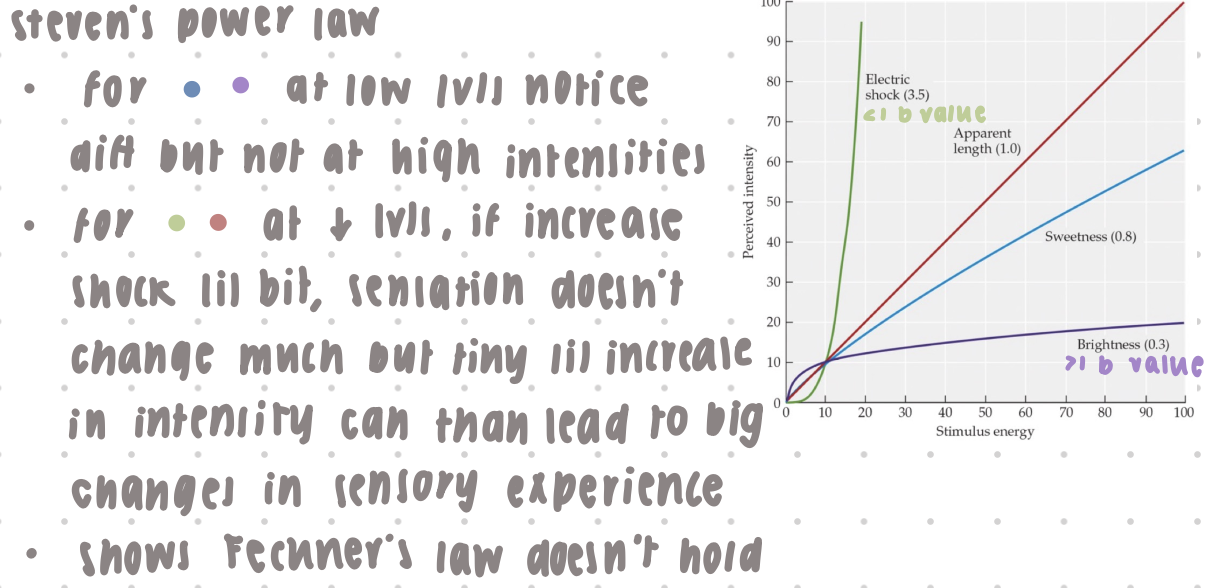
graph:
for blue and purple: at low lvl notice diff but not at high intensities
for green n red: at low lvls, if increase shock a lil bit, sensation doesn’t change much but tiny lil increase in intensity can than lead to big changes in sensory experience
shows Fechner’s law does NOT hold
what determines exponent in power func?
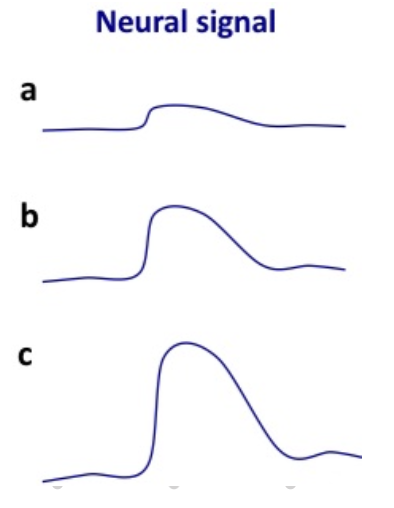
sensory transducer theory: idea that transduction of the physical stimulus into the biological stimulus is basis power law
the neural output of sensory sys must follow power law relationship w/ the stimulus
e.g., elec shock
neural response gets much bigger w/ intensity
what are some other scaling techniques?
cross-modality matching: compare stimulus from one sensory modality to stimulus of another sensory modality
relationships seem to be similar across individuals
graph → equal sensation func
e.g., shock w/ sound of shock
why is JND important?
relevant to many living things, not just humans
e.g., peacock feather diff might not be diff to females so can evolve to have less
good for them bc less heavy
what is signal detection theory?
recall: sig detection can vary → abs. thresh depends on likelyhood that signal>noise to produce a perceptible event
SDT: theory that takes into account nonsensory factors that can affect sig detection
uses stat concepts that take into account cog factors (i.e., sources of variability) that may influence a subj’s decision - making process
assumes the decision depends on sensitivity of sensory sys + udgment by subj (cog factor)
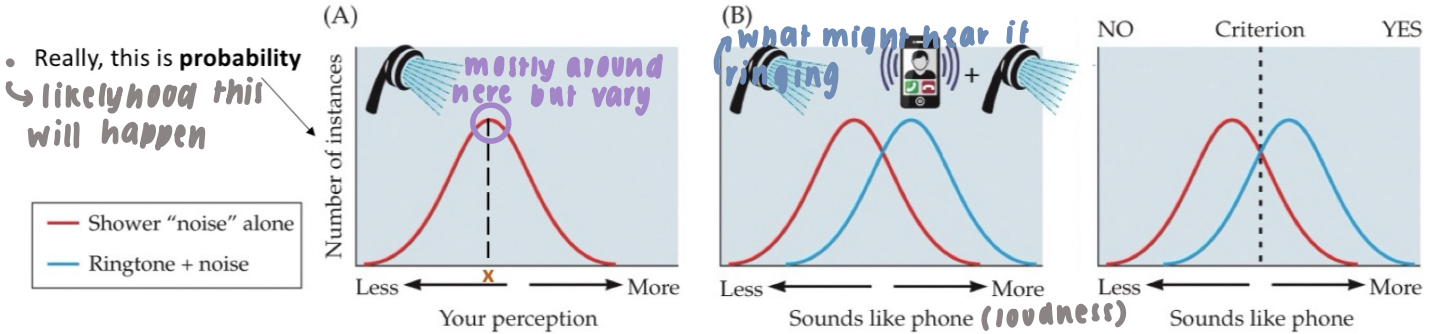
example 1 - detecting signal above noise
scenario: you’re in the shower, waiting for a v important phone call
water making conts sound = noise
sound phone ringing = sig
noise n signal + noise r represented by distribution
graph A:
magnitude perception varies
on avg, percpetion of loudness of shower noise = “x”
plot of all sensations would have a normal distribution
graph B:
when ringtone plays, signal is added to noise
graph C:
must decide on criterion (β) lvl of response, i.e., an int. thresh set by observer → min response lvl
β is automatic → unconscious
example 2 - detecting signal above noise
radiologists use mammograms to screen women for breast cancer
on a mammogram, cancer appears as a fuzzy white region (=signal)
there are other fuzzy regions of the mammogram not due to cancer (=noise)
decision for cancer diagnosis needs to be made
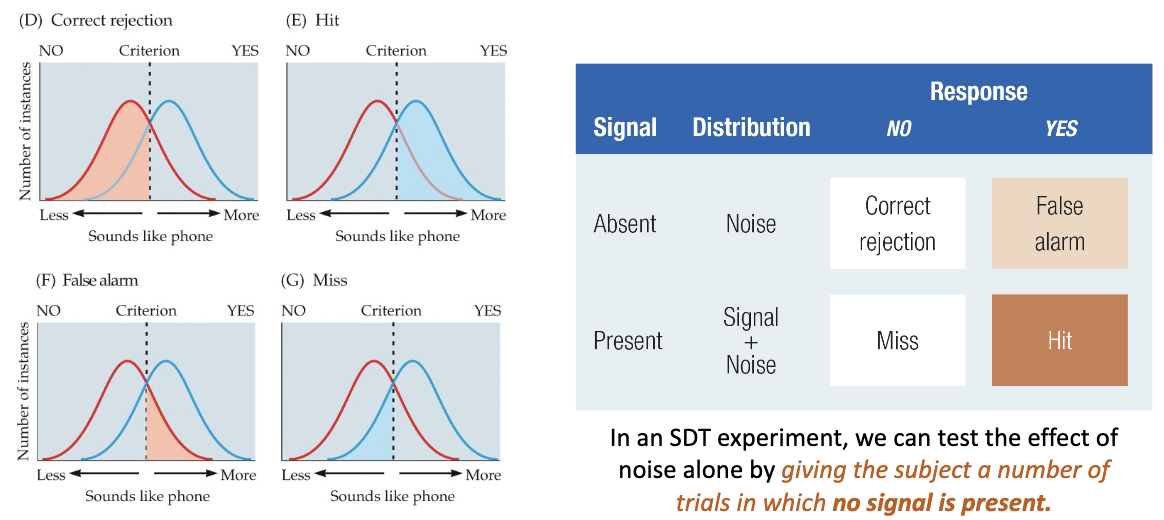
what are the 4 possible outcomes in an SDT experiment?
in STD experiment, can test effect of noise alone by giving subj a num of trials in which no signals present
can show how sensitive participants r to noise
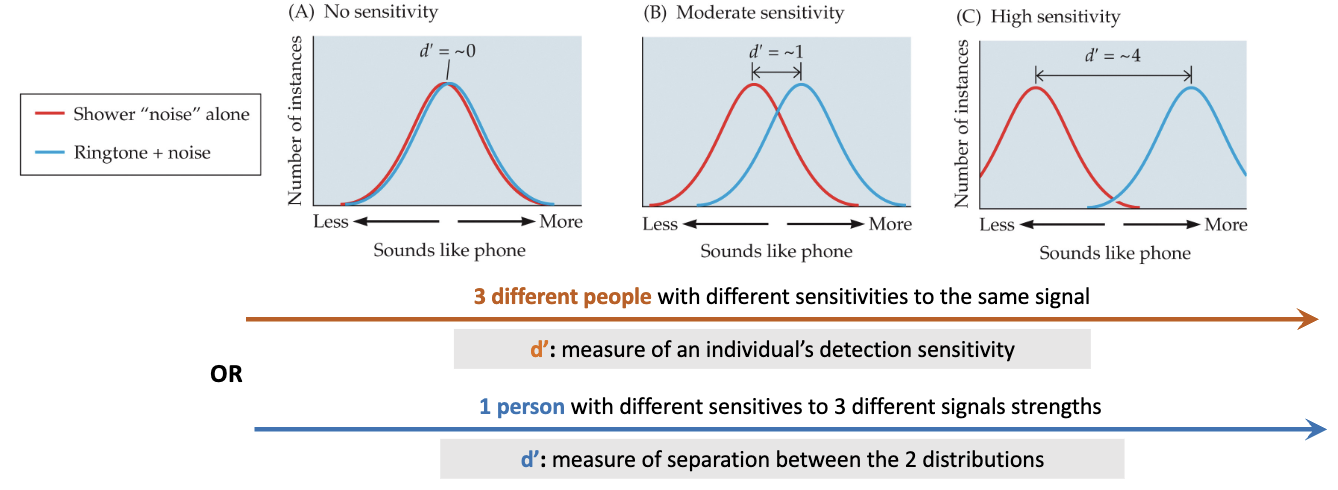
how sensitive are you to ringtone?
sensitivity to a stimulus is illustrated by the separation bet. the distribution of your response to noise alone and sig+noise
by knowing relalationship of hits to false alarms, can calc sensitivity measure, d’, if vol phone is higher → will have a high d’
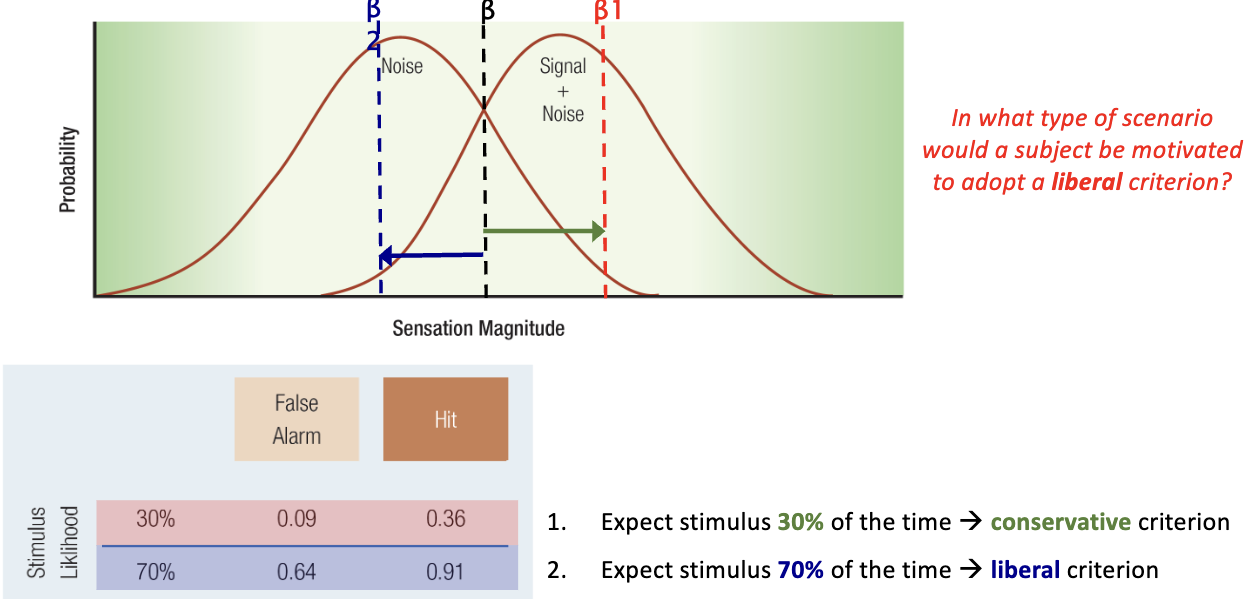
can β change according to expectation and motivation?
blue arrow → more liberal criterion
influence of waiting/expecting news
green → conservative lvl
e.g., if know it’s your mom calling, don’t go, can call back later
for stimulus likelihood
expect stimulus 30% time → conservative
expect it 70% time → liberal
increases likelihood hit and false
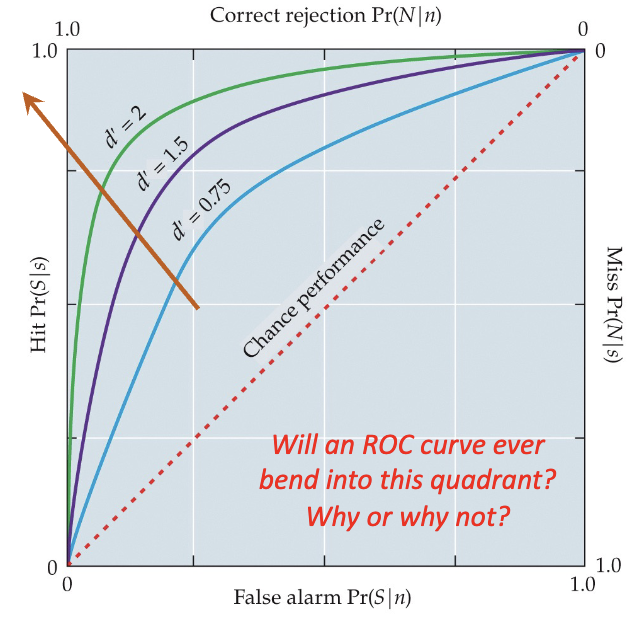
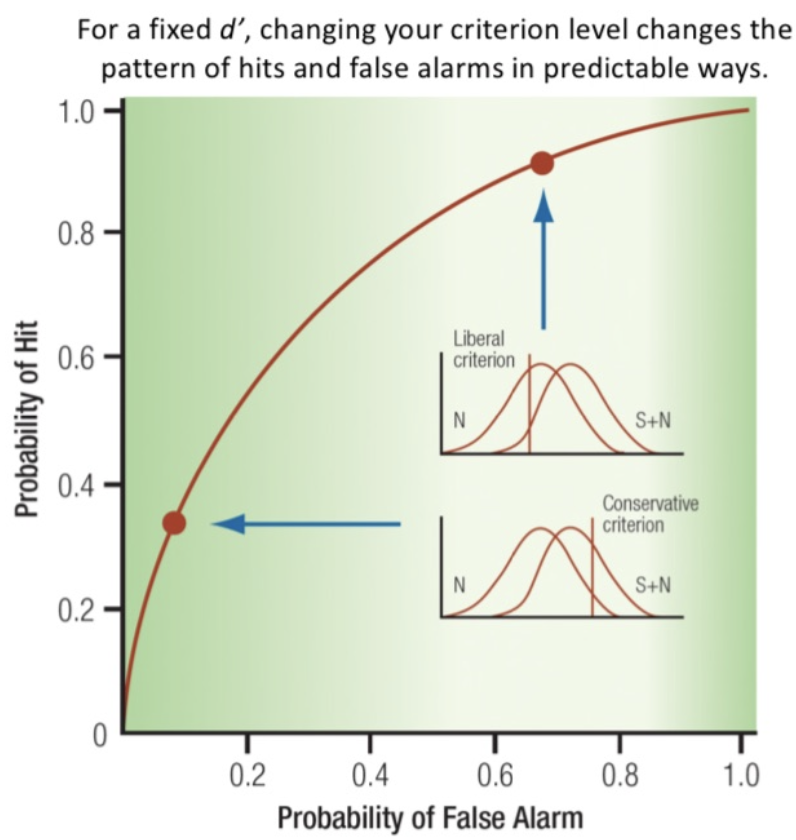
what is the reiciver operating characteristic (ROC) curve?
plot hit vs. false alarms for a sig of fixed intensity
illustrates the effet of diff criterion effects in SDT experiment
simply changing nonsensory factors can affect detection
response bias
so there is no abs. thresh bc it depends on many factors
inof in ROC curve
NOTE: higher d’ = distributions are far apart
provides estimate of relative sensitivities of diff individuals (d’)
can figure out by matching hit & false alarm rates to appropriate ROC curve
increasing d’ increases separation bet. distributions and the likelihood of a hit (less likelihood false)
as d’ increases → sensitivity increases
straight line on the graph = guessing (probability hit and false same)
provides measure of how nonsensory factors may influence judgement (β)
can see how probability change when signal and us stay same but there are expectancies & motivation involved
NOTE: ROC will never bend beneath chance performance (i.e., more false alarms than hits), bc the sig distribution is always to R of noise distribution → area under blue curve is always greater than area under red curve since blue curve = sig + noise