EKG Graphs
 Call Kai
 Learn
Learn Practice Test
 Spaced Repetition
 Match
Match Flashcards
 Knowt Play
1/60

There's no tags or description
Looks like no tags are added yet.
Name | Mastery | Learn | Test | Matching | Spaced | Call with Kai | Chat |
|---|
No analytics yet
Send a link to your students to track their progress
61 Terms
What is the 1500 method
count the number of small boxes between two R intervals
used for a standard speed of 25mm/sec
rhythm must be regular to use this method and works best for fast rhythms.
What is the sequence method
also known as the 300 method
calculated using large boxes rather than smaller ones
only used as an estimate for regular rhythms
what is the 6 second method
used for estimating rate when the rhythm is irregular
count the number of QRS complexes in a given tracing (between the hash marks) and multiply number by 10
Calculating max heart rate and target heart rate
220 - pt. age is max heart rate
target heart rate is (220 - pt. age) x 70%
How many seconds is required to establish regularity of waveforms
6 - 10 seconds
What is a caliper
tool to measure regularity of waveforms
P wave signifies…
atrial depolarization (contraction)
QRS waveform is …
ventricular depolarization (contraction)
regular rhythm…
QRS complexes separated by the exact same distance across EKG tracing
irregular rhythm…
difference between waveform spacing
regularly irregular rhythm…
noticeable irregular pattern that repeats throughout the tracing of a QRS complex
irregularly irregular rhythm…
varies without consistency throughout the tracing
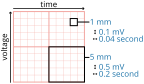
dimensions of EKG paper
normal QRS waveform range
0.04 - 0.10 seconds
variations can be a sign of ventricular dysfunction
J point
point where ventricular depolarization stops and repolarization begins
during ischemia J point can elevate or depress below baseline
occurs at end of QRS or at start of ST segment
T wave
ventricular repolarization
U wave
not always visible but represents repolarization of the bundle of HIS and purkinje fibers
PR intervals
time it takes for the SA node to fire, atria to depolarize, and electricity to travel through the AV node
Beginning of atrial depolarization to beginning of ventricular depolarization
from P to Q wave
normal PR range
0.12 - 0.20 seconds
P-P interval
represents that amount of time between atrial depolarization cycles
used to analyze rhythms/rates
R-R interval
represents time between ventricular depolarization cycles
QT interval
one complete ventricular cycle (depolarization and repolarization)
PR segment
end of P wave to beginning of Q wave
time between the end of atrial contraction and beginning of ventricular contraction
caused by AV node slowing impulse to allow the ventricles to fill up properly
ST segment
represents early phase of ventricular repolarization
from end of s wave to beginning of t wave
time from end of ventricular depolarization to the beginning of ventricular repolarization
amplitude of ekg tracing
0.01 mV for each 1 mm square
two large squares (10 small boxes) equals 1 mV
what demonstrates atrial dysfunction
abnormalities in P waves and PR intervals
what demonstrates ventricular dysfunction
QRS and T wave abnormalities
low levels of potassium…
high levels of potassium
cause heart rate to decrease
cause abnormal heart rate/rhythm
low levels of calcium
high levels of calcium
causes heart to slow
longer than normal contractions
Characteristics of normal sinus rhythm
P wave present, upright and rounded, amplitude less than 2.5 mm, duration less than 110 ms, with QRS narrow
Characteristics of sinus bradycardia
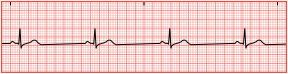
less than 60 bpm
sinus tachycardia
greater than 100 bpm
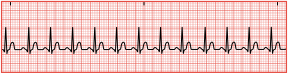
usually normal for pt with hyperthyroidism
Sinus dysrhythmia
slight irregularity in the rhythm
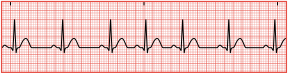
associated with normal breathing patterns
sinus arrest
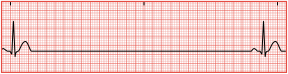
break in the normal pattern
usually SA node failed to fire
not significant unless the arrest lasts longers than 6 seconds
atrial flutter
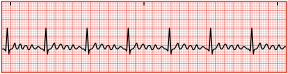
atria contract at a rate much faster than the ventricles are contracting
has a sawtooth pattern
atrial fibrillation
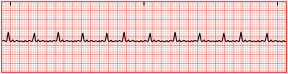
more severe than flutter
no organized contraction of atria — quivering state which can cause a blood clot due to stagnation of blood in ventricles
junctional arrhythmias
occur at AV node or tissue — typically causes the p wave to be inverted because the AV node initiates impulses when the SA node is damaged
premature junctional complex
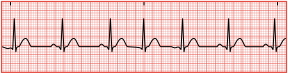
early impulse occuring before the next beat
P wave may be before, after, or buried within QRS complex = irregular rhythm
junctional escape rhythm
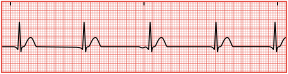
impulse originates from the AV node like a pacemaker.
Atria and ventricles receive impulse simultaneously which causes an absent P wave or inverted P wave
heart rate does not exceed 60 bpm
pt exhibits reduced cardiac output
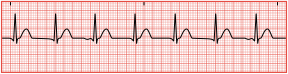
Accelerated junctional rhythm
same as escape rhythm but has 60 - 100 bpm
unlikely to have decreased cardiac output
junctional tachycardia rhythm
same as escape and accelerated but with 100 - 150 bpm
may experience palpitations or fluttering
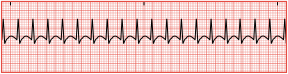
Supraventricular tachycardia (SVT) or narrow complex tachycardia
impulse comes from any area above the ventricles - does not follow the normal electrical conduction pathway
heart rate is greater than 150 bpm and P waves are usually not visible
Premature Ventricular Complexes (PVCs)
ventricles contract out of the normal sequence by an ectopic focal point within the ventricles
P wave is not visible and QRS is wider than normal with an unusual shape
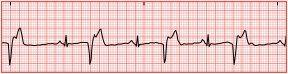
occasional PVCs
frequent PVCs
1-5 occur in one minute
6 or more occurring in one minute
Types of PVC Patterns (hint - there are 7)
unifocal: single early PVC indicates one irritable area
mulitfocal: PVCs with multiple shapes indicate more than one irritable area
interpolated: occurs with no interruption in the normal rhythm
bigeminy: occur every second beat
trigeminy: occur every third beat
quadgeminy: occur every fourth beat
coupling: two PVCs occur back to back
Ventricular Tachycardia
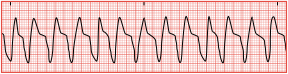
three or more PVCs occurring in a row with a rate greater than 100 bpm
Continuous state of relaxation and contraction of ventricles with poor cardiac output
no noticeable P waves in the tracing and QRS complexes are wide and unusual with the T wave in opposite direction
quickly progresses to fibrillation (w/decreased tissue oxygenation)
ventricular fibrillation
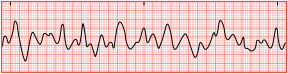
emergency state of ventricular quivering and no cardiac output
no discernable wave
tracing not compatible with life
can lead to asystole with no rhythm *heart stops
pt. typically will be unconscious
Idioventricular rhythm
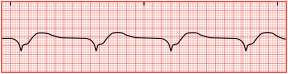
when only a ventricular pacemaker is functioning with a rate of 20 - 40 bpm and no p waves
QRS is wide with an unusual appearance
HR between 40 - 100 bpm is accelerated idioventricular rhythm
agonal rhythm
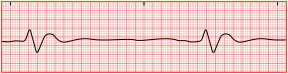
when all pacemakers of the heart have failed
wide, unusual qrs complex w/ no P or T waves
ventricular rate is less than 20 bpm
Heart block
block somewhere in the electrical conduction pathway, results in delayed or absent ventricular depolarization
Bundle Branch Block (BBB)
interference in one of the bundle branches
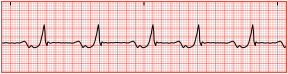
Left BBB: current moves through right bundle for right ventricular contraction but does not go to left bundle and instead moves to left ventricle via the septum - abnormal right to left stimulation
Right BBB: septum depolarization normally and the left ventricle is still activated by the left bundle branch. Right side is blocked so the left ventricle is able to send impulses through myocardium to the right ventricle to depolarize it.
First-degree atrioventricular block
delay in conduction from SA to AV. Travel is normal but pathway is delayed
PR interval is greater than 0.20 seconds
symptoms are not likely to occur
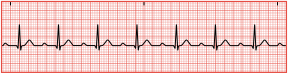
Second degree atrioventricular block type 1
Also known as Mobitz 1 or Wenckebach
nonconducted or blocked impulses from the AV to the ventricles which causes missing QRS complexes
PR interval gets progressively longer until a QRS is dropped and then the pattern repeats
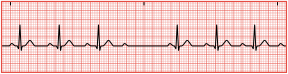
Second degree atrioventricular block, type 2
Also known as Mobitz 2
PR remain constant but there is a P wave and no QRS complex or T wave — AV node selectively block specific impulses
heart block tends to progress quickly into a complete heart block
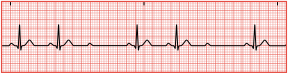
Third degree atrioventricular block
Complete heart block (CHP)
all electrical impulses that originate above the ventricles are blocked with no pattern to the cardiac cycle as the atria and ventricles are contracting independently.
atria contract at a normal rate but ventricles contract at 20 - 40 bpm depending on where pacemaker site is originating.
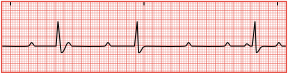
Ventricular fibrillation symptoms
dizziness, feeling of impending doom, chest discomfort, SOB, seizure activity
Ventricular tachycardia symptoms
drop in BP and consciousness bc of decreased cardiac output, VT can continue to produce a pulse but usually becomes pulseless or VF
dizziness, impending doom, chest discomfort, SOB
Causes of asystole
pulmonary embolism, large myocardial infarction, respiratory arrest (hypoxia), overdose
hypothermia, acidosis, electrolyte abnormalities, tension pneumothorax, trauma
myocardial ischemia
exhibited through ST segment depression of 1 mm or greater occurring in two contiguous leads or T waves
*contiguous leads look at the same part of the heart (2, 3, and AVF or V1, V2, and V3)
Ischemia persists: myocardial injury occurs —> T wave inversion can occur w/ or w/o ST elevation which is more indicative of injury,
STEMI
ST elevation myocardial infarction
Current injury to heart but tissue has not yet died
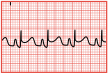
ST Segment depression
non-STEMI or NSTEMI
myocardial infarction with pathological Q wave changes in two or more continuous leads
Q wave will measure 0.04 seconds and will be equal or greater than one-third the height of the R wave