Experimental Design AP Biology Test
4.0(2)
Studied by 43 peopleCard Sorting
1/37
There's no tags or description
Looks like no tags are added yet.
Last updated 3:12 AM on 8/18/23
Name | Mastery | Learn | Test | Matching | Spaced | Call with Kai |
|---|
No analytics yet
Send a link to your students to track their progress
38 Terms
1
New cards
define independent variable
“you are changing” variable is manipulated or changed by the researcher. variable will vary between experimental groups
2
New cards
purpose of experimental design
to plan effective experiments that utilize the scientific method
3
New cards
describe a foundation of good science
an observation and testable question
4
New cards
steps of the scientific method
ask a question, background research, construct a hypothesis, test with experiment, analyze data and construct a conclusion
5
New cards
required parts of an experiment
hypothesis, independent variable, dependent variable, and constant variable
6
New cards
alternative hypothesis?
“If, then” statement
educated prediction about the results of the experiment
educated prediction about the results of the experiment
7
New cards
null hypothesis?
states that the independent variable has no affect on the dependent variable. A statistical hypothesis, assumed to be correct unless proven otherwise by data
8
New cards
main difference between a null hypothesis and an alternative hypothesis?
Null hypothesis does not affect the dependent variable, while the alternative hypothesis does.
9
New cards
define a dependent variable
“what is being measured” variable changes in response to the independent variable
10
New cards
define constant variable
variables that remain the same in every group of an experiment. essential to ensure that the changes in the DV are being caused by the manipulation of the IV
11
New cards
out of light intensity and plant growth, what is the IV?
light intensity
12
New cards
out of light intensity and plant growth, what is the DV?
plant growth- dependent on the light to grow bigger
13
New cards
out of light intensity and plant growth, what are a couple constant variables?
water, the same plant, the pot, soil
14
New cards
describe a positive control group
group that receives “normal” amount/ type of the independent variable
15
New cards
describe a negative control group
group that does NOT receive the IV at all
16
New cards
describe an experimental group
group that receives various amounts/types of the IV, that is DIFFERENT than the control group.
17
New cards
define the term sample size
all of the data points together/ number of individual items tested in an experiment
18
New cards
explain the relationship between the sample and statistical analysis.
the bigger the sample size= the better statistical analysis. the better statistical analysis= better support of the conclusion
19
New cards
what axis is the dependent variable labeled
Y
20
New cards
what axis is the independent variable labeled
X
21
New cards
what needs to be included when you label the axes
label the units
22
New cards
when should you use a bar graph?
when the IV is sorted into experimental groups or categories
23
New cards
when should you use a line graph?
when calculating the rate (rise/run) or wanting to find the overall trend
24
New cards
what is the purpose of a graph title
to describe what the graph is showing without giving information about the conclusions
25
New cards
Do you have to have a graph title on the AP test?
No
26
New cards
what are the parameters for scaling the graph
include all of the data points and should take up the entire area of the graph
27
New cards
what is the equation for scaling an axis
highest number/ the number of squares on axis
28
New cards
list the 4 steps for analyzing the graph using CER (Claim, Evidence, Reasoning)
1- identify the scientific question
2-make a claim
3- find evidence to support the claim
4-find reasoning that explains the relationship between the claim and the evidence.
2-make a claim
3- find evidence to support the claim
4-find reasoning that explains the relationship between the claim and the evidence.
29
New cards
purpose of calculating the mean?
tells you the “normal” or average of the collected data
30
New cards
what is the formula to find the mean?
sum of points collected/ # of points
31
New cards
difference between true means and sample means
the true means captured the means from every member, while sample means averages within individual experimental groups
32
New cards
what is the purpose of standard deviation as a statistical test
Quantifies the amount of variation in a data set; allows for comparison data within a sample to see if a certain point is statistical different than the average
33
New cards
purpose of standard ERROR of the mean test
to see the probability of capturing the true mean
34
New cards
what is better, a bigger or smaller SEM?
The smaller SEM= the more likely the sample mean matches the true mean
35
New cards
how to calculate +/-2 SEM, top and bottom?
top mean +2SEM; bottom mean -2SEM
36
New cards
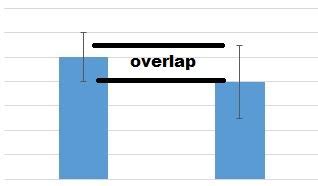
what does it mean if the error bars overlap between 2 groups
if they overlap, then the differences in the sample means are NOT statistically significant, possible for true means to be the same
37
New cards
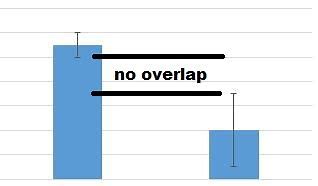
what does it mean if the error bars DO NOT overlap between 2 groups
differences in the samples means ARE statistically significant, leaving less than a 95% chance that the true means are the same for both groups
38
New cards
what is normalcy and why is it important?
normalcy within a data set is determined by calculating the mean, median, mode, range, and standard deviation of a sample. comparison of data points, confirmation of trends or patterns in the data and statistical analysis can only occur after establishing normalcy.