Lecture 4 (Statistical Significance)
1/33
There's no tags or description
Looks like no tags are added yet.
Name | Mastery | Learn | Test | Matching | Spaced | Call with Kai |
|---|
No study sessions yet.
34 Terms
Steps of a Study
1.) Research question and hypotheses
2.) How many people do you need to be able to test this hypothesis?
3.) Write protocol and get approvals to do study
4.) Enroll subjects
5.) Collect data
5.) Get results
7.) Draw conclusions
Before drawing conclusions…
we need to quantify random (sampling) error may occur for the results observed in any individual study (sample)
Statistical Inference
the process of quantifying random (sampling) error
Hypothesis
A predictive statement relationship between independent variables (exposure) and dependent variables (outcomes)
Is there an association between variables in study (hypothesis testing)
association = statistical relationship between variables
if the risk of disease is higher or lower in one group compared to the other
DOES NOT IMPLY SOMETHING CAUSES DISEASE
Null Hypothesis
no relationship between the exposure and outcome variables.
H(0): Risk Rato=1.0
Alternative Hypothesis (H(a))
there IS some relationship between exposure and outcome variables
Two Sided Alternative Hypothesis
occurrence of disease is not the same in the exposed and unexposed
H(a) Risk Ratio does not equal 1.0
One Sided Alternative Hypothesis
occurrence of disease in the exposed group is greater (or less) than the occurrence of disease in the unexposed group
H(a)
Risk Ratio > 1 or
Risk Ratio < 1
2×2 Table
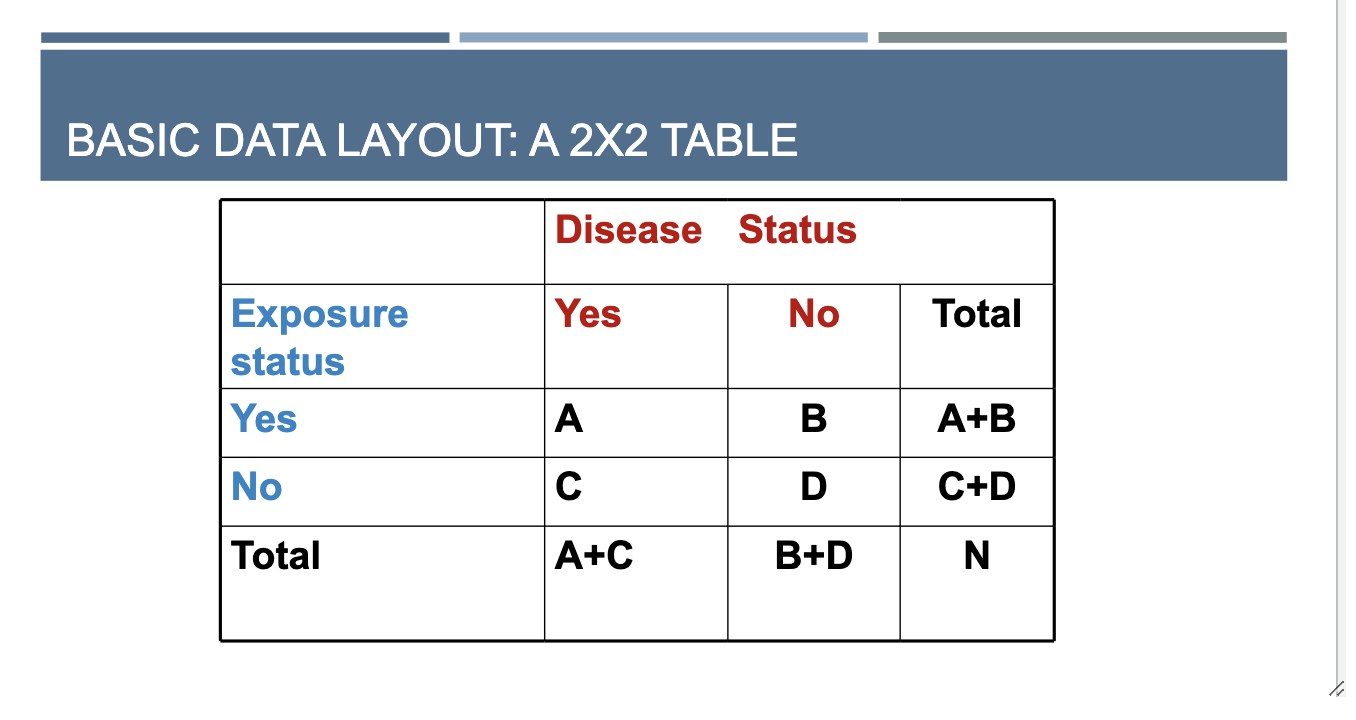
Disease in column; Exposure in rows
Measures of Association (statistical sig)
assess the strength of the statistical relationship between a given study factor and disease
Relative Risk
compares risk of exposed group relatively to the group of unexposed
The BIG Sentence
The risk of (disease) among the (exposed) is (X) times (higher/lower) than the risk of (disease) among (unexposed)
Risk Ratio Equation
risk in the exposed / risk in the unexposed
based on 2×2 table
= A/ (A+B) / C/C+D)
Analysis of Risk Ratio
If the null value is less than 1.0 it is PROTECTIVE
If null value is greater than 1.0 it is HAZARDOUS (range is wider numerically but same MAGNITUDE can be presented from both protective and hazardous)
If null value = 1.0 it has NO EFFECT
Interpretation of Risk Ratio, Odds Ratio, Hazardous Ratio
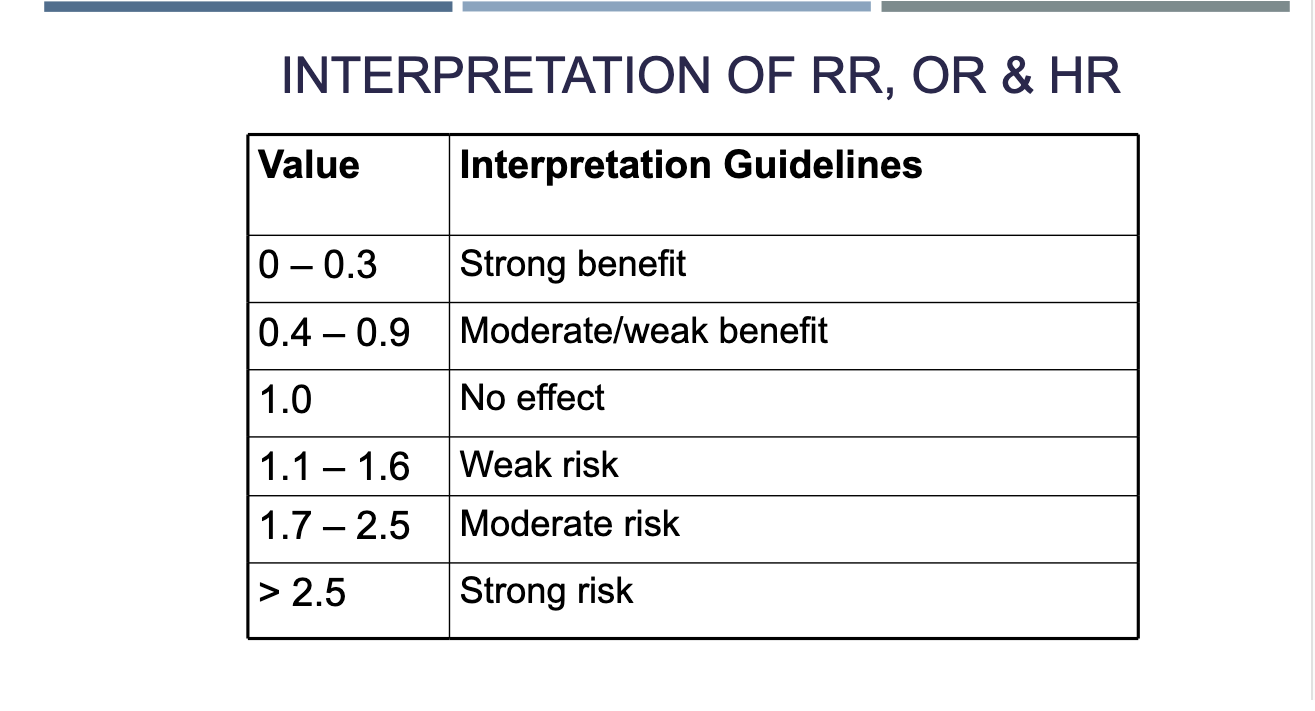
Relative Risk between 1.0 and 2.0
RR-1.0 = % increased risk
Relative Risk > 2.0
RR number= number of times increased risk
ex. 3 times increased risk of disease if exposed
Relative Risk < 1.0
1.0-RR=% decreased risk
Risk Difference
the number of cases of disease among the exposed that would not occur if the exposure was eliminated
The role of chance
principle assumption that the measures of disease frequency is what we draw inferences of an entire pop based on evaluation of only a sample.
Quantify Chance
quantify the degree to which chance may account for the results observed
a measure that is reported from all tests of stats sign is the p-value
Interpretation of p-value
The p-value is the probability of obtaining a result at least as extreme as that observed in the study by chance alone.
p value is based on null hypothesis
P values are influenced by…
both magnitude/strength of the association AND the sample size
P value- Large Sample Size
a small difference may be statistically significant
P value Small sample size
a large difference may not achieve statistical significance
If p value small
reject null hypothesis ( less than 0.05)
“statistically significant”
Confidence Intervals
having a range to have a level of certainty for our Risk Ratio
95% of the confidence interval formed containing the TRUE vale (especially when repeating the same procedure)
how good is our estimate
Confidence Interval Wider Intervals
less precision
Narrower Intervals
more precision
If interval contains null value
the result is NOT statistically significant
If the interval does not contain the null value
the result IS statistically significant
If p-value is < 0.05
the confidence interval will NOT contain the null value
if p-value is > 0.05
the confidence interval WILL contain the null value