Biostatistics- Pearson Correlation
1/21
There's no tags or description
Looks like no tags are added yet.
Name | Mastery | Learn | Test | Matching | Spaced |
|---|
No study sessions yet.
22 Terms
correlation
Measures the strength and direction of the association between 2 continuous variables (interval or ratio)
correlation examples
-height and weight
-A1c and systolic blood pressure
-Supply and price
What are the 2 different types of correlation
-Pearson Product-Moment correlation
-Spearman Correlation
Pearson product-moment correlation goal
to asses the degree that quantitative variables are linearly related
What kind of variables are used in a Pearson Product-Moment Correlation
2 continuous variables with equal distance between them
effect size statistic
Pearson Correlation coefficient (r)
What is the correlation coefficient of a Pearson Product-Moment Correlation?
r
What is the range of the Pearson Correlation Coefficient (r)? What do these values mean?
Range = +1/-1
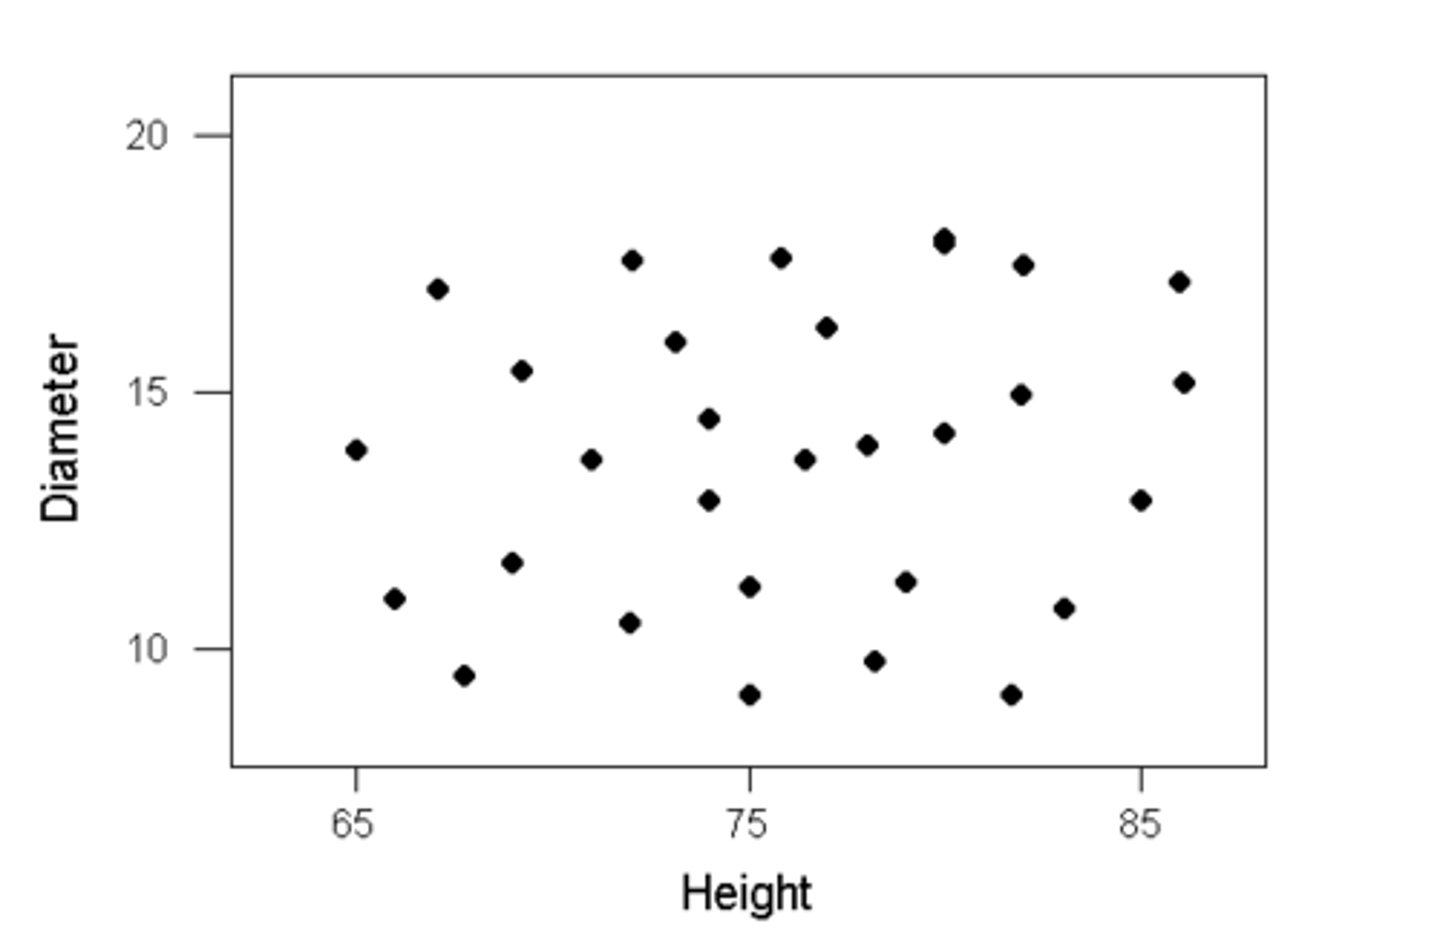
0 = no association
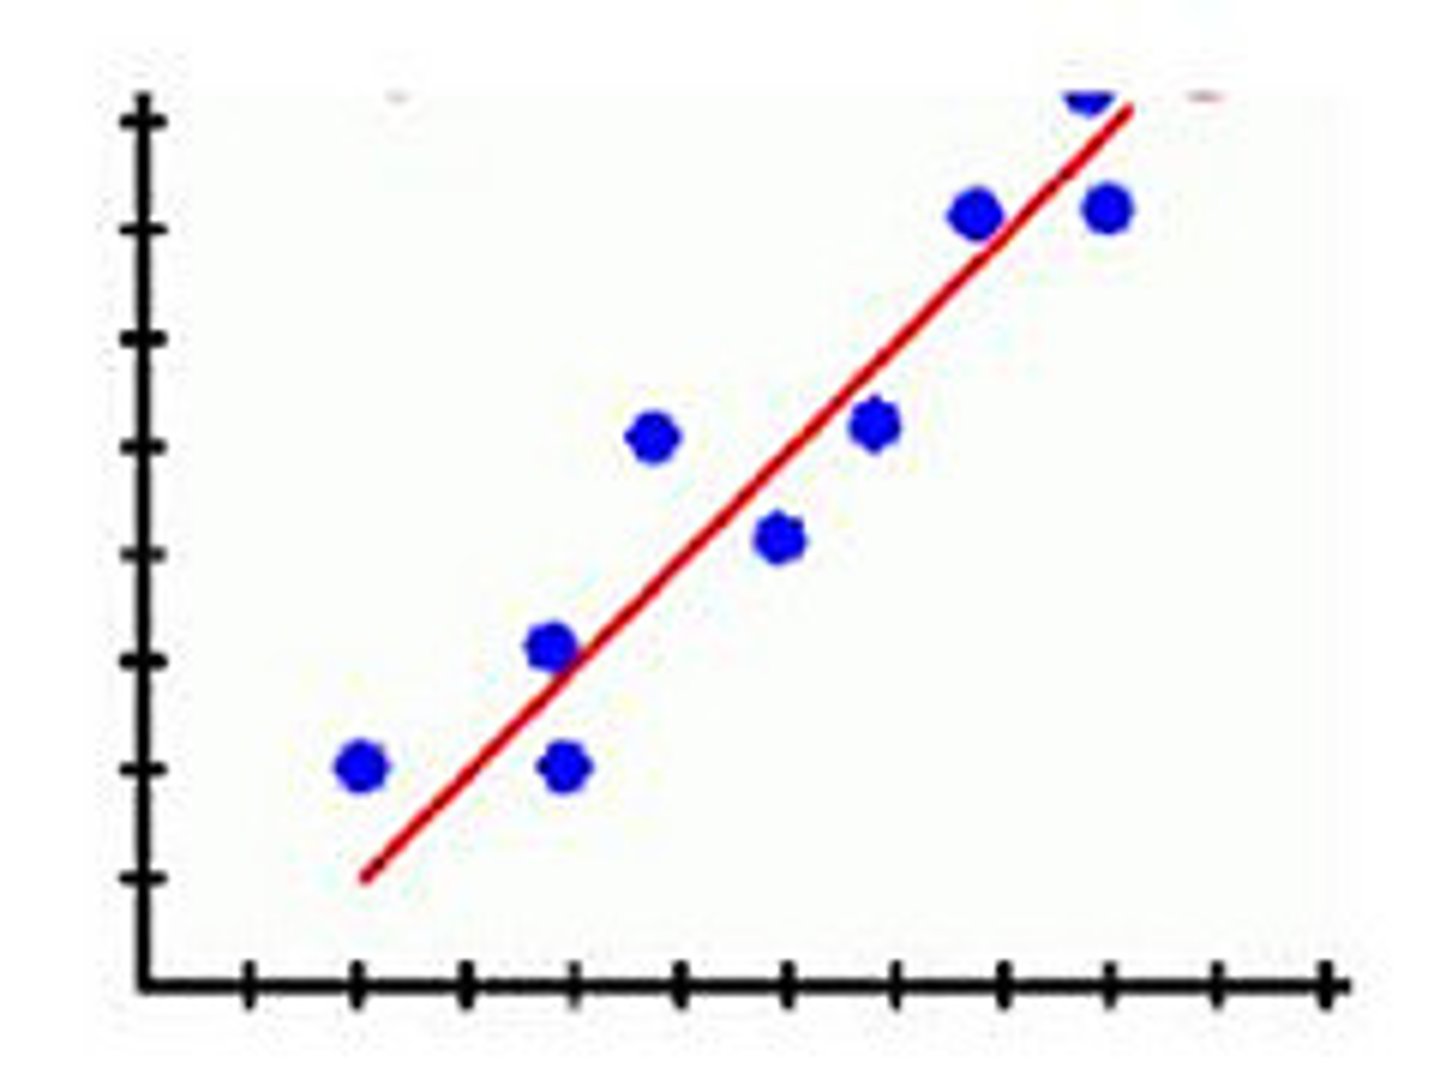
+1 = positive association
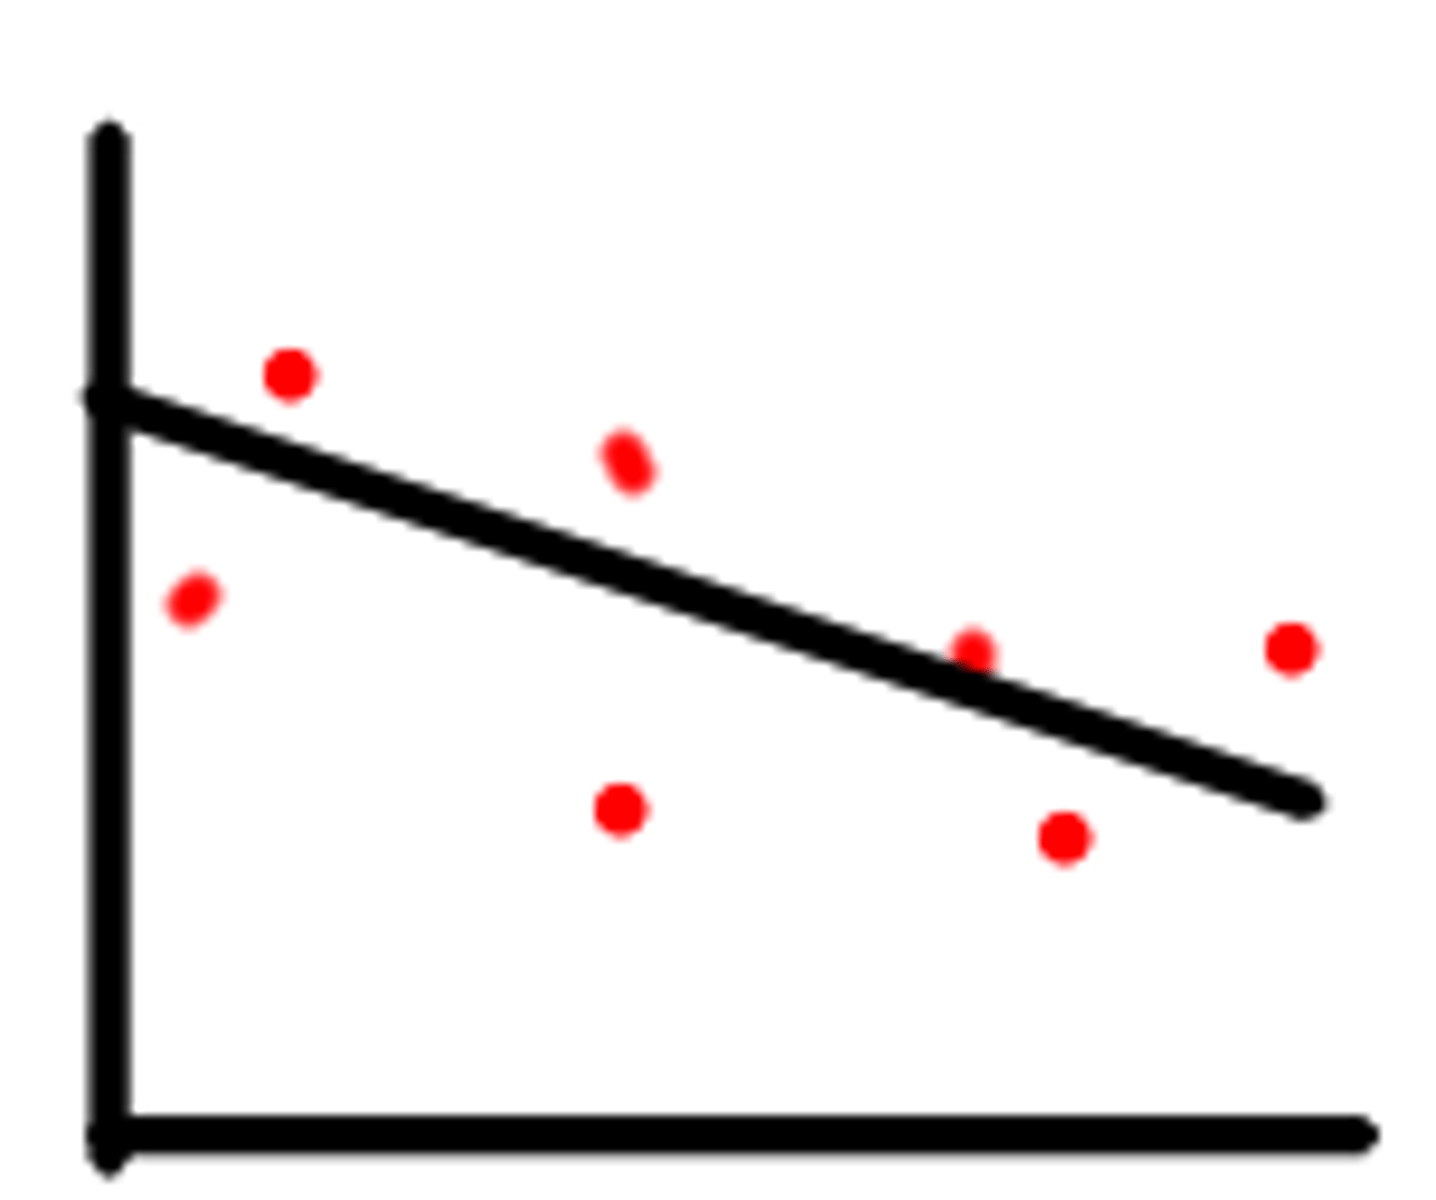
-1 = negative association
*the higher the number, the stronger the correlation
Assumptions of the Pearson Correlation
-variables are normally distributed (skewness/ kurtosis)
-linear relationship
-cases represent a random sample from the population and the scores on variables of one case are independent of scores on these variable for other cases
Positive correlation graph
Negative correlation graph
no correlation graph
Strength of the correlation coefficient (r) values and what they mean
0 = no association
+/- 0.1= weak association
+/- 0.3= moderate association
+/- 0.5 = strong association
which correlation is stronger?
(-0.75)
(+0.25)
(-0.75)
Pearson null hypothesis
H0: rxy = 0
-population correlation is zero
-there is no relationship between x and y in the population
Pearson Alternative Hypothesis
H1: rxy =/ 0
-population correlation is NOT zero
-there is a relationship between x and y in the population
-could be positive or negative
Pearson write up equation
r (df) = r value, p value
Pearson degrees of freedom
N-2
What does N stand for?
sample size
How to do the full write up for the Pearson correlation
The (strong/moderate/weak) correlation between (variable 1) and variable 2 (was/ was not significant) (equation).
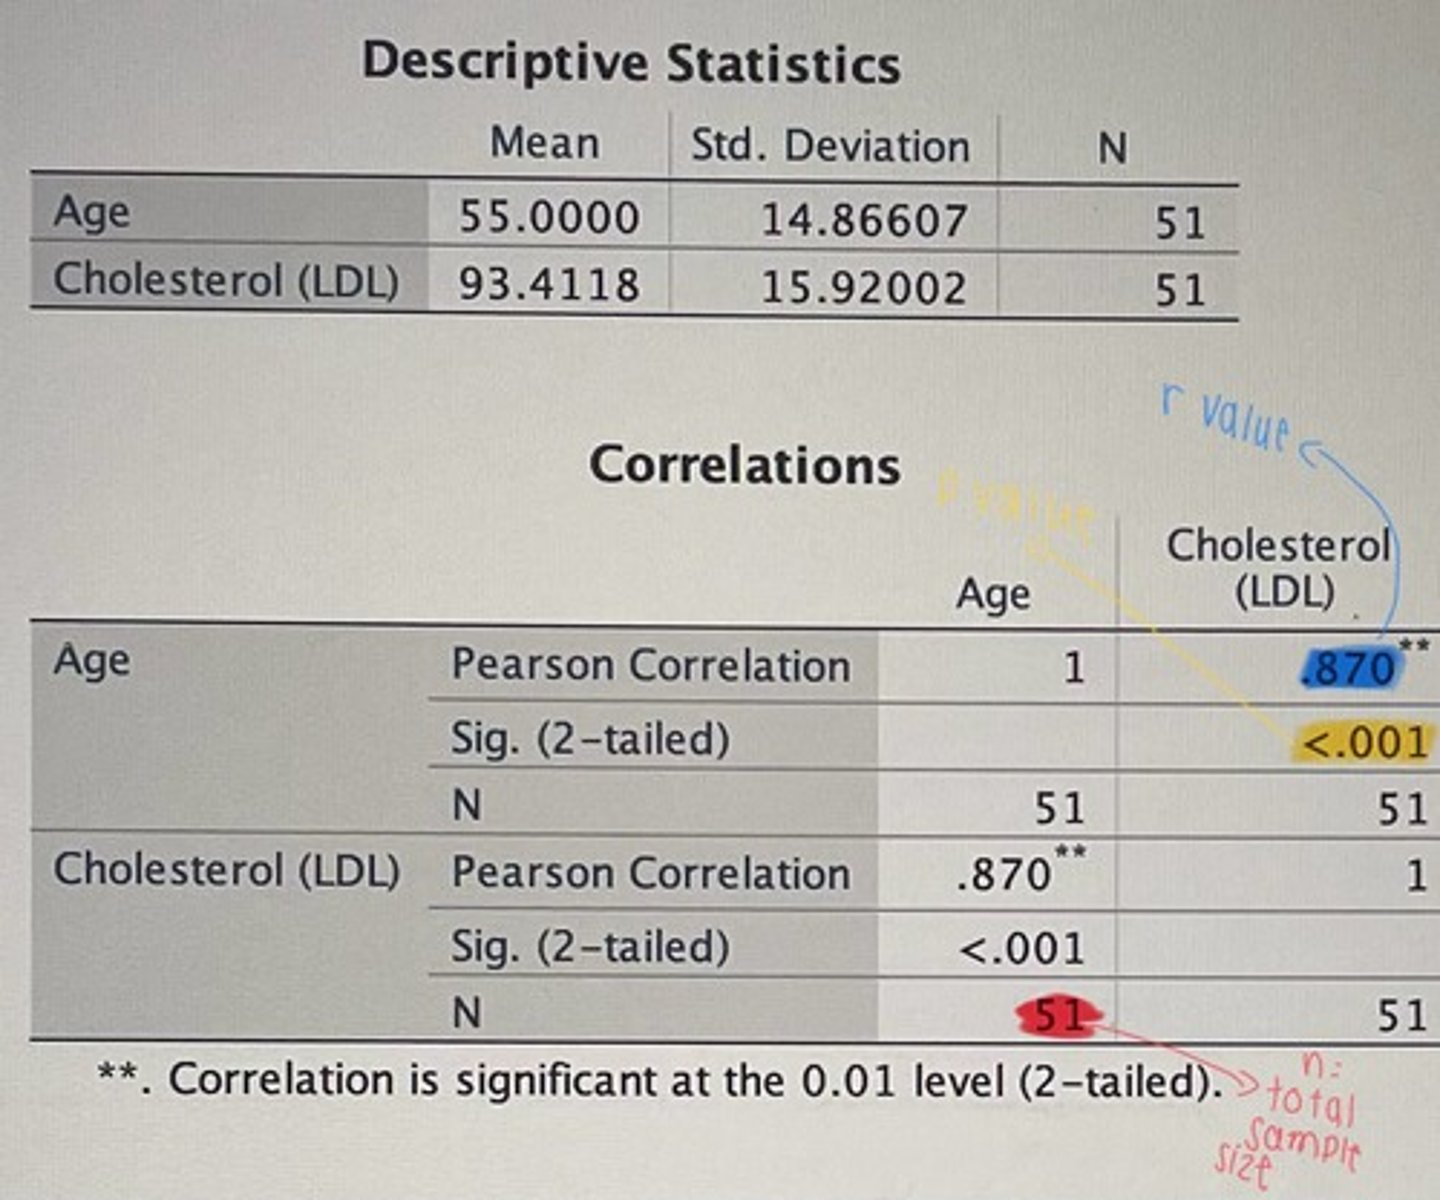
Write Up example: Is there a relationship between age and LDL cholesterol?
The strong positive correlation between age and LDL cholesterol was significant r (49) = .87, p<.001
Correlation does not equal...
causation