gov stocks
1/38
There's no tags or description
Looks like no tags are added yet.
Name | Mastery | Learn | Test | Matching | Spaced |
|---|
No study sessions yet.
39 Terms
Stock Market
A marketplace where stocks are bought and sold.
Stocks vs Shares
stocks represents ownership in a corporation vs share is a single unit of stock
Equity
net worth of a company (owners stake after all debts have been paid)
aka shareholder’s equity
aka total ownership of all the shares
shareholders
individuals that own shares of stock in a company
major exchanges
NYSE (New York Stock Exchange)
NASDAQ (National Association of Securities Dealers Automated Quotations)
where stocks are listed, bought, and sold
initial public offering (IPO)
The first sale of a company's stock to the public
Process:
Underwriting: Investment banks assess the company's value and assume the risk of selling the shares.
Pricing: The company and underwriters determine the initial share price based on demand, valuation, and market conditions.
Going Public: Shares are listed on a major exchange (e.g., NYSE or NASDAQ) and become available for public trading.
Brokers vs Trading Platforms
Broker: Facilitates buying/selling securities for a fee
Online trading platforms: Digital trading interfaces
commission
a fee charged by a broker for executing a trade
brokerage account
a type of financial account that investors open with a brokerage firm to buy, sell, and hold securities
supply and demand stock
Stock prices change constantly due to the forces of supply and demand in the market. When more people want to buy a stock (demand) than sell it (supply), the price goes up, and vice versa.
Company Performance: Includes earnings reports, revenue growth, management effectiveness, and overall financial health.
Market Sentiment: The overall attitude of investors toward a particular stock or the market as a whole, influenced by news, economic data, and global events
TTM
trialing 12 months (came from the last year, every day it’s being updated)
MRQ
most recent quarter
FY
fiscal year
stop loss order
an order to sell a stock when it reaches a specific price to llimit proportional losses
1. Understanding Indices
A stock market index measures the performance of a specific group of stocks, representing a segment of the market. Investors use indices to:
Track market trends
Benchmark their portfolio performance
Understand the economic climate
Diversification and the benefits
strategy of spreading investments across various assets (e.g., stocks, bonds, sectors, geographies) to minimize exposure to any single risk.
Benefits
Reduces portfolio volatility – if one asset underperforms, others may offset the loss.
Improves long-term stability – smoother returns over time.
Avoids concentration risk – protects from the collapse of a single company or sector.
long term investing
Buy and hold strategy.
Focuses on growth over years/decades.
Takes advantage of compounding returns and market rebounds.
best way
short-term investing
Capitalizes on market movements over days, weeks, or months.
Requires more active monitoring and risk tolerance.
May use strategies like swing trading or options trading.
Day Trading
Buying and selling stocks within the same trading day.
Very risky and speculative.
Requires technical analysis and strict discipline
blue cfhip stocks
Large, established companies with reliable performance.
Often pay dividends.
Examples: Coca-Cola, Johnson & Johnson, Procter & Gamble.
growth stocks
Companies expected to grow revenue and earnings rapidly.
Reinvest profits instead of paying dividends.
Higher potential returns but more volatility.
Examples: Tesla, Shopify, Nvidia.
ETFs (Exchange-Traded Funds) vs mutual funds
ETFs (Exchange Traded Funds) and mutual funds are both investment vehicles that pool money from multiple investors to create a diversified portfolio.
ETFs
Trade like stocks: ETFs are bought and sold on stock exchanges throughout the trading day, just like individual stocks.
Typically passively managed: Most ETFs track a specific index, like the S&P 500, and aim to replicate its performance rather than trying to outperform it.
Lower fees (less management)
Tax-efficient, generate fewer capital gains distributions.
No minimum investment: You can buy an ETF with as little as the price of one share.
Mutual Funds
Bought and sold at the end of the trading day: Mutual funds are priced and traded only once per day, after the market closes, at their net asset value (NAV).
Can be actively or passively managed: Mutual funds can be either actively managed by a fund manager who selects investments to try and beat the market, or passively managed to track an index.
Higher fees than ETFs due to the cost of research and trading.
Generate more taxable capital gains distributions for shareholders.
Minimum initial investment, which can range from a few hundred to several thousand dollars.
Simple Analogy
Think of it this way:
ETF: Like buying a pre-made basket of goods - you know what's inside and its price changes throughout the day based on market demand.
Mutual Fund: Like ordering a custom-made basket of goods - you may have some say in what's included, but you won't know the final price until it's ready at the end of the day
what are funds
investment vehicles that pool money from many investors to buy a variety of securities, including stocks, bonds, and other assets. diversification and professional management allowing investors to invest without having to sell individual stocks
market capitalization
total value of a company’s outstanding shares
Formula
Market Cap = Stock Price × Number of Shares Outstanding
Small-cap: <$2 billion
Mid-cap: $2–10 billion
Large-cap: >$10 billion
Used to classify companies for investing strategies.
p/e ratio (price to earnings ratio)
Definition
Valuation metric indicating how much investors are willing to pay for $1 of a company’s earnings.
Formula
P/E = Stock Price ÷ Earnings Per Share (EPS)
High P/E: Investors expect high growth (e.g., tech companies).
Low P/E: Could indicate undervalued or slow-growing stock.
dividends
Portion of profits paid to shareholders, usually quarterly, as a reward for investing
A sign of company stability and profitability.
Not all companies pay dividends (e.g., growth companies often don’t).
Example: Johnson & Johnson has increased its dividend for decades.
52-Week High/Low
The highest and lowest price at which a stock traded in the past 12 months.
Helps evaluate stock volatility, resistance/support levels, and timing.
P/B Ratio (Price-to-Book)
The P/B ratio compares a company's market value to its book value.
Market Value = What investors think the company is worth (based on stock price).
Book Value = What the company is actually worth on paper (assets - liabilities), according to its financial statements.
Formula: Market Price ÷ Book Value (assets - liabilities).
P/B < 1: The stock is trading for less than its book value. It might be undervalued — but could also mean the market expects trouble.
P/B > 1: Investors are willing to pay more than book value — often the case for companies with strong brand value, innovation, or growth potential.
ROE (Return on Equity)
ROE measures how well a company uses shareholder money (equity) to generate profits. It's a key indicator of financial efficiency.Jul 18, 2024 — Return on equity (ROE) is a measure of a company's financial performance. It is calculated by dividing net income by shareholders' equity.
Formula: Net Income ÷ Shareholder’s Equity.
Higher ROE = More efficient at turning investment into profit.
Lower ROE = Less efficient, might signal problems or underperformance.
Combination Analysis:
of p/b and roe
High P/B + Low ROE = Overvalued
High P/B + Low ROE = Overvalued
The market is pricing the company expensively (high P/B),
But it’s not using its capital efficiently (low ROE).
🚩 This might indicate overvaluation – investors may be overpaying for a business that isn’t performing strongly.
Low P/B + High ROE = Undervalued
Low P/B + High ROE = Undervalued
The market is pricing the company cheaply (low P/B),
Yet it’s performing well (high ROE).
✅ This could signal an undervalued opportunity – a profitable company that the market hasn’t yet fully appreciated.
order types
Market Order: Executes immediately at best current price.
Limit Order: Only executes at your chosen price or better.
Stop-Loss Order: Automatically sells a stock when it hits a specified low to prevent further loss.
13. External Factors Influencing the Market
Economic Indicators
GDP: Measures economic output; higher GDP = stronger economy.
Interest Rates: Lower rates encourage borrowing/investing; higher rates slow inflation.
Global Events
Political instability, wars, natural disasters can cause rapid market changes due to uncertainty.
14. Inflation and Interest Rates
inflation: Reduces money’s purchasing power; can hurt savings.
Interest Rates: Set by central banks; affect mortgages, loans, and investment returns.
As inflation rises, central banks often raise interest rates to cool spending.
gross domestic producs
a measure of the total monetary value of all final goods and services produced within a country's borders during a specific period
personal consumption
government spending
buisness investment
exports/imports
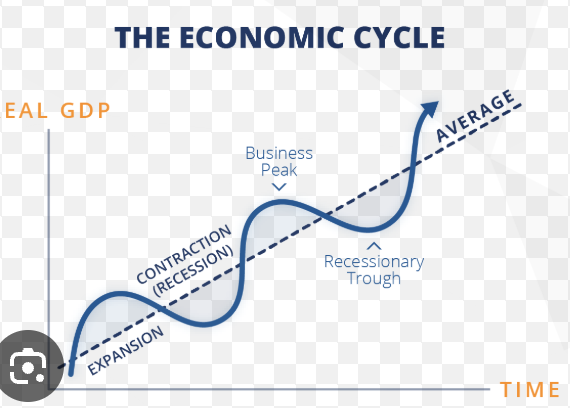
gdp in a buisness cycle
when gdp is positive the buisness cycle is above the line, when it’s negative, it’s in a depression and below the line
negative sign ofr econoy
when buisnesses inves less, instead of deciding to save for a rainy day, this could lead to less expansion or contraction
when there are higher interet rates, people less likely to buy, demand goes down, leads to contraction
variables thatcan affecgt the cycle
consumer expectiations:
savings: peole begin worry about the economu so they start saving, taking money out of the economy - contracition
external shokcks
wars, natural disasters
major indicies
indices are tools that track the performance of a group of assets, like stocks, bonds, or commodities.
Dow Jones Industrial Average (DJIA)
Tracks 30 large, established U.S. companies (e.g., Apple, McDonald's, Boeing).
Price-weighted: Stocks with higher prices influence the index more.
Represents traditional, blue-chip companies.
S&P 500
Covers 500 of the largest U.S. publicly traded companies across various sectors.
Market cap-weighted: Larger companies have a bigger effect.
Often considered the best indicator of the overall U.S. stock market.
NASDAQ Composite
Includes over 3,000 stocks, with a strong focus on technology and innovation.
Market cap-weighted, like the S&P.
Dominated by companies like Apple, Amazon, Tesla, and Microsoft
stocks vs bonds
Stocks
Represent ownership or equity in a company.
Shareholders can potentially benefit from the company's success through dividends (a portion of company profits) and capital gains (selling the stock at a higher price than the purchase price).
Stock prices are influenced by factors such as company performance, economic indicators, market sentiment, and industry trends.
Historically, stocks have offered higher potential returns compared to bonds, but also come with greater volatility and risk of loss.
Bonds
Represent a loan from an investor to a borrower (typically a company or government).
Bondholders get interest + the amount of money they gave
Bond prices are influenced by factors like interest rates, creditworthiness of the issuer, and time to maturity.
Bonds generally offer lower potential returns than stocks, but are typically considered less risky and provide a more stable income stream.