Option F- Food and Health
1/28
Earn XP
Description and Tags
Name | Mastery | Learn | Test | Matching | Spaced | Call with Kai |
|---|
No study sessions yet.
29 Terms
average available calories per person
approximately just under 2000 calories per day → lower in some areas
easier to get data on what daily calories are available than on what people actually consume
obesity > 30 BMI
overweight > 25 BMI
difference between adequate nutrition and adequate calories
Nutrition Transition Pattern 1
Hunter gatherer
active lifestyle
diet rich in fibrous plants, lean game protein
Nutrition Transition Pattern 2
daily agriculture
famine common
slows individual growth, decreases body fat
Nutrition Transition Pattern 3
end of famine
famine recedes as income rises and nutrition improves
Nutrition Transition Pattern 4
overeating, obesity related diseases
income rises = access to abundance of high calorie foods
automation = less active
increase in obesity and related diseases eg heart diseases
Nutrition Transition Pattern 5
behaviour change
response to increasing obesity
change in behaviour eg lower calorie foods, more exercise
community, individual
One detailed example of a vector-borne disease
Malaria:
caused by phasmodium bacteria spread by anopheles mosquitos
found in tropic/subtropic regions
warm, humid climates = mosquito habitats
stagnant water bodies spread it, poor sanitation
impacts
causes anemia, organ failure- high mortality rate particularly in children
burdens healthcare system
mitigation:
protection from bites
vaccination
education
One detailed example of a water-borne disease
Cholera:
acute diarrhoeal infection
caused by water or food contaminated with vibrio cholerae bacteria)
affects areas with poor sanitation, inadequate drinking water, highly populated
impacts
rapid acting
severe dehydration, inflammation, diarrhoea
strains healthcare resources
mitigation:
improved hygiene, sanitation
good quality healthcare
education
International diets: Mediterranean
seasonal diet eg “horta” time of herbs
olive oil, vineyards
community/cultural knowledge of wild resources
polyculture- different plants grow together to cycle soil
happy culture, food is central to community
balance and moderation- alcohol, roll own cigarettes
International diets: Hadza, Tanzania
strictly only hunting and gathering
make fire to smoke out bees and gather honey and honeycomb - rich in nutrients, high energy
eat everything on the spot (except for the elderly and babies)
smoke a lot of marijuana → non processed drugs
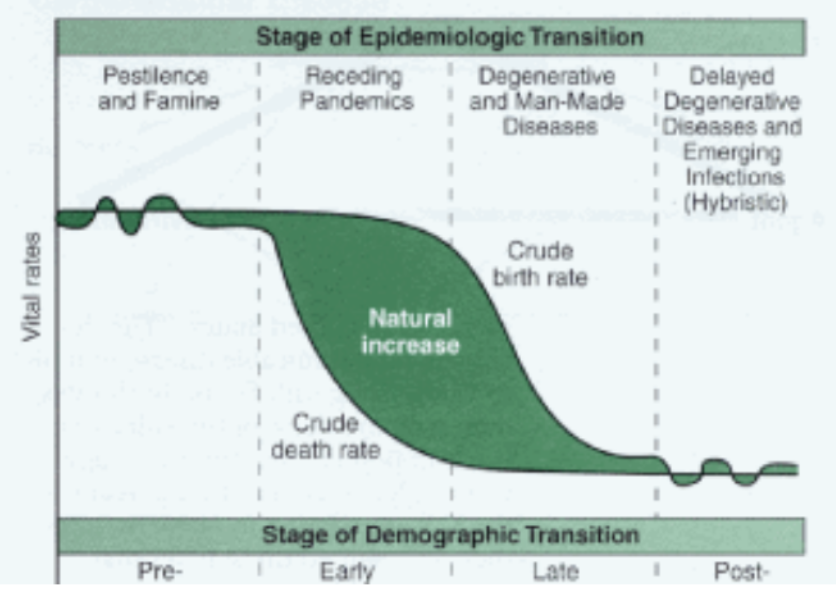
Epidemiological Transition Model
famine → birth and death rate oscillating, population low
receding pandemic → death rate drops, population begins to increase
Human induced disease → birth rate drops, death rate plateaus, population rapidly increases
era of tech, improved quality of life → death rate plateaued, birth rate declining, population plateaus
unknown → birth rate lower than death rate, population falls

The disease continuum
disease of poverty ← → disease of affluence
poverty
sanitation, hygiene, water, inadequate nutrition, pests, lack of knowledge, no prevention
communicable
affluence
overconsumption, lifestyle, environment, longevity (diseases of age)
non-communicable
Burden of disease
mortality- deaths
morbidity- those suffering from disease but alive
combined = burden of disease
measures all those not living in good health
DALY Index
Disability Adjusted Life Years Index
one DALY = one lost year of healthy life (through disability or premature death)
high DALY = lots of years lost = high morbidity in the area
accounts for years expected to live in good health
Diffusion (generally)
the spread of a phenomenon, such as an idea or technological innovation (innovative diffusion), or a disease (contagious diffusion), over space and time
expansion diffusion
spread to new places while staying strong in original location
relocation diffusion
move from one location to another via human means, unnaturally spreading idea or disease
Pandemic
sickness that kills millions globally
zoonotic virus
spread from animals to humans eg Swine Flu, SARS
Disease Case Study: H1N1 Swine Flu
bird flu and human flu mutated in a pig in 1918
killed 30-100 million people, airborne
aka the Spanish Flu
Disease Case Study: SARS
Severe Acute Respiratory Syndrome
started in a wet market
spread by contagious people flying to the aero hub of Hong Kong
Spread by air through Hong Kong apartments
HALE Index
Healthy Life Expectancy at Birth
average number of years a person can expect to live in full health
pattern: just over 60 years in health, 10 in disability
trends: Healthy life expectancy increasing, years in disability staying the same
Infant Mortality
deaths per 1000 live births
pattern: below 30/1000 globally
declining steadily since 1990
maternal mortality
number of maternal deaths/number of live births x 100,000
pattern: currently at 223/100,000
trends: declined 34% between 2000-2020, yet rising in some areas
Access to sanitation
facilities for clean water, safe disposal of waste
pattern: 3.5 billion people lack sanitation
trends: since 2000, 2.5 billion people gained access to sanitation
Ratio of doctors/people
physicians per 1000 people
pattern: 2020 average 3.65 doctors per 1000 across 27 countries
trends: most OECD countries- number of doctors is increasing more rapidly than population
GFSI Index
Global Food Security Index
measures affordability, availability, quality/safety, sustainability/adaptation
pattern: ranked- HICs score higher, climate (change) has impact on food security
trends: food security rose between 2012 and 2015, but has been dropping since 2015
GHI Index
Global Hunger Index
weighting: 1/3 undernourishment, 1/6 child stunting, 1/6 child wasting, 1/3 child mortality
pattern: 43 countries in “alarming”/”serious” categories, 58 will fail to reach “low” by 2030
trends: 18 countries with “moderate”/”serious”, “alarming” have improved between 2015 and 2023
slowed by external crises
malnutrition
weight and muscle deterioration, inadequate nutrition
375 million suffering worldwide
decreasing over time slowly