Motya Trading
 Call Kai
 Learn
Learn Practice Test
 Spaced Repetition
 Match
Match Flashcards
 Knowt Play
1/18

There's no tags or description
Looks like no tags are added yet.
Name | Mastery | Learn | Test | Matching | Spaced | Call with Kai | Chat |
|---|
No analytics yet
Send a link to your students to track their progress
19 Terms
Long
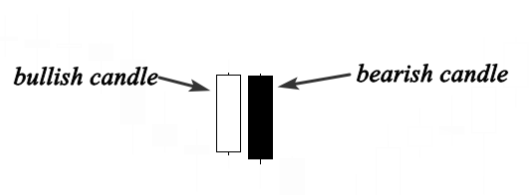
Long bodies refer to strong buying or selling pressure, if there is a candlestick in which the close is above the open with a long body, this indicates that buyers are stronger and they are taking control of the market during this period of time. If it is a bearish candlestick, a long body indicates that sellers are stronger and taking control of the market at this time.
Short
Short bodies indicate little buying or selling activity.
Upper Shadow
Session High
Lower Shadow
Session Low
Long Upper Shadow Short Lower Shadow
If a candlestick has a longer upper shadow, and short lower shadow, this means that buyers flexed their muscles and bid price higher. But for one reason or another, sellers came in and drove price back down to end the session back near its open price.
Long Lower Shadow Short Upper Shadow
If a Japanese candlestick has a long lower shadow and short upper shadow, this means that sellers flashed their washboard abs and forced price lower. But for one reason or another buyer came in and drove prices back up to end the session back near its’ open price.
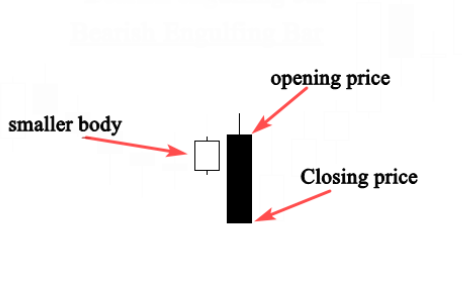
Bearish Engulfing Bar
-Tells us that sellers are in control of the market
-When this happens at the end of an uptrend, it means that buyers are engulfed by sellers and the trend will reverse
-Sellers are trying to push the market down bc buyers are not in control

Bullish Engulfing Bar
-Sellers are no longer in control and buyers will take control
-When this happens at an uptrend, it is an indicator that the price will keep going UP
-If it forms at a downtrend, it will have a powerful reverse because it represents a capitulation bottom (when investors sell their losses)
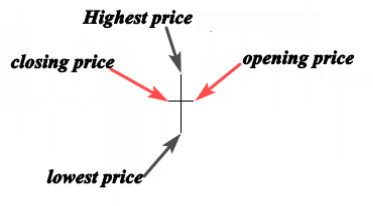
Doji
-Opens and closes at the same price, which means nobody is in control
-If this happens on a uptrend or downtrend, the market is likely to reverse
-If you are riding the trend, take profit

Dragonfly Doji
-Bullish
-Open and close are the same
-Long Lower Tail showing buyers resistance and their attempt to push it up
-This may show that the direction of a trend can be nearing a major turning point.
-When it occurs on a downtrend, it may be a bullish reversal signal
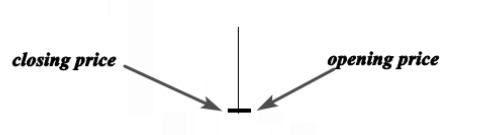
Gravestone Doji
-Bearish
-Buyers pushed prices way above the open, but sellers push the price back down.
-Shows that the bullish are losing their momentum and market is ready for reversal
-For this to be RELIABLE, it must occur on a resistance level (“The Ceiling”)

Morning Star
First Candle: Bearish; shows that sellers are still in control.
Second Candle: Bullish or Bearish; indecision
Third Candle: Bullish; Trend Reversal Signal
This is a bullish reversal pattern that occurs at the bottom of a downtrend

Evening Star
First Candle: Bullish; shows that sellers are still in control.
Second Candle: Bullish or Bearish; indecision
Third Candle: Bearish; Trend Reversal Signal
This is a bearish reversal pattern that occurs at the top of an uptrend

Hammer (Bullish Pin Bar)
-Shows that buyers want to push the market up
-When at a downtrend, it indicates a trend reversal

Shooting Star (Bearish Pin Bar)
-Shows that sellers want to push the market down
-When at uptrend, indicates trend reversal
-When it forms near a resistance level it should be taken as a high probability set up.

Harami Bearish
-The Harami pattern is valid when the second candle closes inside of the first “mother” candle
-Market is in indecision
-Bearish reversal when at the top of an uptrend
-When this happens during a down trend, it is a continuation pattern
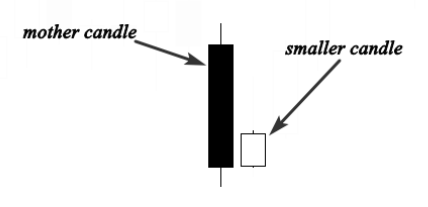
Harami Bullish
-The Harami pattern is valid when the second candle closes inside of the first “mother” candle
-Market is in indecision
-Bullish reversal when at the bottom of a downtrend
-When this happens during a uptrend, it is a continuation pattern

Tweezer Bottom
-Bullish reversal pattern
-Sellers are pushing market down with bearish candle, but next candle buyers pushed market back up with a bullish candle
Tweezer Top
-Bearish reversal pattern
-Buyers are pushing market up with bullish candle, but next candle sellers pushed market back down with a bearish candle