Machine Learning - Test 1
1/144
There's no tags or description
Looks like no tags are added yet.
Name | Mastery | Learn | Test | Matching | Spaced |
|---|
No study sessions yet.
145 Terms
f: X → Y
Where X is the __
Domain (math)
Parameter Type (CS)
Input Type (engineering)
Key Type (map ADT)
Supervised vs Unsupervised
Supervised we provide input and output while unsupervised only provides input
Data
the information that the model uses to learn patterns and make predictions
f: X → Y
Where Y is the __
Codomain (math)
Return Type (cs)
Output Type (engineering)
Value Type (map ADT)
Model
The function/program/tool we want to make
Observations/Data Points
The values of a domain of a model
Targets
Values of a codomain of a model
Datasets
Collection of observations collated with targets that once trained can predict new targets when given new
Dimensionality
number of features/attributes of data
Regression
predicting a continuous #
Target type is real #’s
Y = R
Classification
Y is a finite set
Target values are labels/classes/categories/tags
Binary Classification
Only 2 outcomes
|Y| = 2
{T,F} , { 1, 0}, {1, -1}
Density estimation
Target type is [0,1]
(every value in between 0 and 1)
Model Family
General form for a class of models
we try to predict the family to extract something
Model Family example
Linear family would be y = C0 + C1x
Parameters (weights/coefficients)
constants used to specify a model in a model family
Parameters example
In model family : y = C0 + C1x
C0 = 5, C1 = 2 are the parameters
Model example
In model family : y = C0 + C1x
y = 5 + 1.75x
Hyperparameters
variables to specify options in a training alg
Training/learning/fitting
Finding parameters to specify a model
Error/Loss Function
Function chosen to evaluate the model
lower values = better
Training Set
Portion of data used for training vs testing
Generalization
How well does the model do on data it wasn’t trained on
Overfitting
Model is strict to the training data
A data point in the training set or test set
observation
An input value to the model
Observation
An output value of the model
Target
A “correct answer” to a data point in the training set or test set
Target
A RD vector
Observation
When the function we're looking for is R^D->{-1, 1}.
Binary Classification
When the function we're looking for is R^D -> R.
Regression
When the function we're looking for is R^D -> Y for some finite set Y.
Classification
When the function we're looking for is R^D -> [0, 1]
Density Estimate
When we want to model a real-valued function.
Regression
When we want to model a probability distribution.
Density estimate
When we want to associate each observation with one of a finite set of labels or categories.
Classification
Variable
contains all values that measure the same attribute across units
Observation
contains all values measured on the same unit (row)
Attribute
A column/instance variable
Feature
value in a column, value of an instance variable
Value
element in the table, measurement, datum, feature
Tidy data
each var forms a column
each observation forms a row
each type of observational units forms a table
Feature Selection
The process of transforming the dataset by keeping only the most informative features
Curse of dimensionality
The phenomenon of the difficulty of training accurate models increasing with the dimensionality of the data
N
# of observations
D
# of attributes (dimensionality)
General - X
data set as NxD matrix
General - y
N length vector of target values
General - n
used as an index into the data set, for example Xn and ⃗yn
General - i and j
used as indices into features, for example ⃗xi where ⃗x = Xn
What is the idea behind K nearest neighbors?
With classification, its most likely items from the same class are next to one another → when classifying a new item look at the classes of its k nearest neighbors to determine
KNN algorithm
compute all distances between new data point and X
sort by the distances calculated
take the closest k distances
use array bag to tally their classes
Return class w/ highest tally
KNN - Cost
Depends on size of D:
Distance computations - O(ND)
Sort distances - O(NlgN)
total : O(ND+NlgN) → O(NlgN)
What are the hyperparameters of KNN?
The number of neighbors
The distance metric
KNN - when k = 1
The model perfectly memorizes the data.
Highly sensitive to noise (one wrong neighbor ruins the classification).
Very low bias, high variance → Overfitting.
KNN - when k = N
Every query is classified based on the majority class in the entire dataset.
Ignores local structure → Underfitting.
Why is KNN non-parametric
It does not assume a fixed form (parameters) for the decision boundary. It memorizes training data and bases predictions on local neighborhoods.
Metric or Distance Function
Any function d between two vectors where:
d(x,y) = d(y,x)
d(x,z) <= d(x,y) + d(y,z)
d(x,y) = 0 iff x=y
What are Norms?
they measure vector magnitude (size)
compute the distance between two points
Euclidian Distance
L2 Norm
for general continuous distance
sqaure root sum of square values
Manhattan/City-block Distance
L1 norm
For general continuous data
Sum of absolute values
Norm
a mathematical function that measures the size or magnitude of a vector in a given space
KNN properties
it’s instance based
lazy, most work is put into classification
it’s non-parametric, it has no parameters
R or C: Attribute
Column
R or C: Covariate
Column
R or C: Data Point
Row
R or C: Sample
Row
R or C: Feature
Column
R or C: Observation
Row
R or C: Variable
Column
Main problem of Curse of Dimensionality
greater the dimensionality → sparser the data is within the vector space
Regression general form
Given data X (N observations in D dimensions) and N target values as ⃗y, find a function for predicting the values of new data points
Cost
var, function, formula that we want to minimize in an optimization problem
Error
difference between the computed value and the correct value
Loss
measures how well the model performs
interprets error
Risk
how well a model performs on all possible data
difficult since we don’t have all possible data
expected val of loss function applied to arbitrary data
Empirical Risk Minimization (ERM)
General strategy of finding model that minimizes loss on the training data
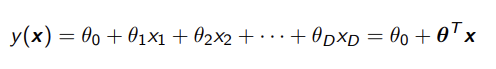
linear regression model family
y(x) = θ0 + θ1x
How can we make lin reg model family into lin algebra form?
Refer to the params as vectors:
θ→=[θ0, θ1]
x→=[1, x]
and multiply : θ→ * x→
What is linear about linear regression?
output is weighted sum of inputs
no multiplication between features
forms a straight line or hyperplane
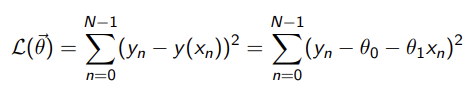
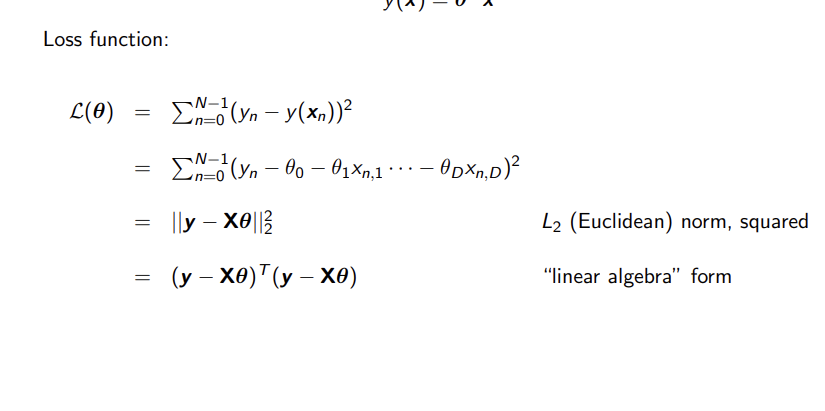
Simple Linear Regression - Loss Function
SSE - Sum of Squared Errors
(this is for a single input x)
θ is the slope and intercept
subtract the estimated y value from the actual
Multiple Linear Regression
this models multiple input features
θn determines how much impact it’s corresponding xn has
θ0 is the intercept still and we extend the x vector by one to match the length of the θ vector
Multiple Linear Regression - Loss Function
Same as linear regression but on larger scale, subtracting predicted from the actual y and doing matrix multiplication to get the square
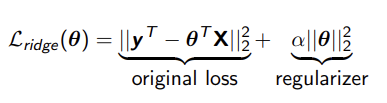
What is regularization?
This adds an extra term to a normal loss function which penalizes large values of the model parameters/weights (θ) making prediction more general → preventing overfitting
Ridge Regularization
essentially linear regression with an L2 penalty on the weights
α controls strength of penalization → larger α → smaller coefficients
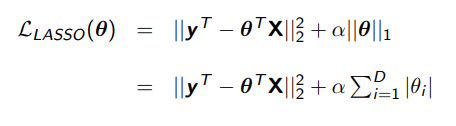
Lasso Regularization
Uses the L1 penalty instead * α to determine strength
uses Feature Selection and eliminates any features that are irrelevant
Closed Form Solution
Provides a direct formula for how to get the optimal parameters that minimizes loss without using things like gradient descent
Which versions of linear regression have a closed form solution?
linear regression
Ridge regression
XX Lasso (absolute val - non differentiable) XX
What is Gradient Descent
Minimizes a function, typically loss by adjusting the parameters to the steepest descent and can be used on functions that don’t have a closed form solution.
Gradient Descent General Outline
Initialize parameters to random vector
Compute loss with those parameters
compute gradient → tells direction of steepest descent
update to new parameters
repeat until change is negligible or max iterations
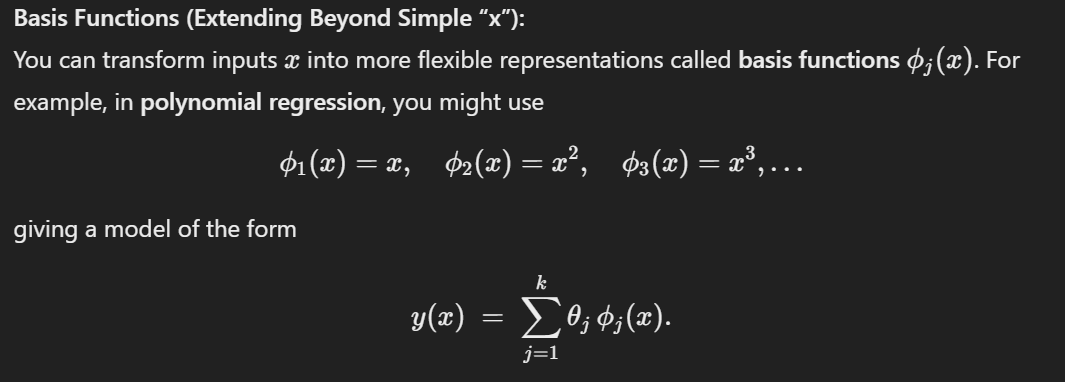
Basis Functions
transform x inputs into a more flexible representation → polynomial regression to be captured in a linear space
Premise of adapting linear regression for classification
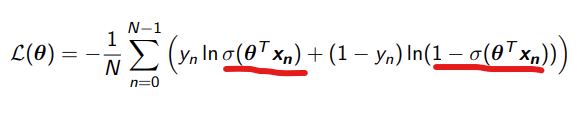
when we apply the sigmoid logistic function to lin reg → output between 0 and 1 → interpret it as a probability of being in a certain class
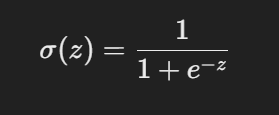
Logistic Function (sigmoid function)
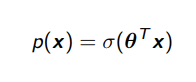
Model family for logistic regression
Use of logistic function
maps real val input to range (0,1) for classification purposes
smooth version of the step function
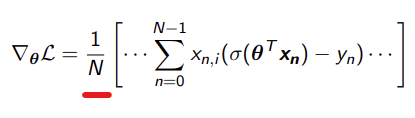
Logistic Function useful properties
It has a nice derivative to work with
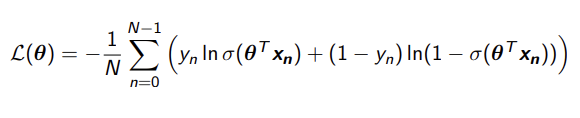
mean log loss
loss function for logistic regression
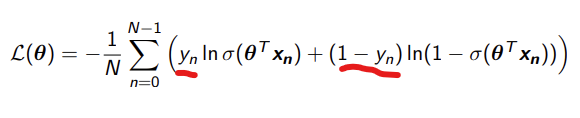
these will either be 0 or 1 and will determine which error to use
This is how far off the estimate is
We divide by N because we are getting the mean