Normality and Homogeneity of Variance
1/15
There's no tags or description
Looks like no tags are added yet.
Name | Mastery | Learn | Test | Matching | Spaced |
|---|
No study sessions yet.
16 Terms
What do parametric tests require?
That the assumption of normality must be met
What does normality require?
The distribution of the data to be normally distributed (bell shaped curve)
What are the 4 checks for normality?
Skewness and kurtosis
Test of Normality
Q-Q plots
Histogram
How do you check normality with skewnss and kurtosis?
zskew and zkurt should be within ±1.96 (divide the skew valyes or excess kurtosis by their standard error)
How do you check normality with the test of normality?
Use the Shapiro-Wilks or Kolmogorov-Smirnov test
When do you use the Shapiro-Wilks test to test for normality?
When the sample size is 3<n<50 (significant value and statistic to be non-significant, p-value greater than alpha = 0.05)
When do you use Kolmogorov-Smirnov test to test for normality?
When the sample size is >50Shapiro-wilks test (significant value and statistic to be non-significant, p-value greater than alpha = 0.05)
How do you check normality with Q-Q plots?
The observed and expected values are plotted on a graph. If the plots are on or follow the straight line, normality is assumed (detrended normal Q-Q plots are obtained by plotting the actual deviation of scores from the straight line. No real clustering of points with most collecting around the zero mark suggests normality)
How do you check normality with histograms?
The observed values are plotted on a graph. If the bars follow the normal distribution curve, normality is assumed
How can normality and homogeneity of variance be assessed in SPSS?
Through the explore: analyze > descriptives > explore
What does the explore procedure in SPSS provide?
The descriptives, histograms, probability plots, and test of normality and test of homogeneity of variance
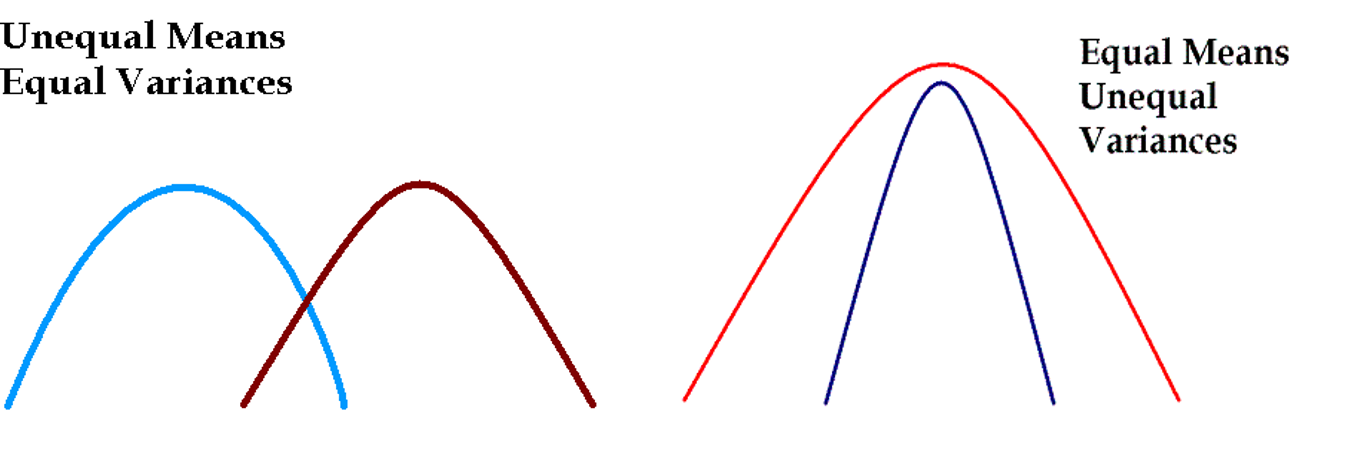
What does equal variances across samples mean?
Homogeneity of variances
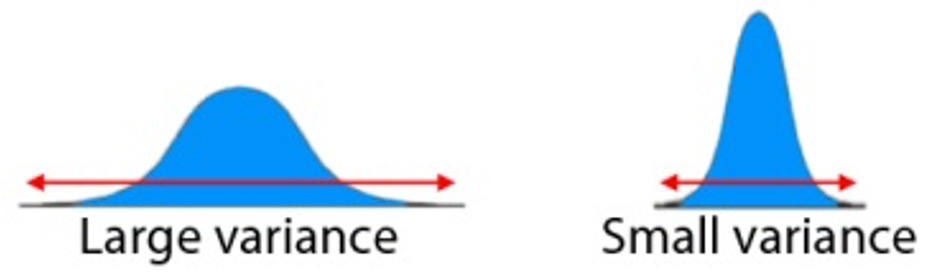
What does a large variance and small variance looks like?
How do you calculate homogeneity of variance for two sample?
Eg. Independent samples t-test assumes this
For independent samples t-test, Levene's Test of Equality of Variances is used to assess if the groups have equal variances. If non-significant (p-vales greater than alpha = 0.05), variances are equal/same/homogenous
How do you calculate homogeneity of variance for more than two samples?
Eg. ANOVA assumes this
Use Leven's Test of Homogeneity of Variance for between groups design
Use Mauchly's Test of Sphericity for within group designs
Both tests need to be non-significant to suggest variances are equal/same/homogenous
What do you do if the data is not normally distributed?
Use a non-parametric test
Transform the dependent variable. This is complex, not recommended, involves repeating the normality checks on the transformed data (eg. Taking the log or square root of the dependent variable)
Use a parametric test under robust exceptions. There are conditions when the parametric test can still be used for data which is not normally distributed and are specific to individual parametric tests (eg. ANOVAS)