stats final exam
1/110
There's no tags or description
Looks like no tags are added yet.
Name | Mastery | Learn | Test | Matching | Spaced | Call with Kai |
|---|
No study sessions yet.
111 Terms
Any straight line can be defined by
Slope (b1) and intercept (b0)
Sum squared accounts for
Improvement in prediction model
Residuals account for
Error in prediction
F value accounts for
Overall fit of the model
Standard error accounts for
The extent that values vary across populations
R2 accounts
Overall variance in model (whtever decimal point x100)
Multiple regression formula
Yi = (b0 + b1 of X1 + b2 of x2) + error
Eg: immobility= b0 + b1TMS + b2Taser + error
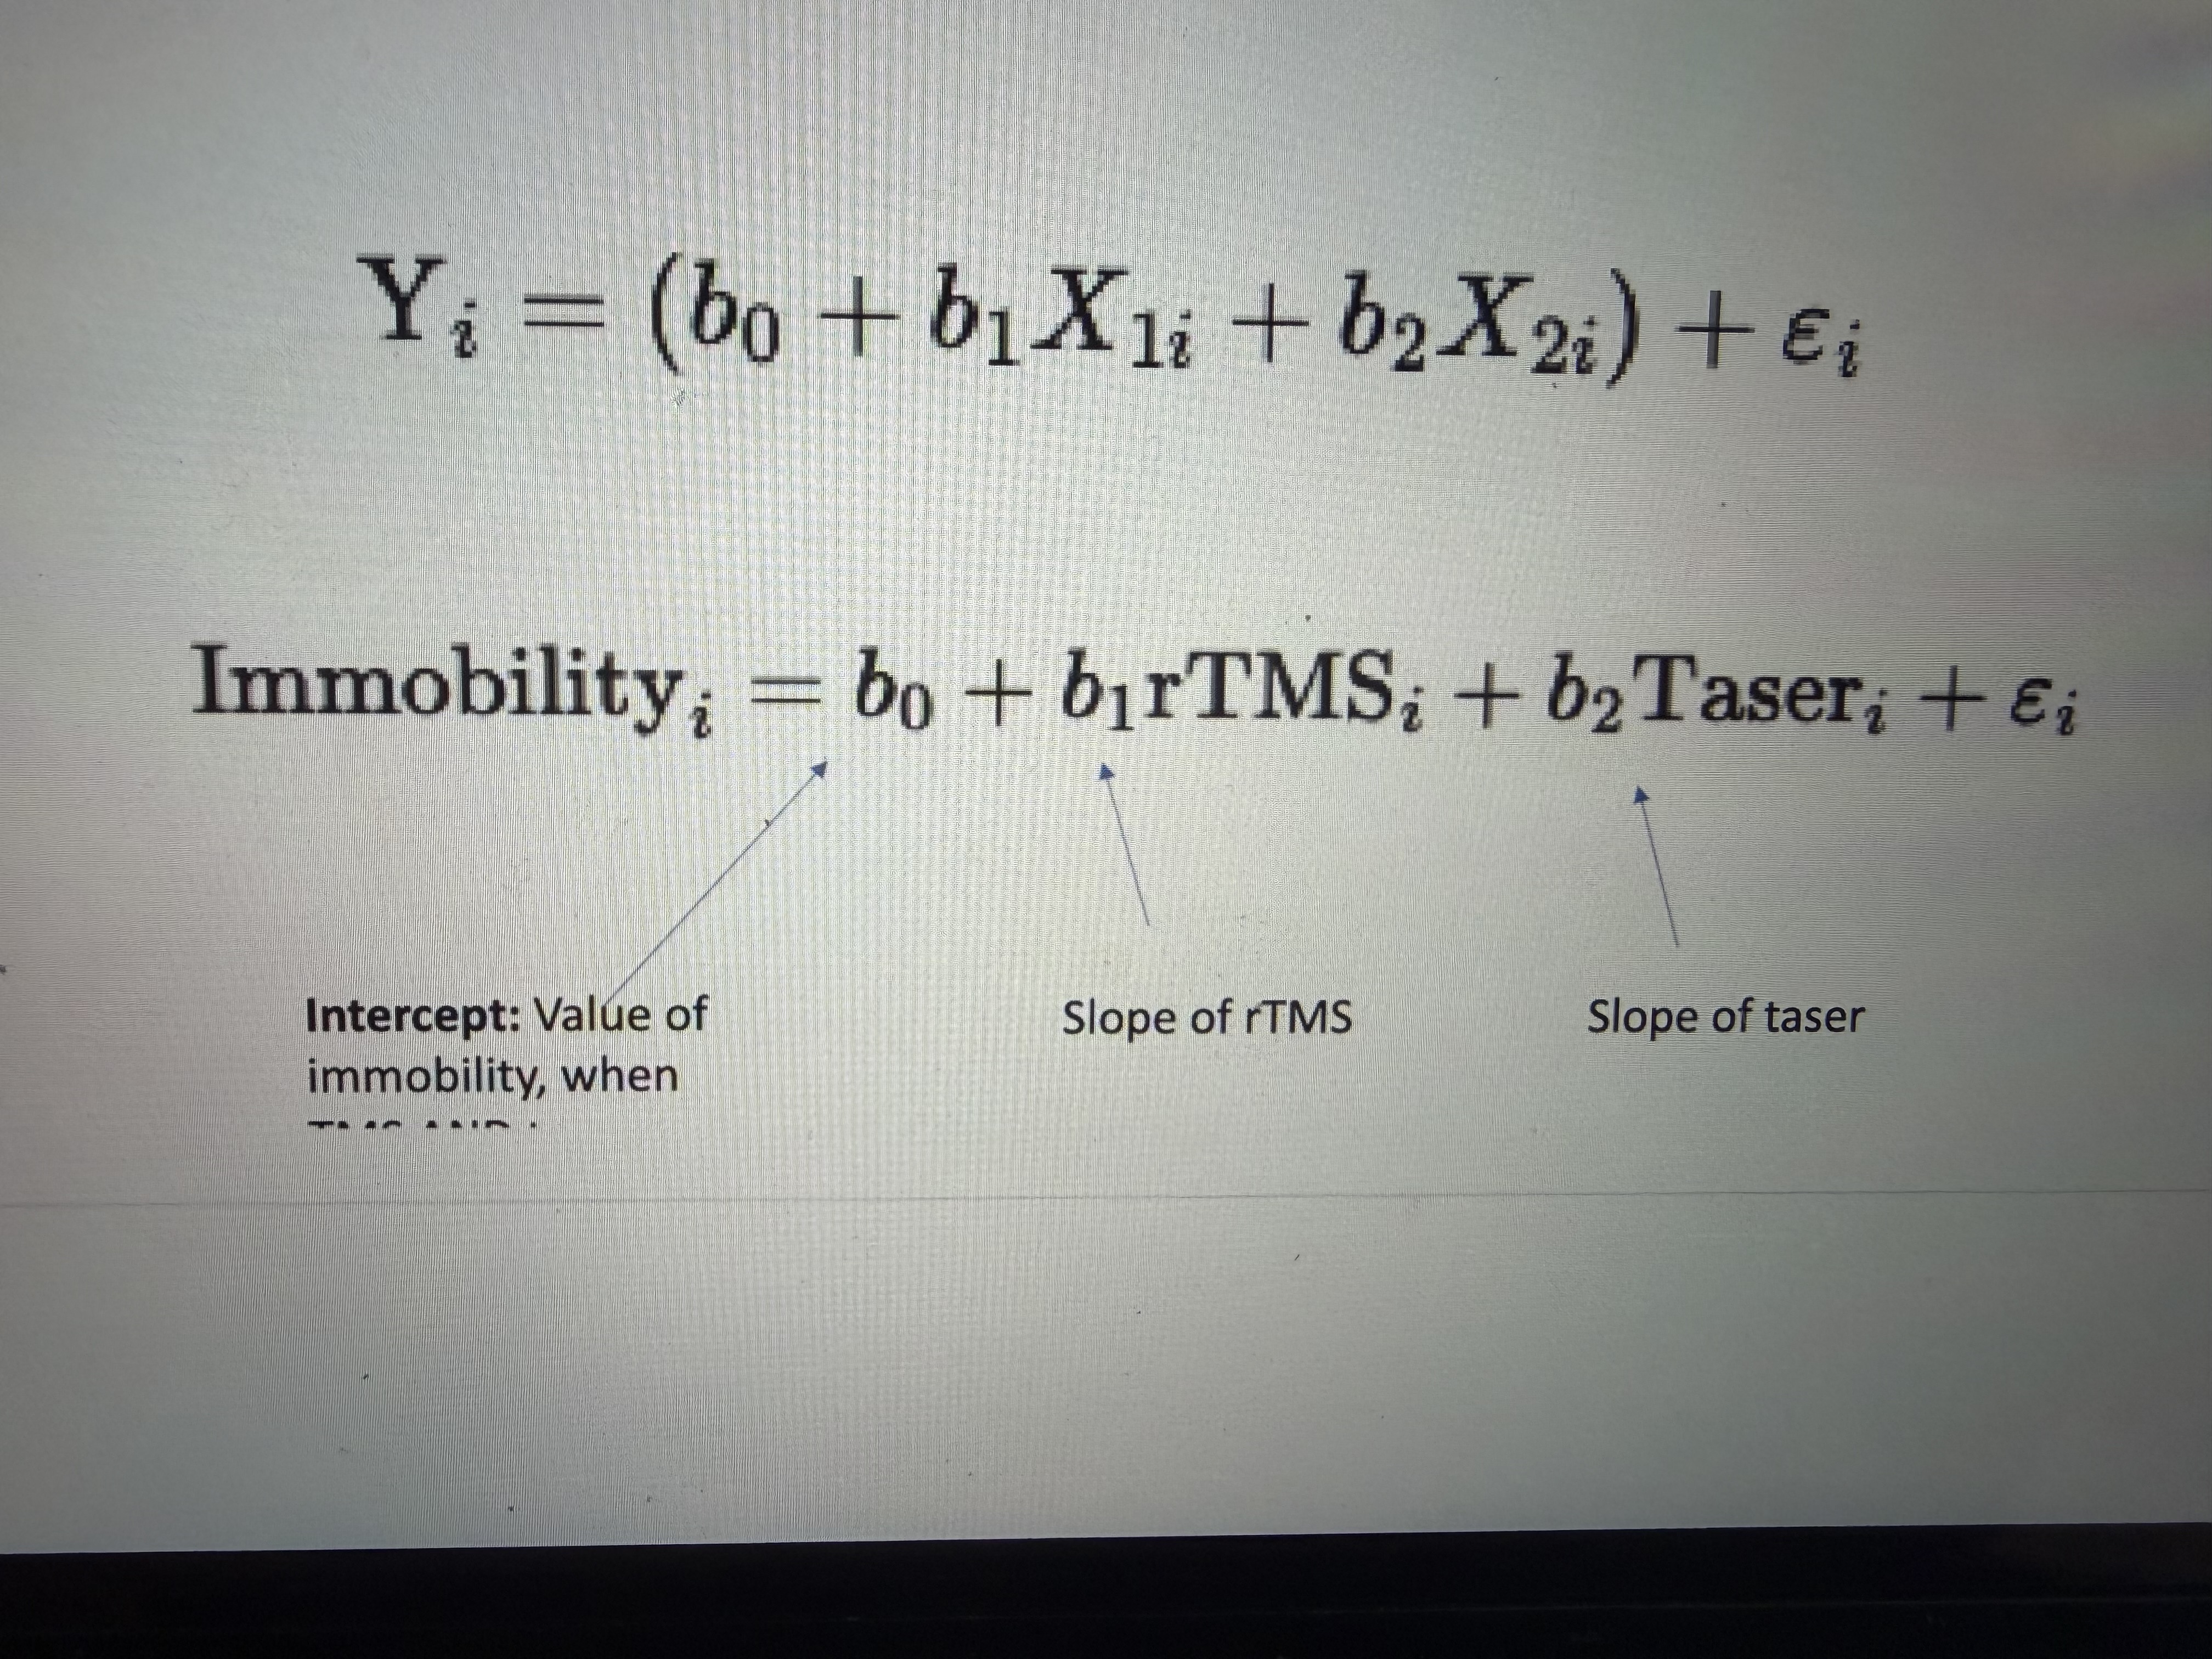
What formula is this
Multiple regression
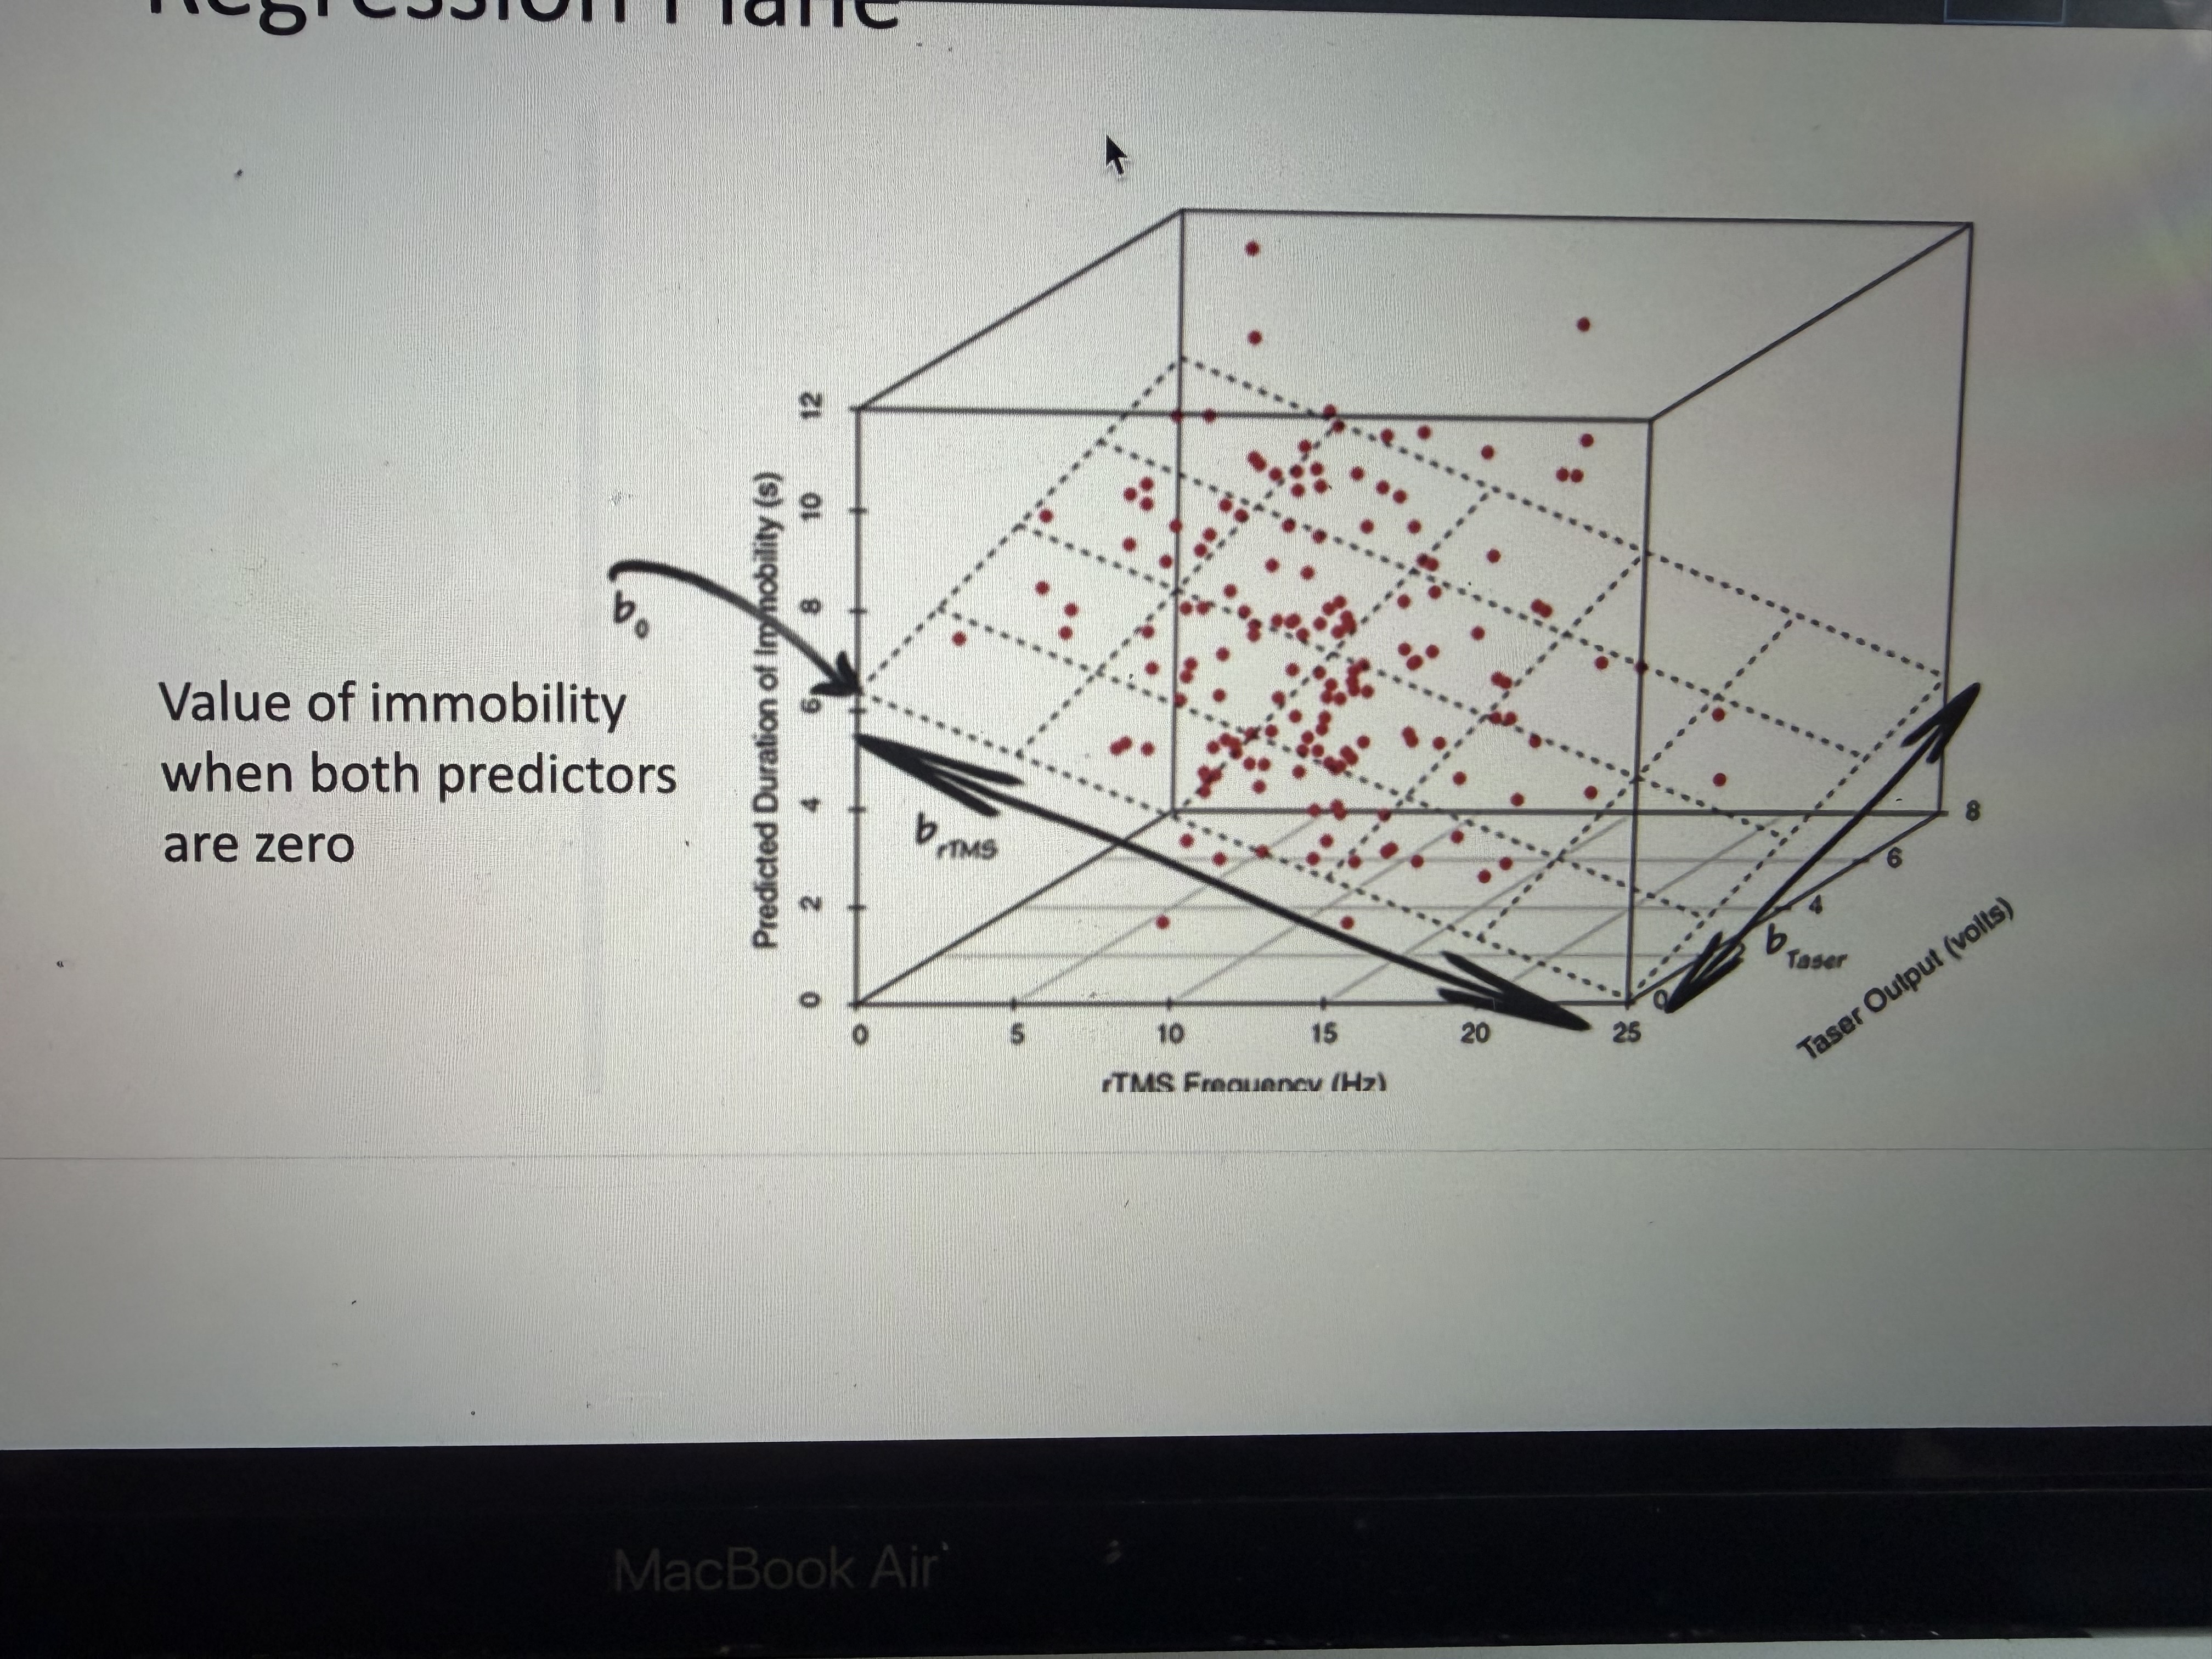
Regression plane
Tells us about positive and negative real
Regression assumptions
Linearity, homoscedasticty, independent errors, normality, and outliers
How to check linearity and homoscedasticity assumption
Scatter plot
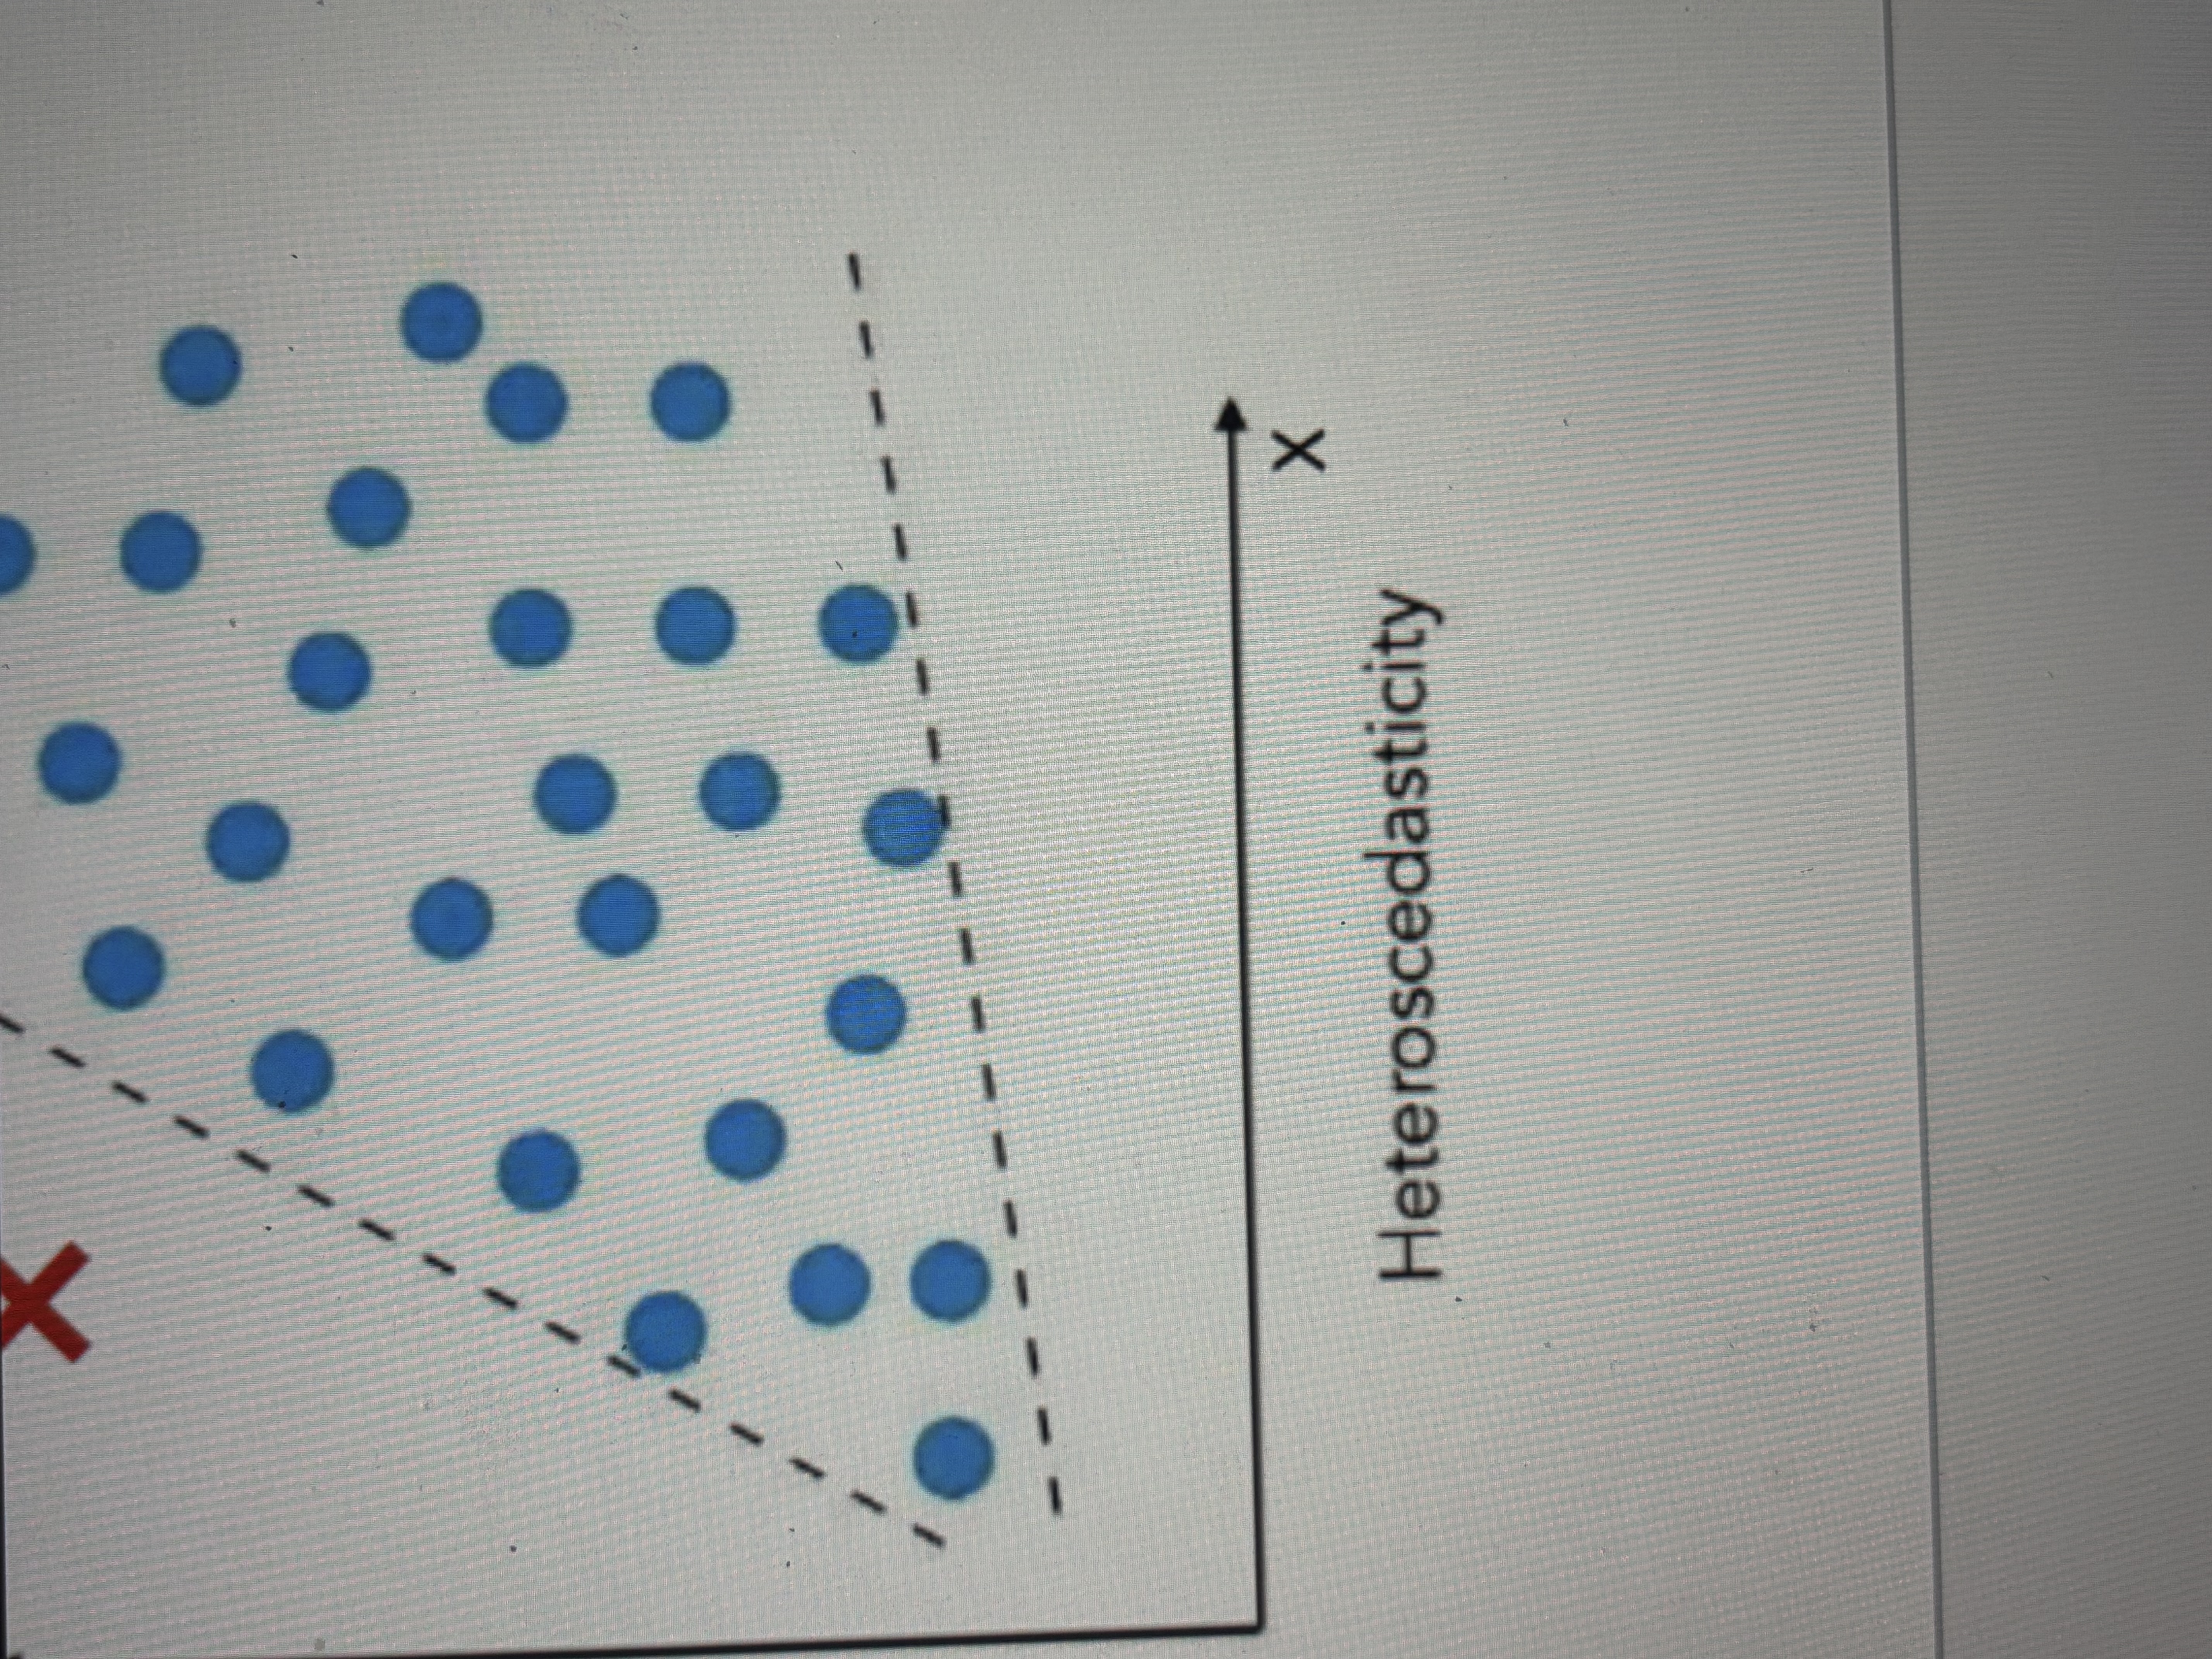
Homoscedasticity wasn’t met (heteroscedasity)
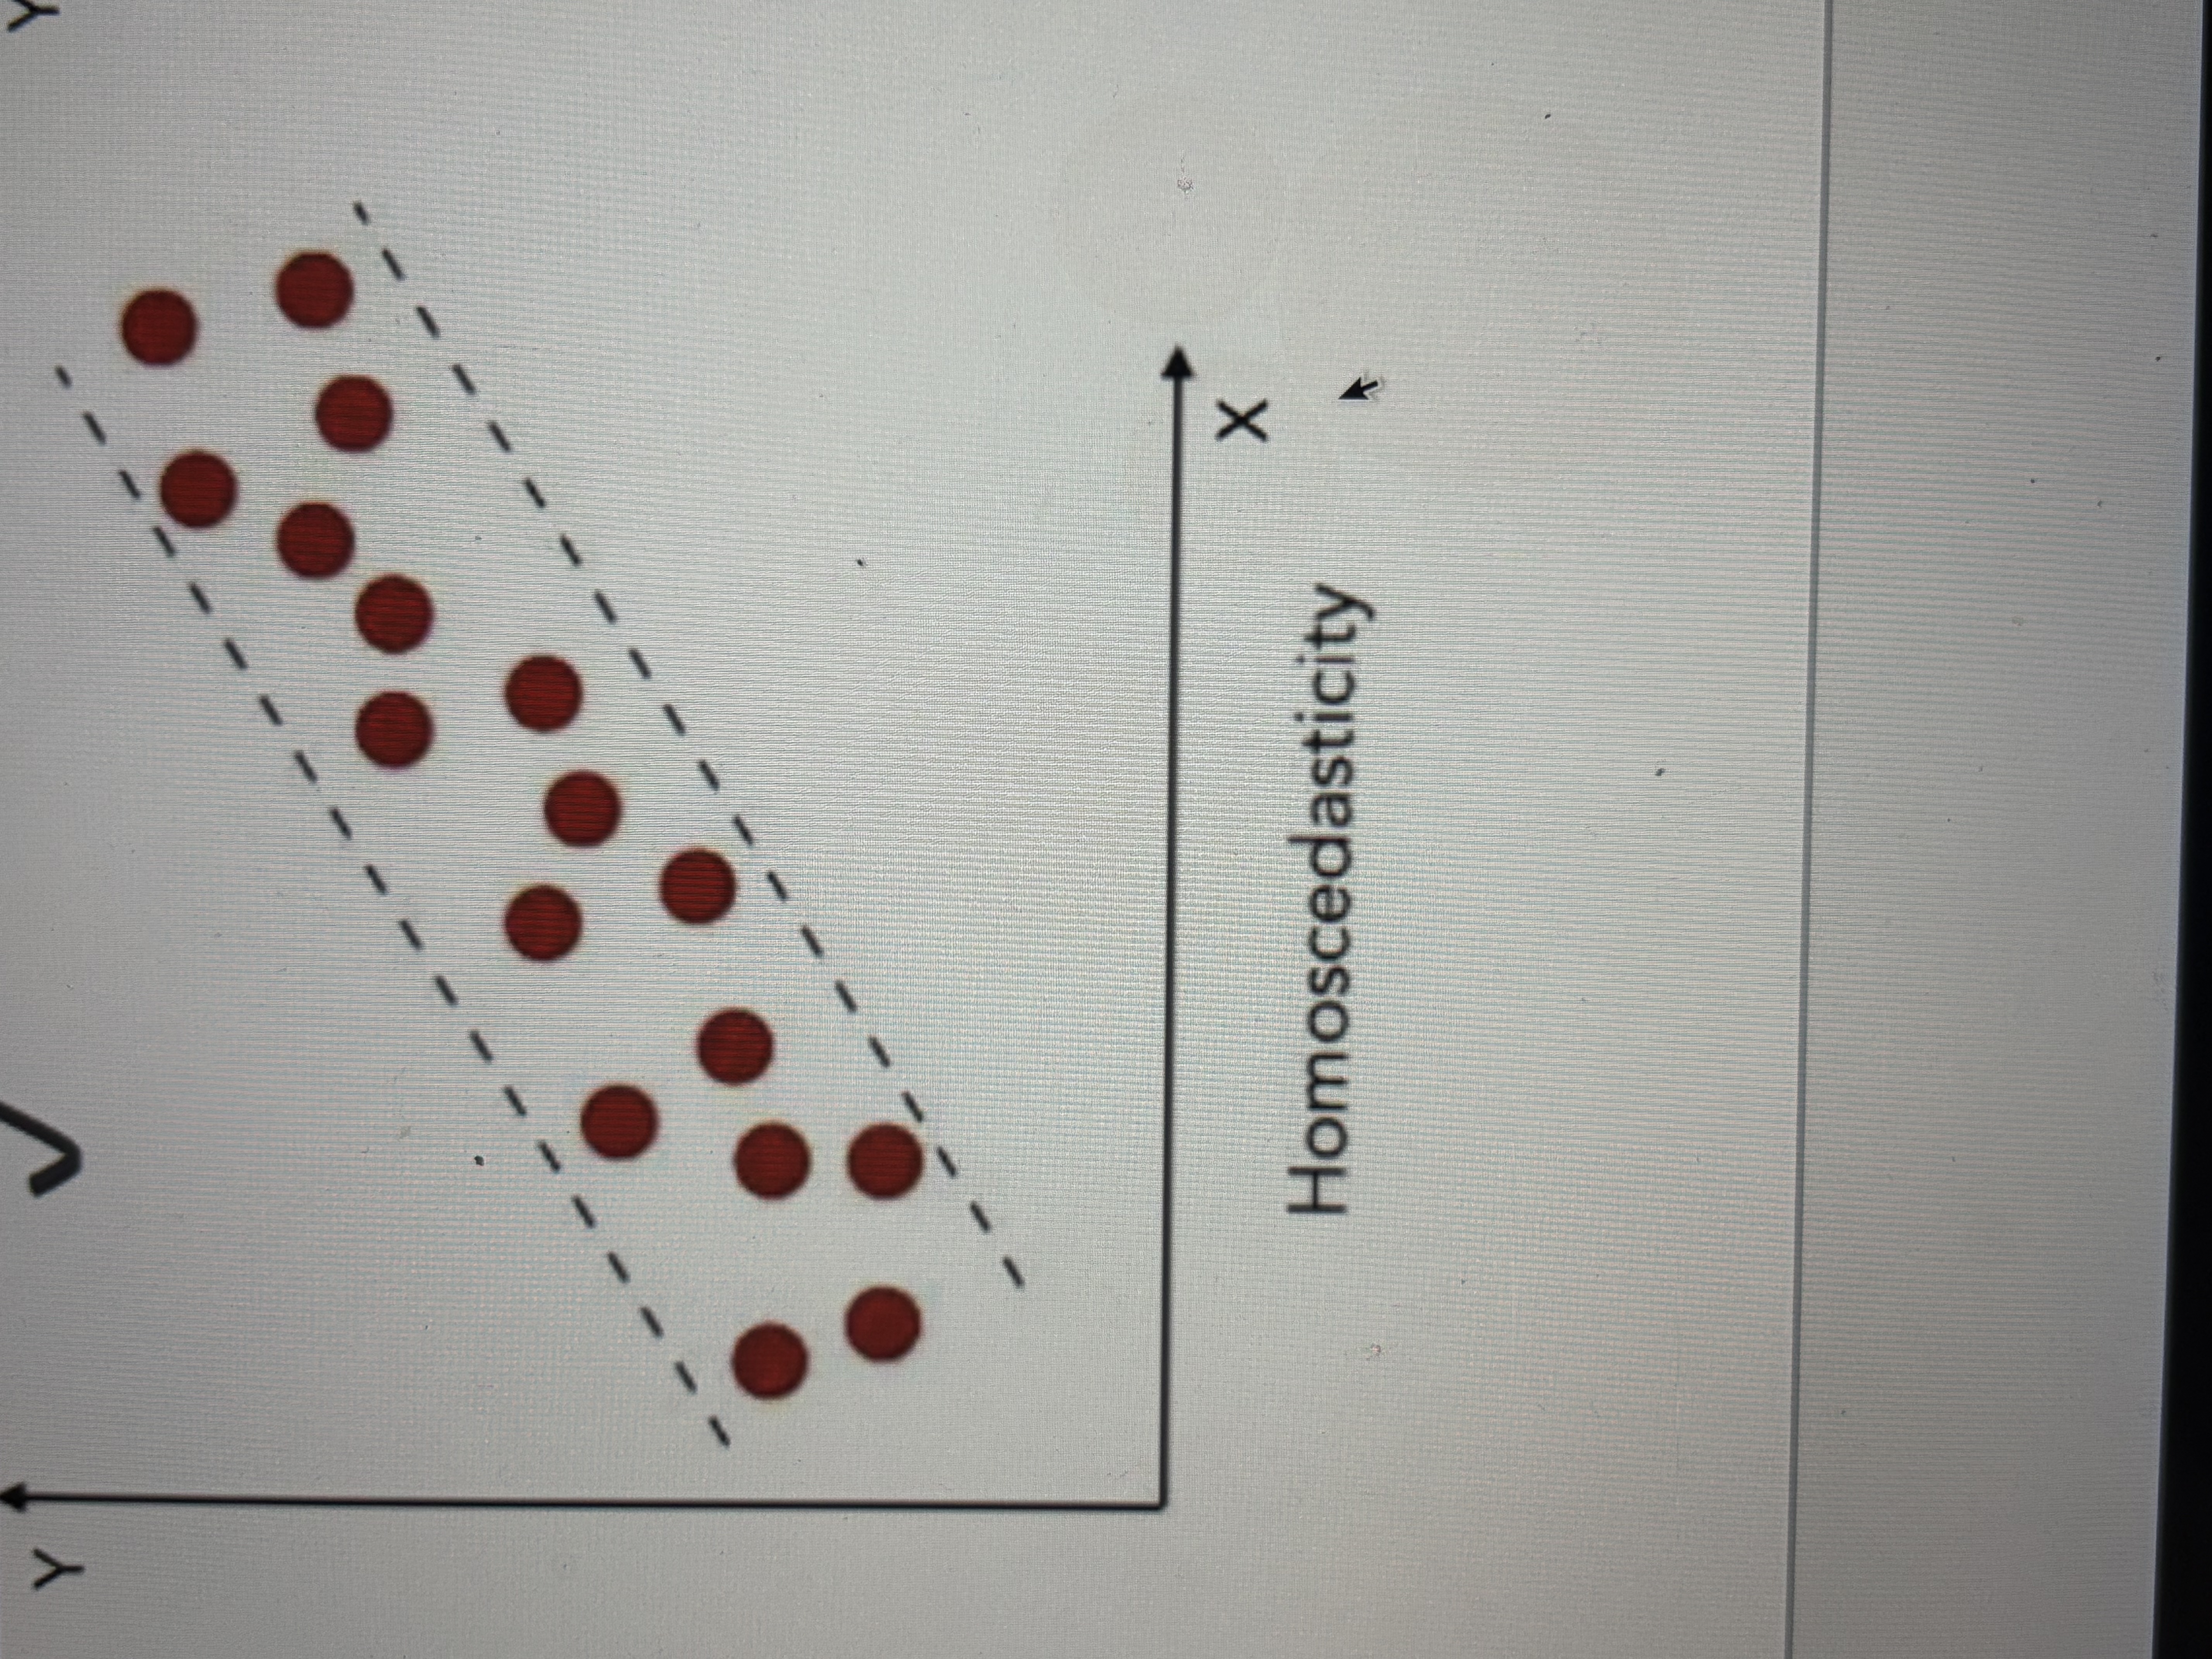
Homoscedasticity Is met
Independent error assumption
Makes sure data set is reflective of what is meant to be looked at (should come from independent sources)
How to check normality assumption
Histogram or qq plot
How to check outliers assumption
Cooks distance (if output is more than 1, we should inspect potential influential cases)
Multicollineraity
Arises in multiple regress when predictors are highly correlated (.8=concern)
Residual of 0 means what
Model correctly predicts the outcome value
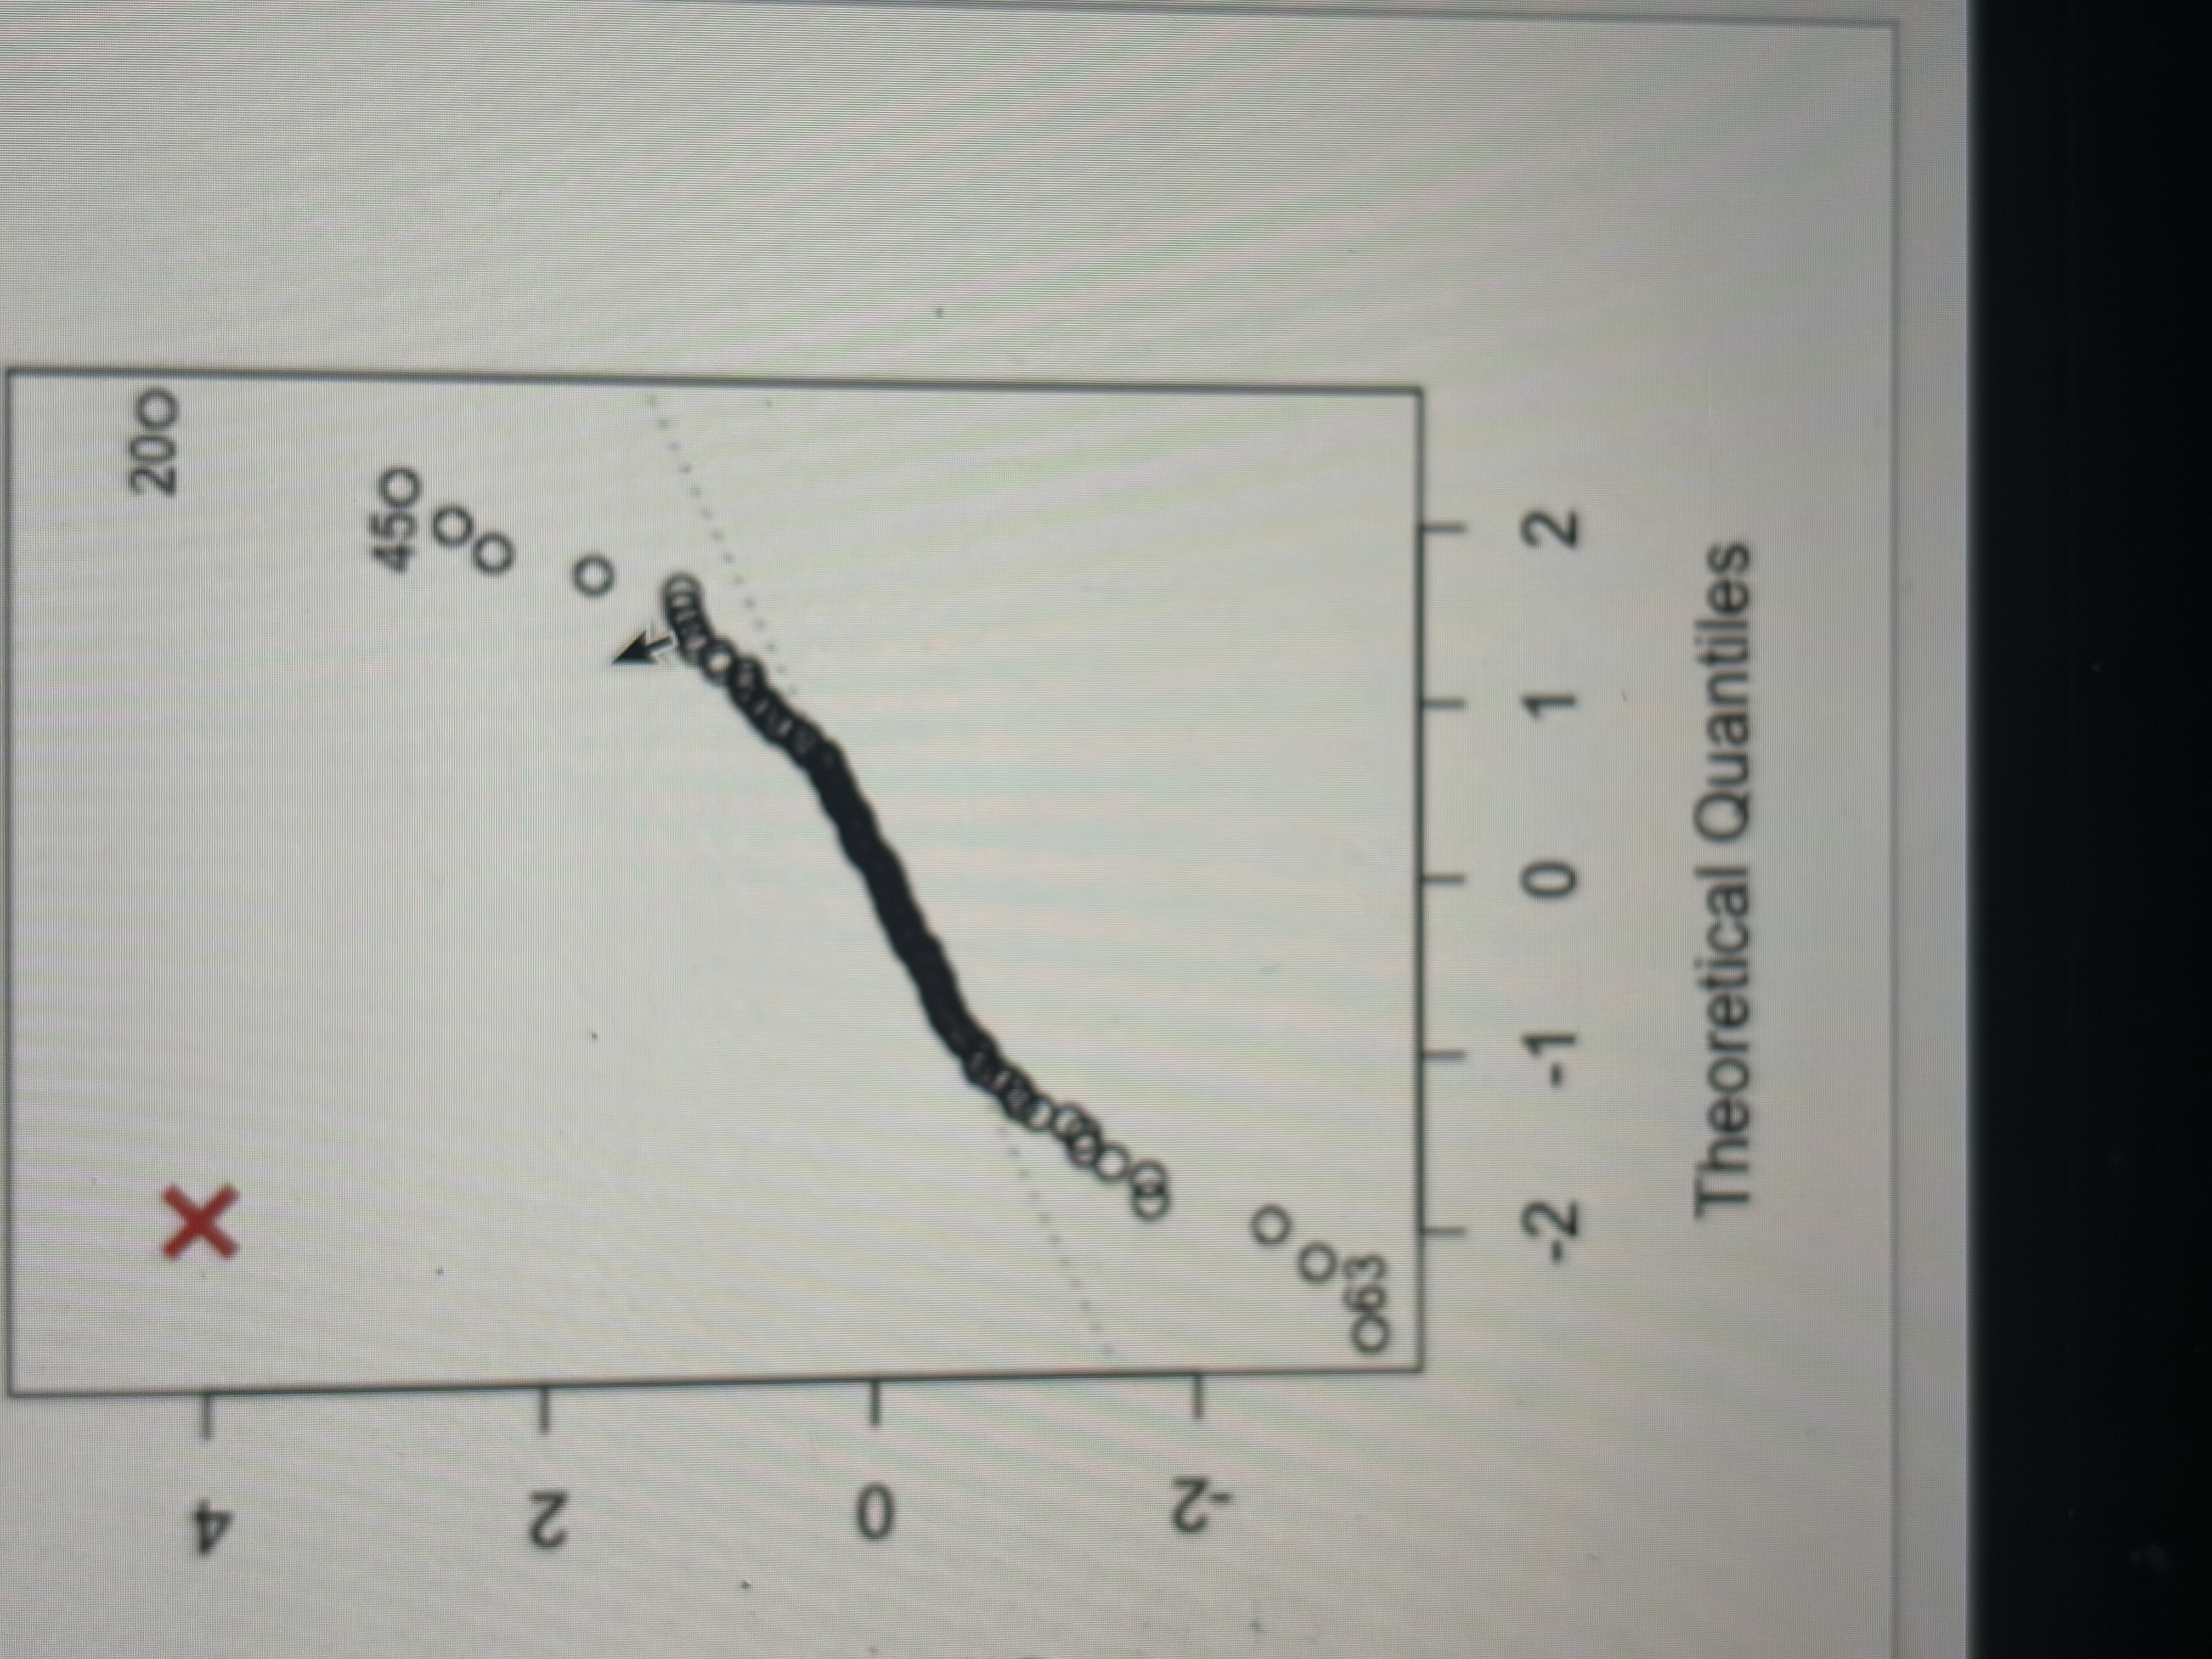
Did not meet normality assumption
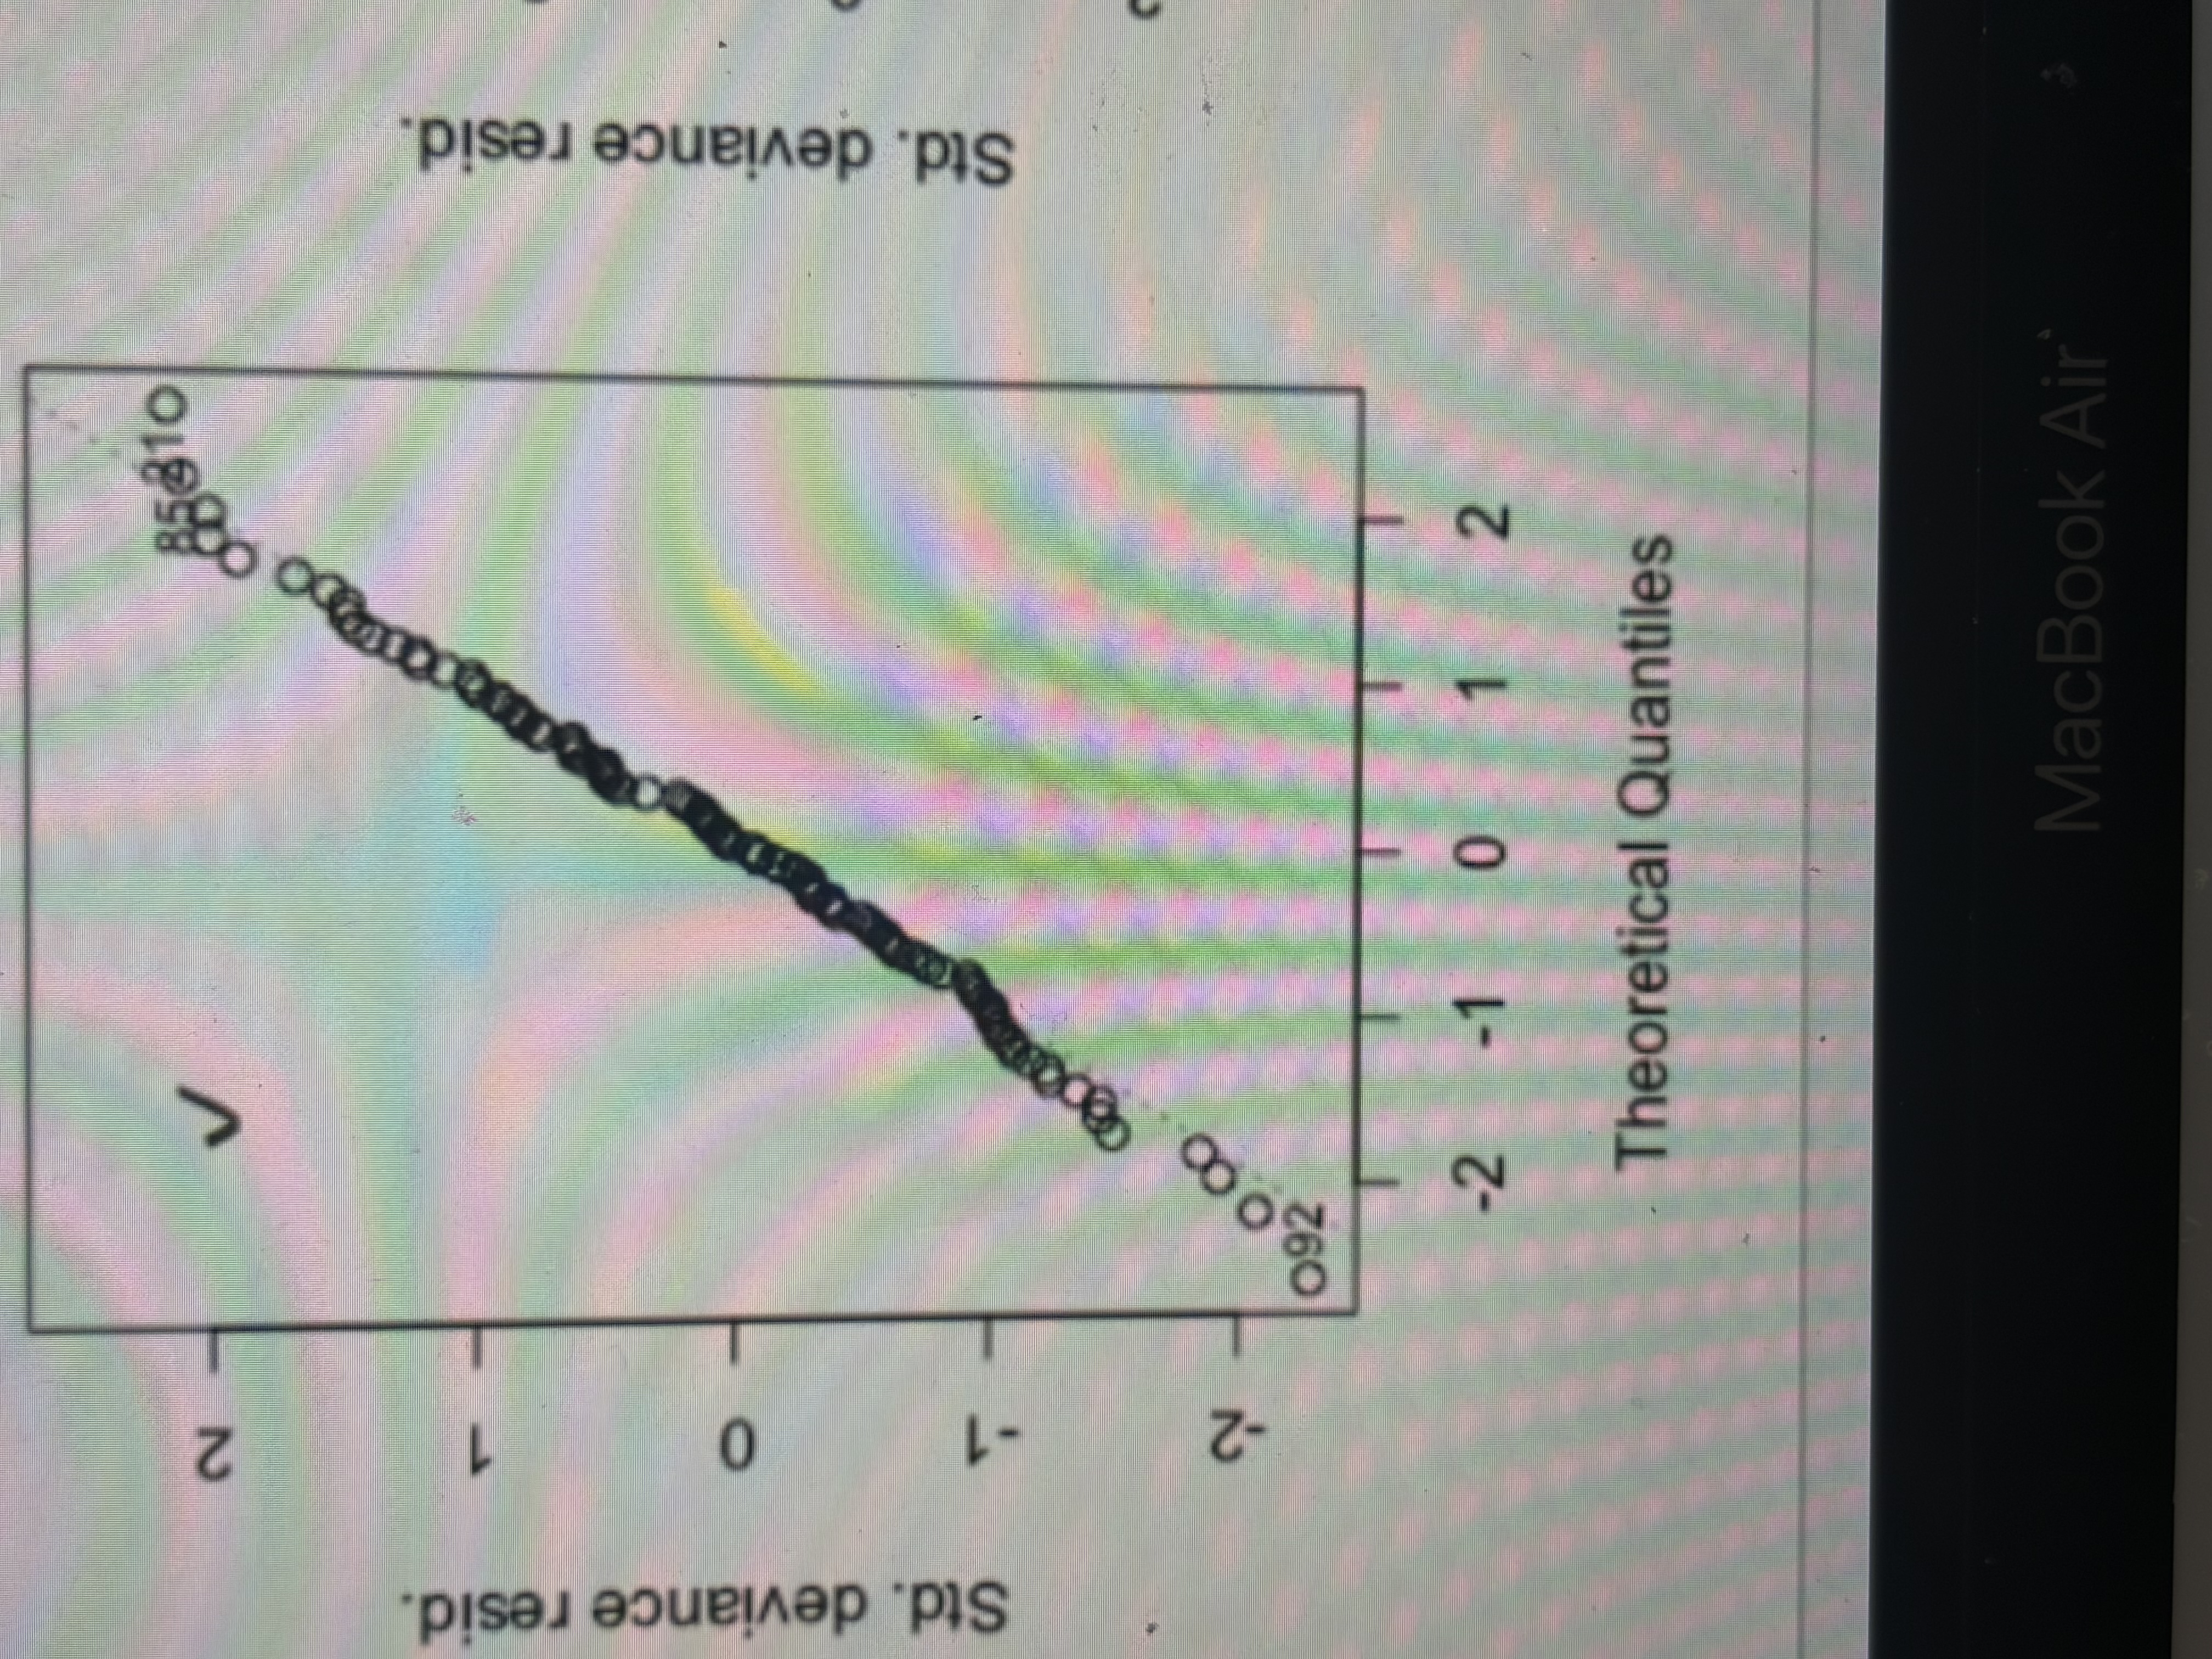
Did meet m normality assumption
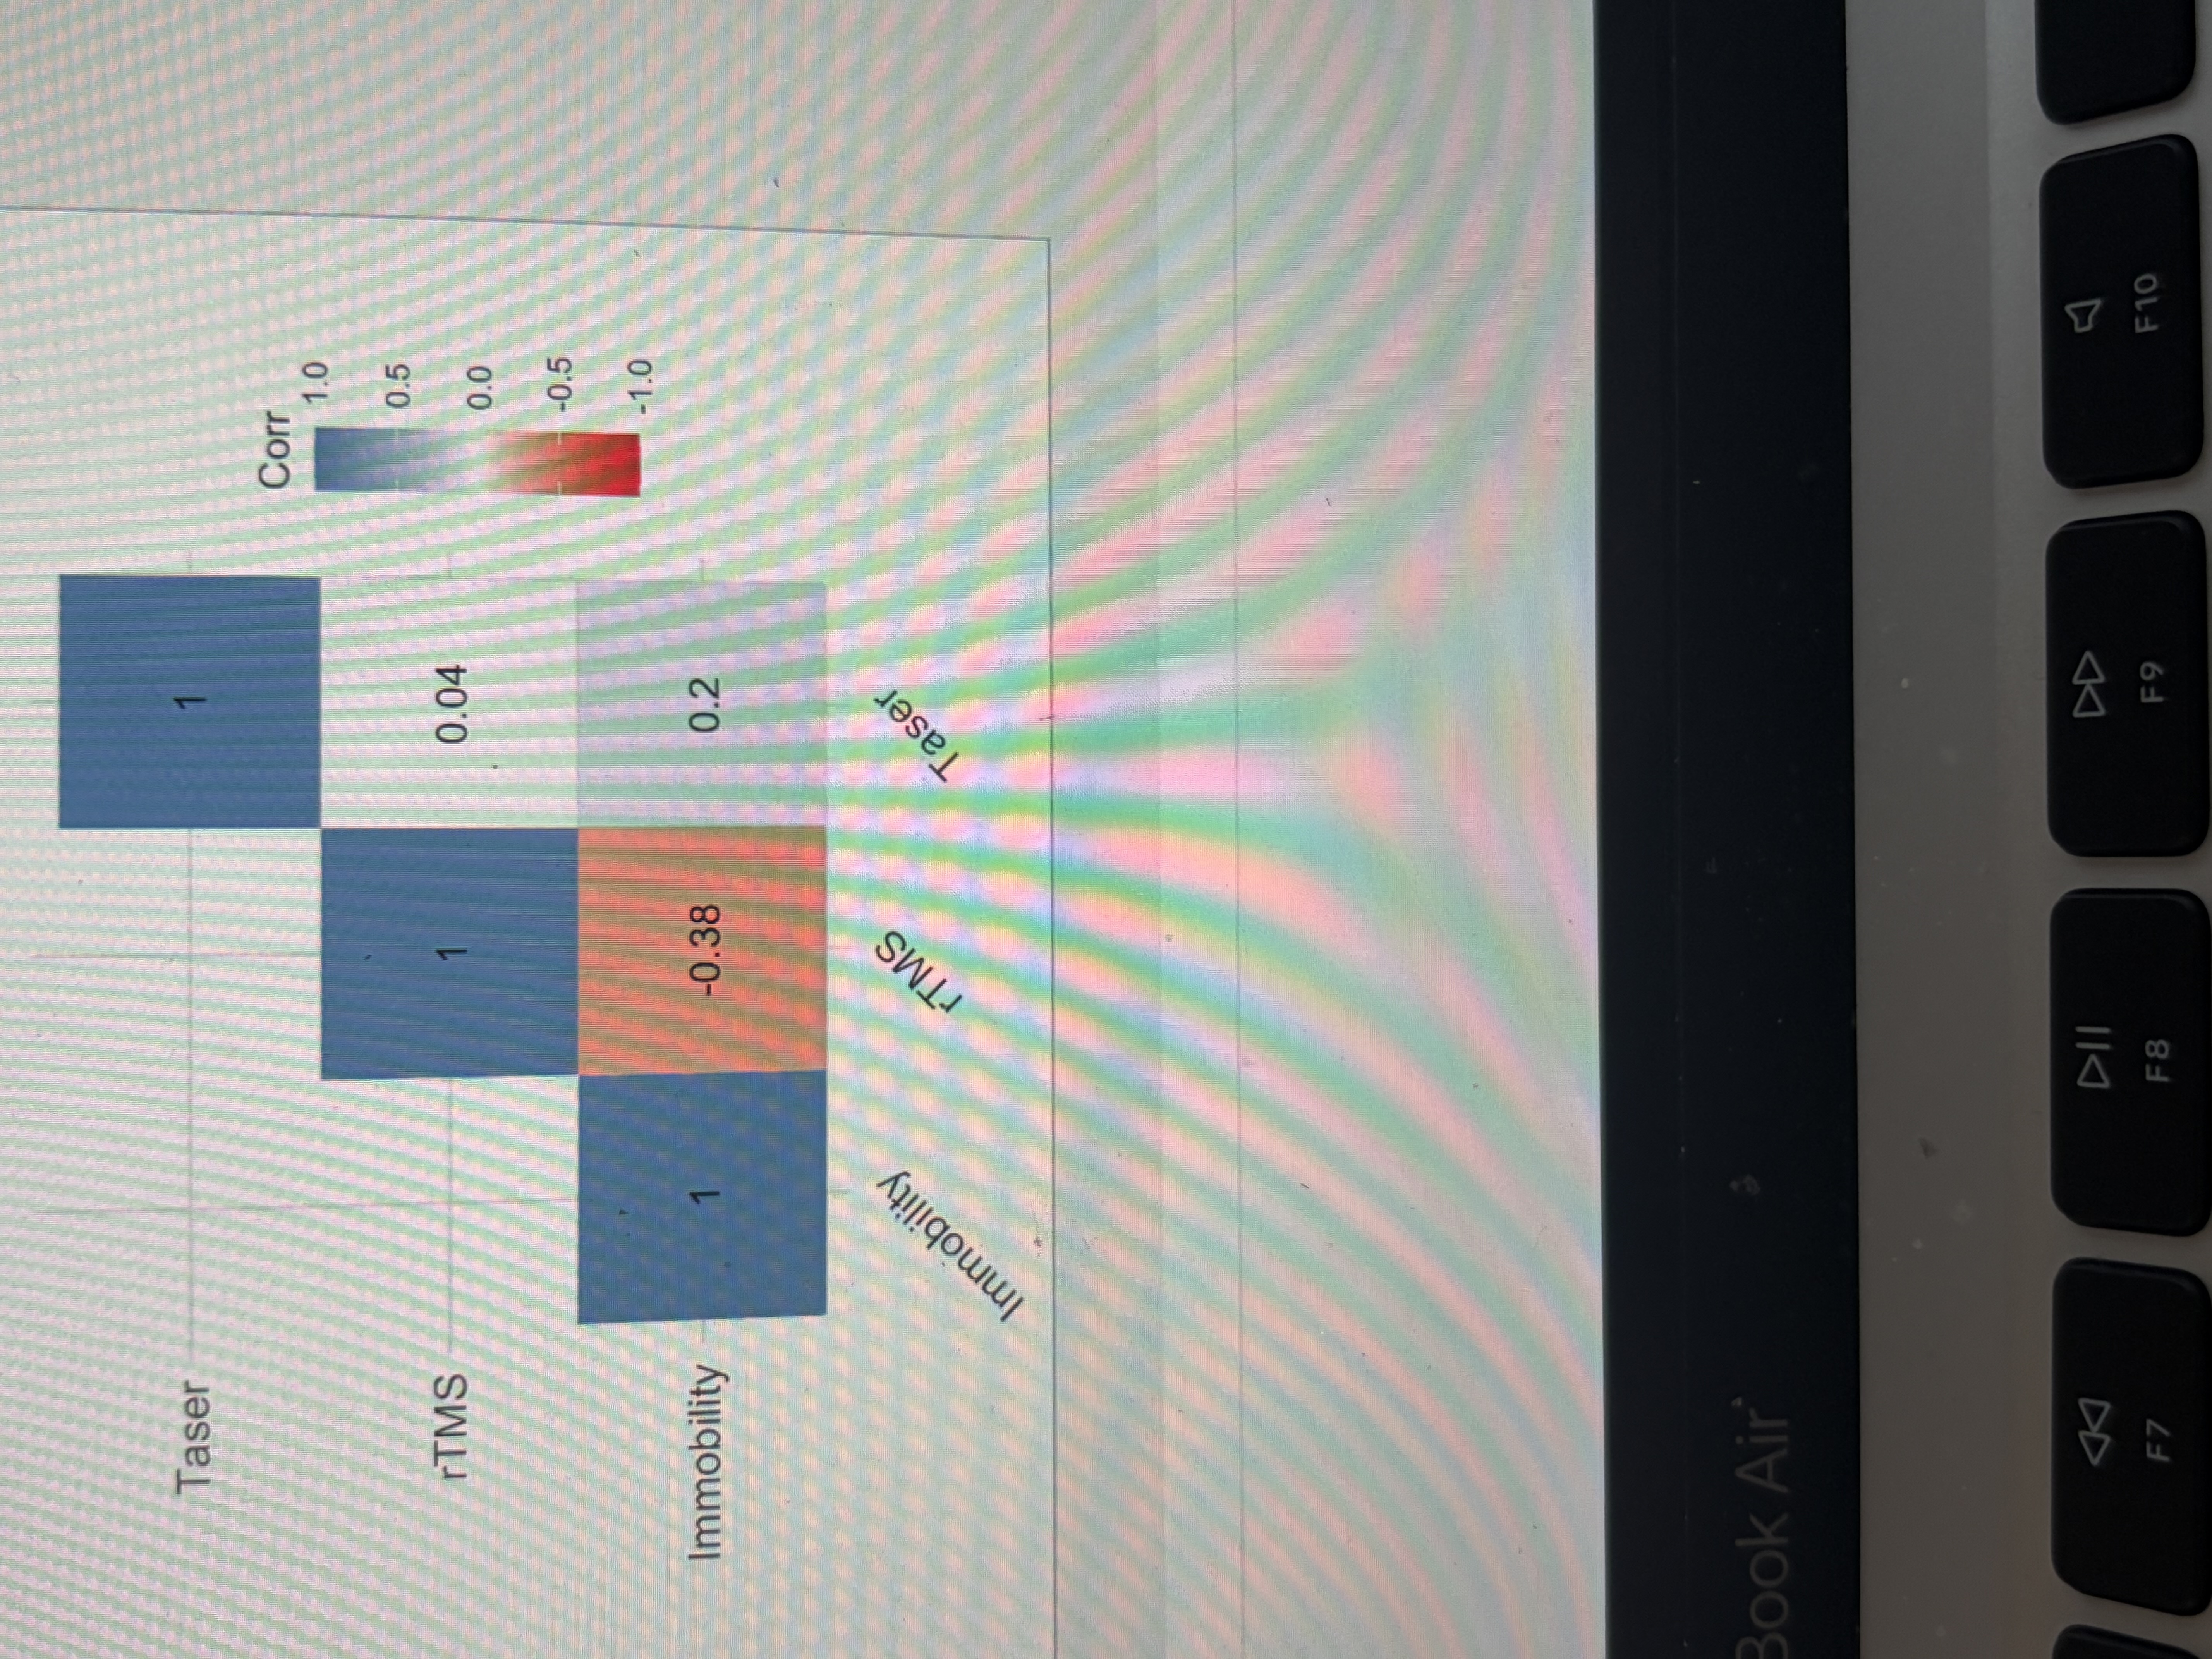
Multicollinearity
Good because non are over .8
Hierarchical regression
Predictors are selected based on previous work and you decide the order of the predictors
Forced entry
Dump all predictors you have or are interested into the model
Stepwise
Decisions about the order in which predictors are entered in the model based on mathematical decisions
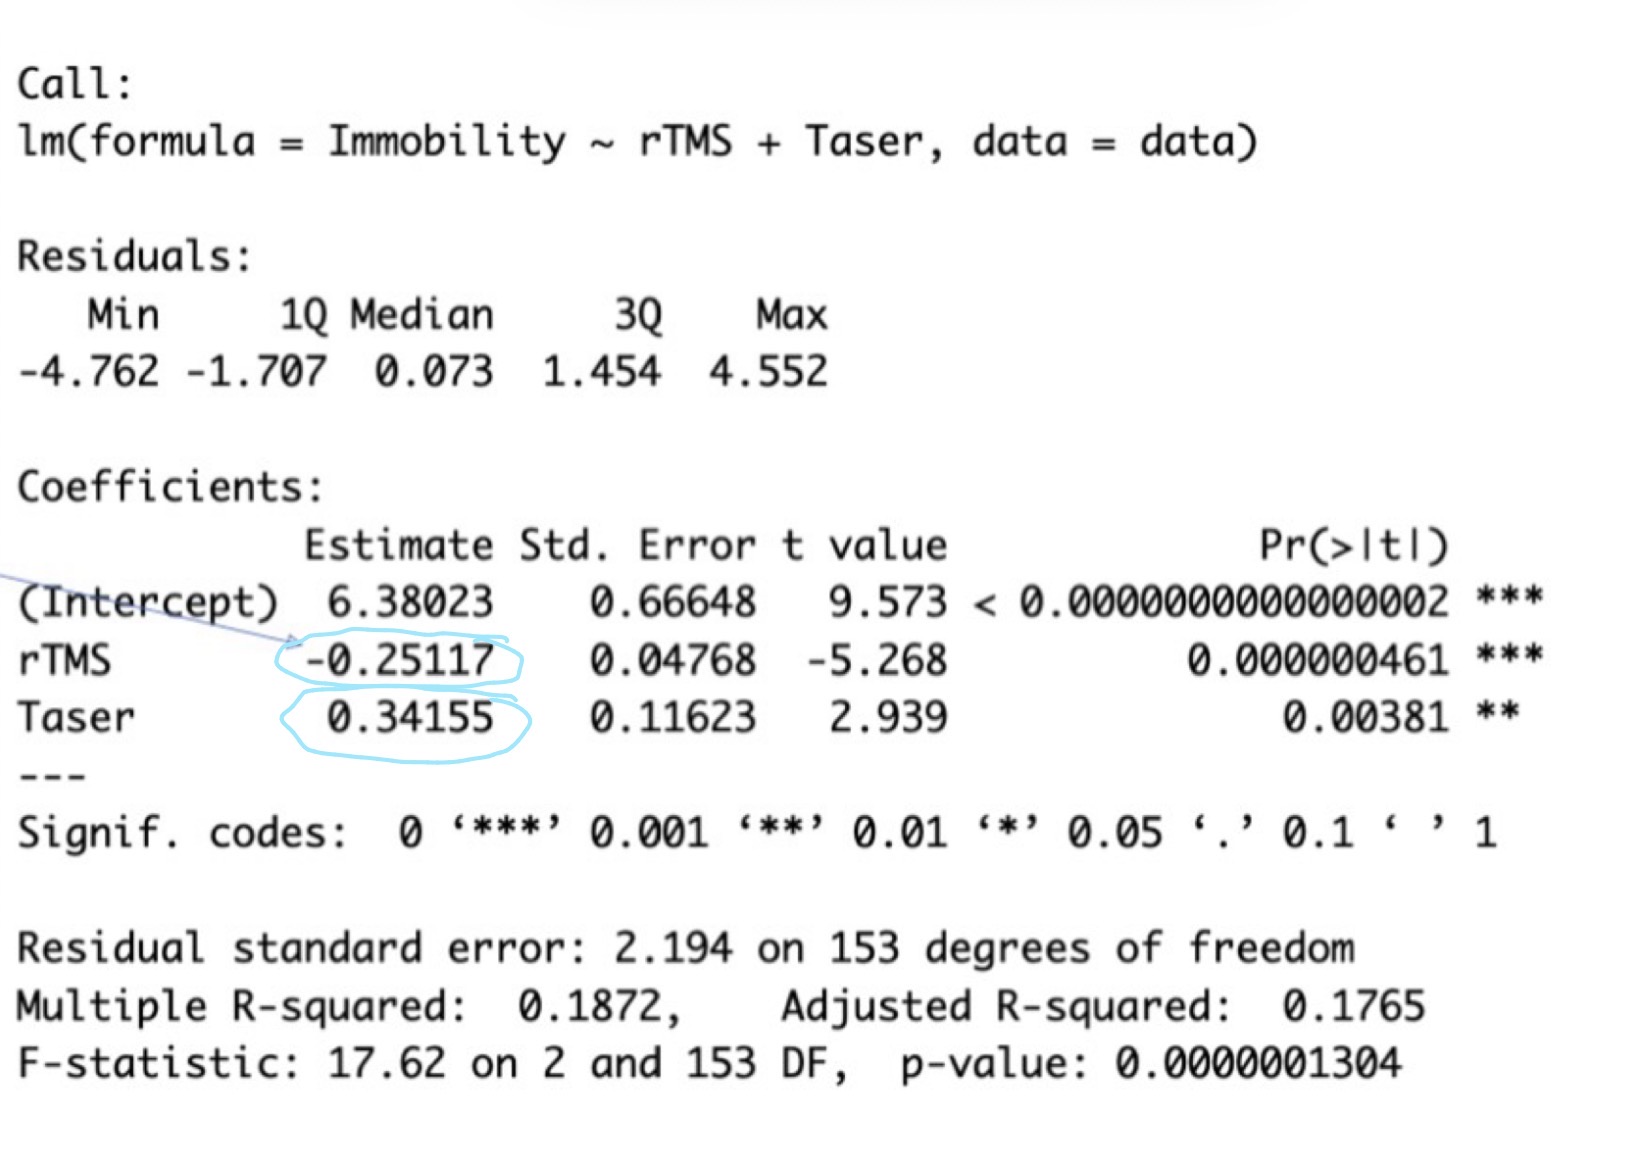
What do the circled numbers tell us
As rTMS frequency decreases by 1 unit zombies will be immobilized for an extra 0.251 seconds
As voltage increases by 1 unit zombies will be immobilized for an extra 0.342 seconds
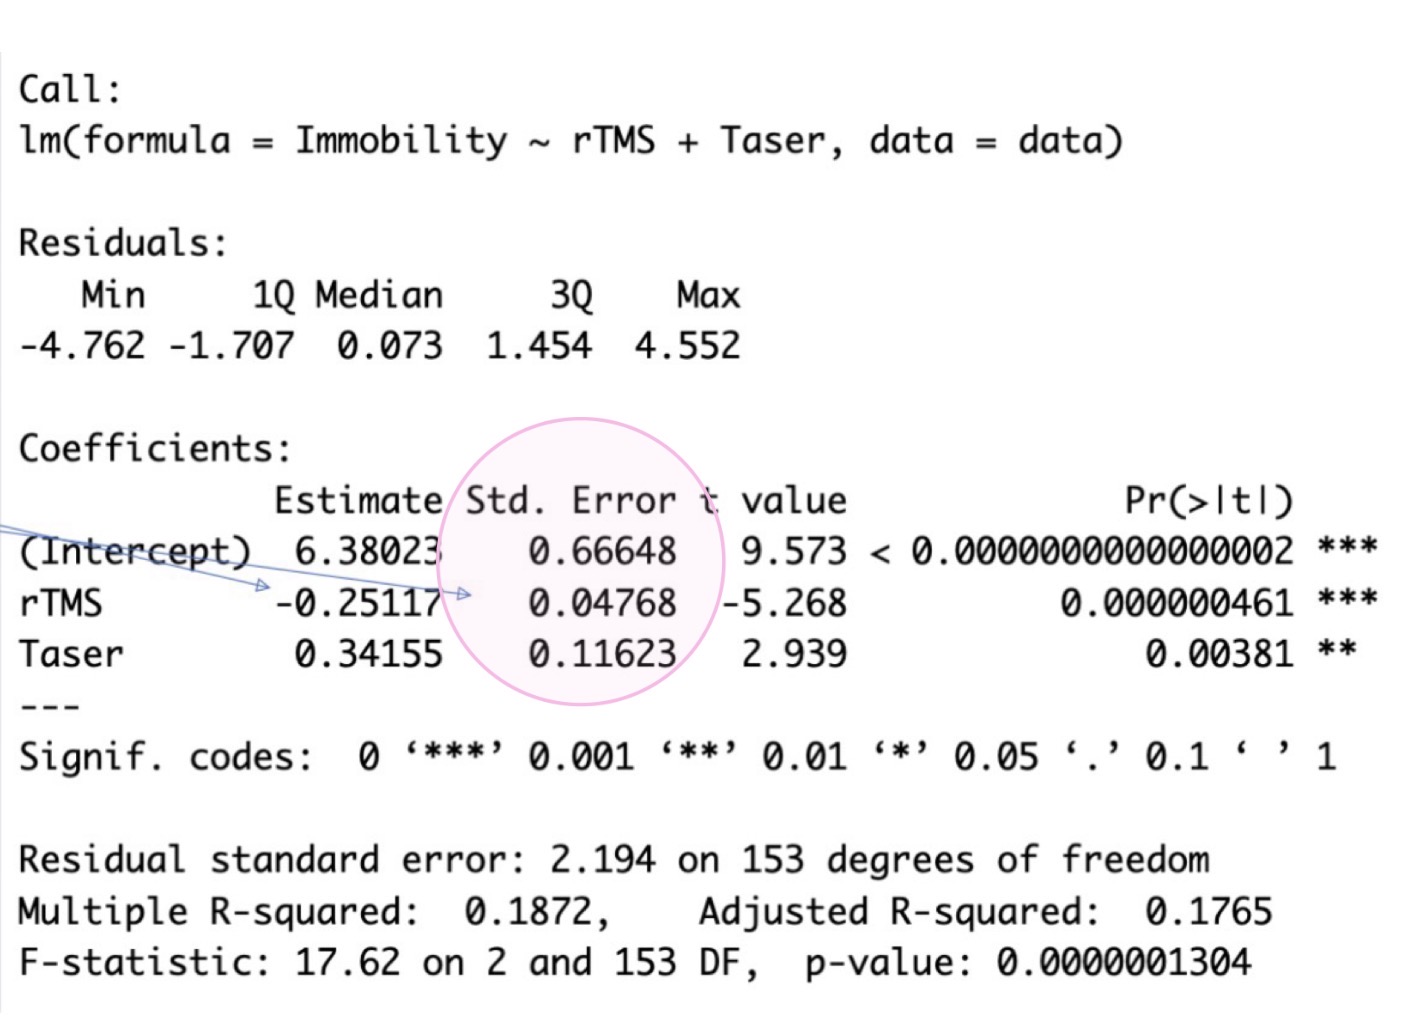
What does the standard error tell us
To what extent values vary across different samples
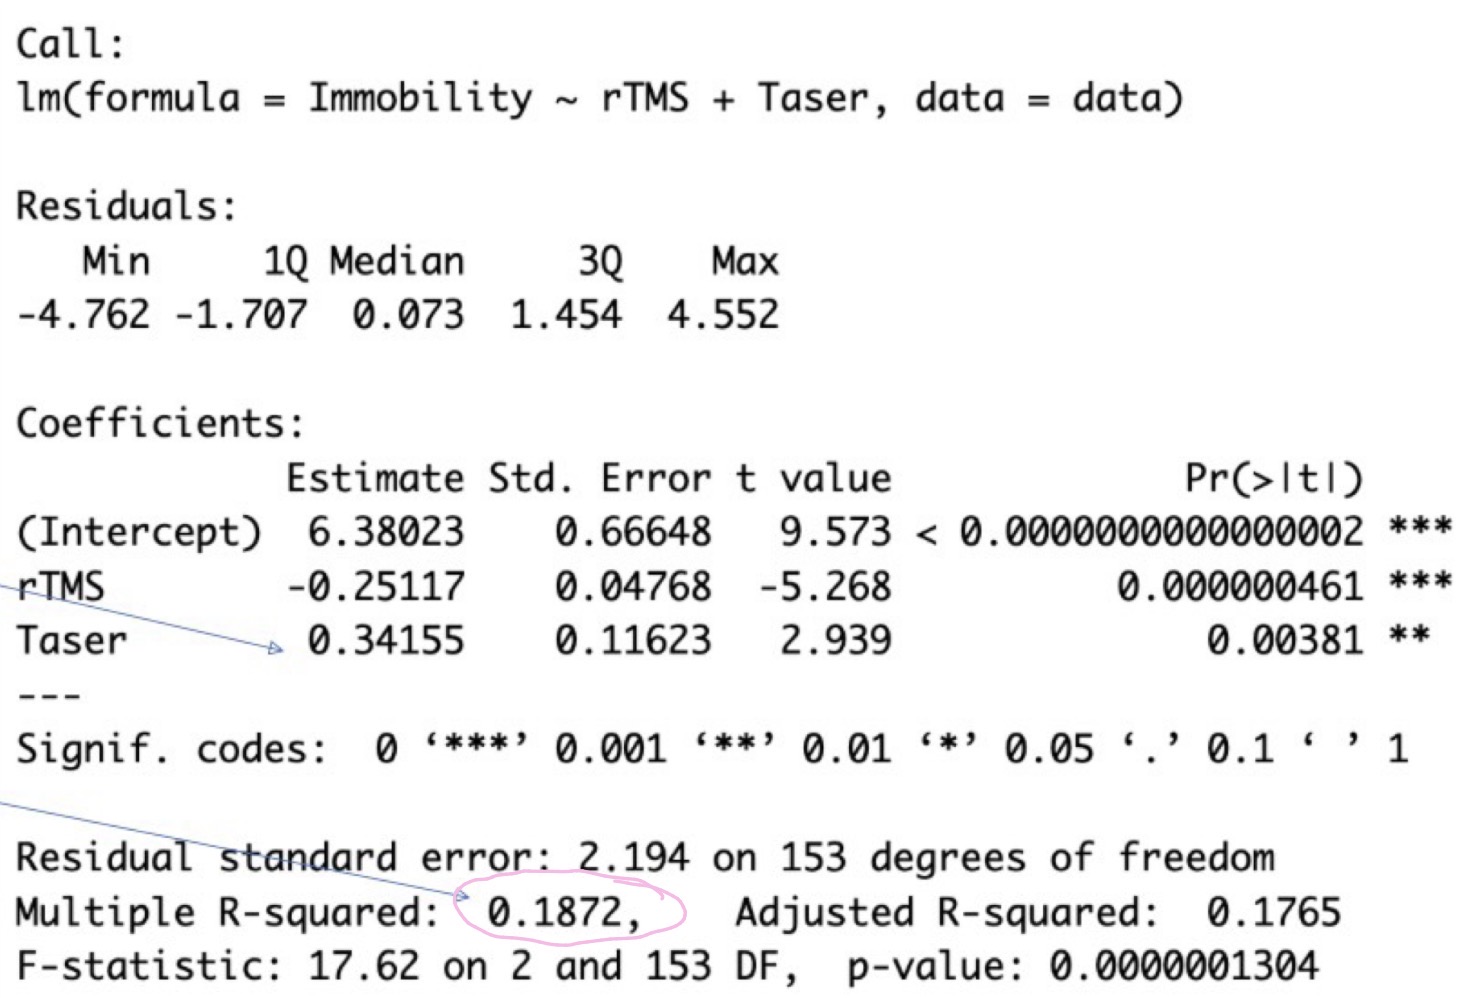
what does R² tell us
18.7 of the variance in immobility time can be accounted for for by taser and rTMS
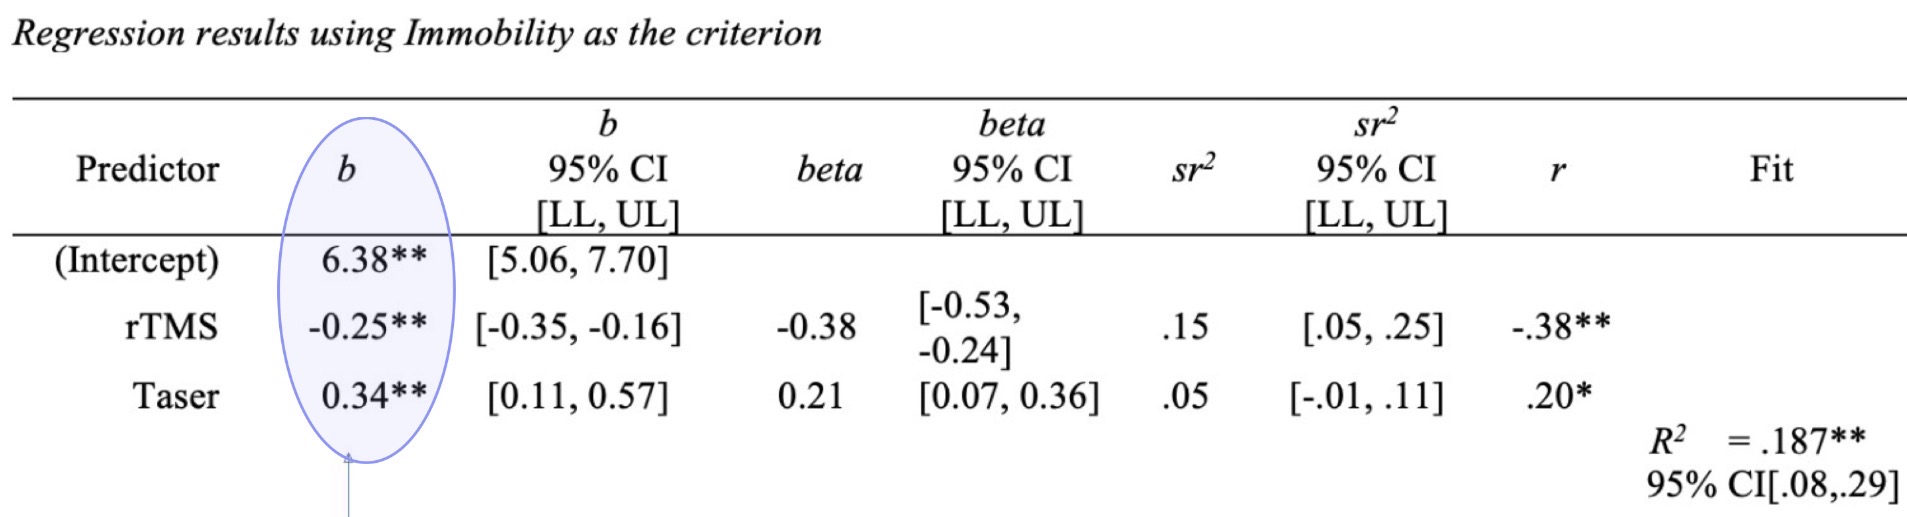
What is b
Unstandardized beta (we can’t compare units)

Beta
Standardized betas: in SD units so we can compare
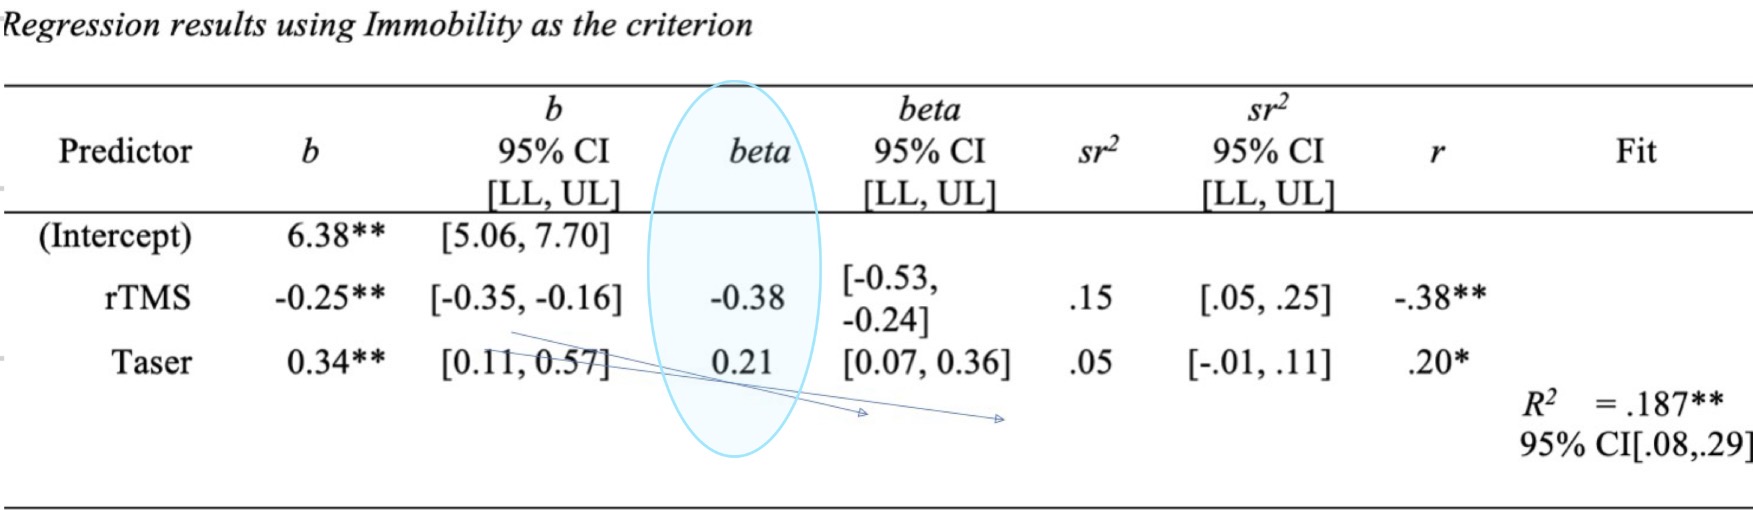
Interpret beta
As rTMS decreases by 1 SD, zombies will be immobilized for an extra 0.38 if a standard deviation, controlling for the effect of taser (vise versa for taser)
Based on this info rTMS effect in zombie immobility is a little stronger than the taser voltage effect
T-tests
Looks at group mean difference
Independent samples t-test
Compares 2 means from 2 different groups (between subjects)
Eg: Did the right side of the class do better than the left side in the midterm
Pairs samples t-test
Compares mean from the same people just different conditions (within subjects)
Eg: does our midterm grades differ from our final exam marks
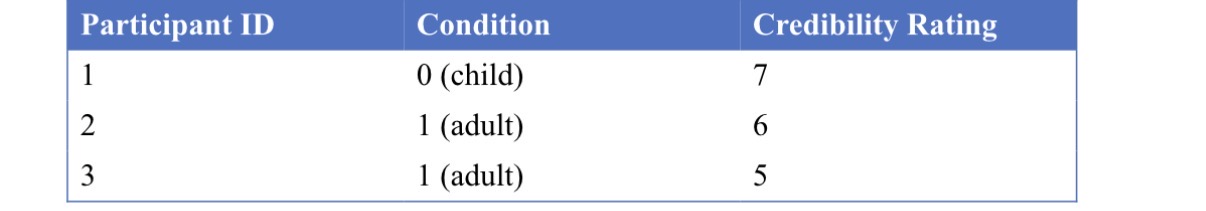
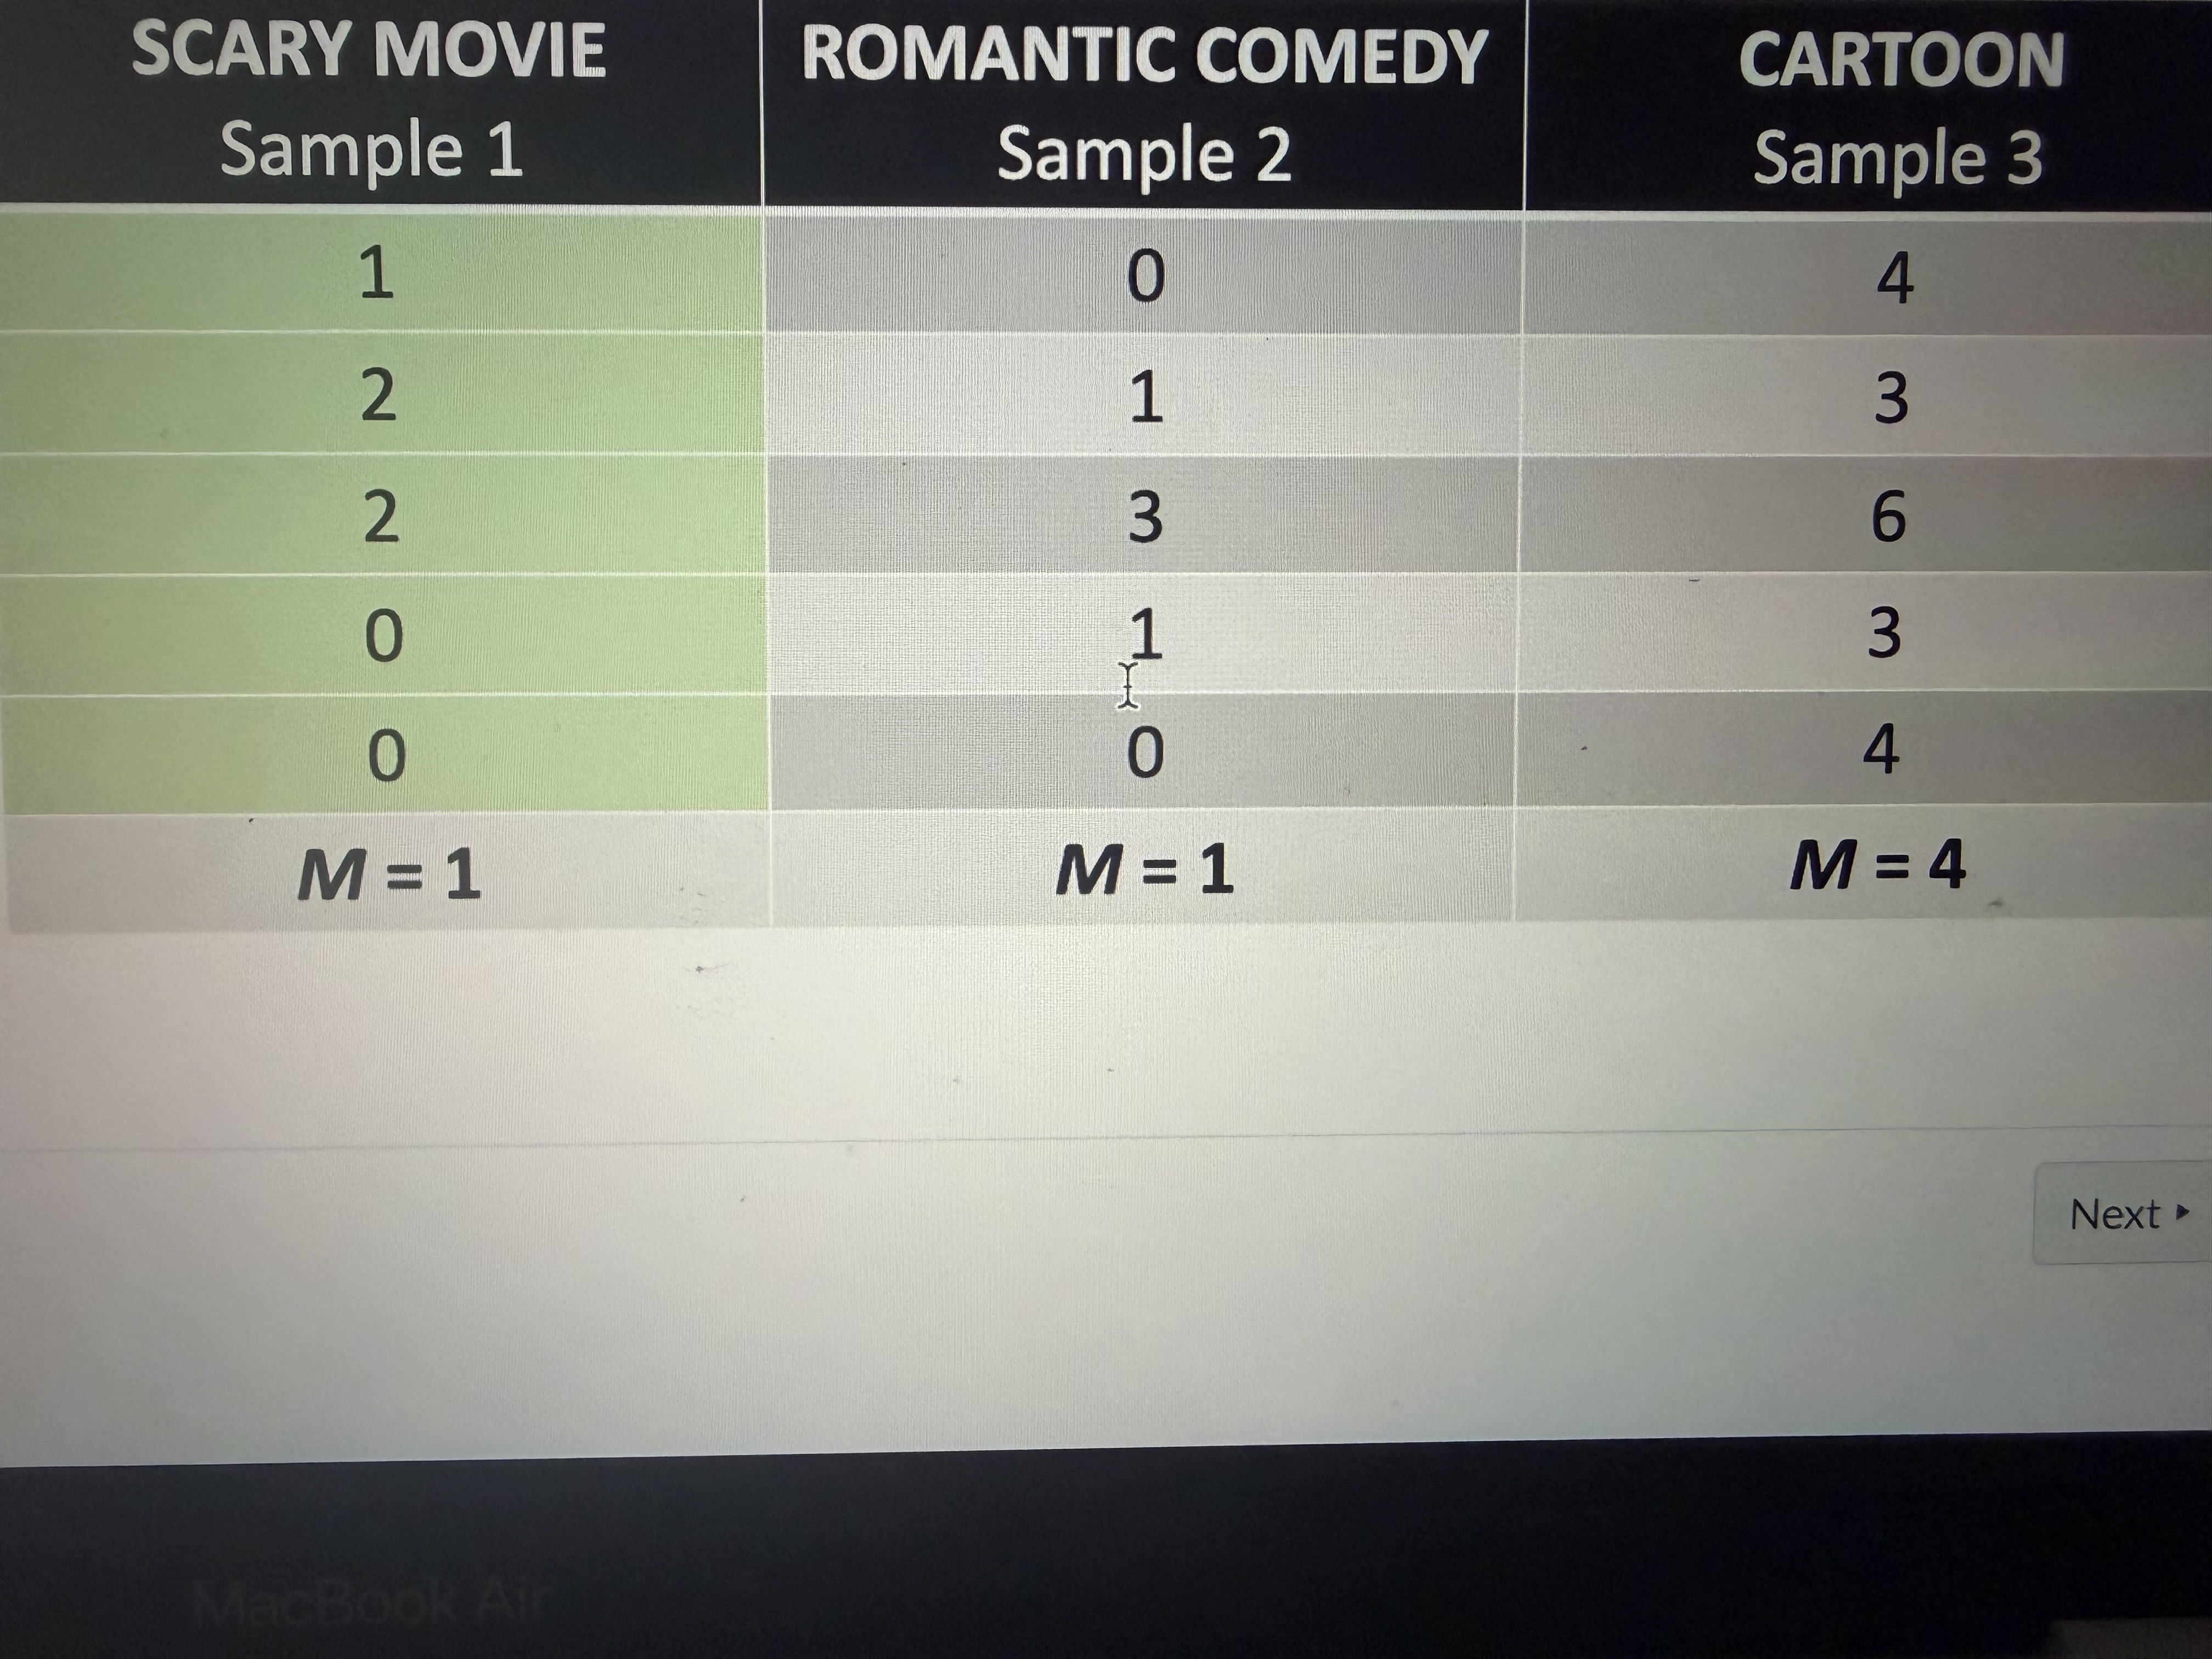
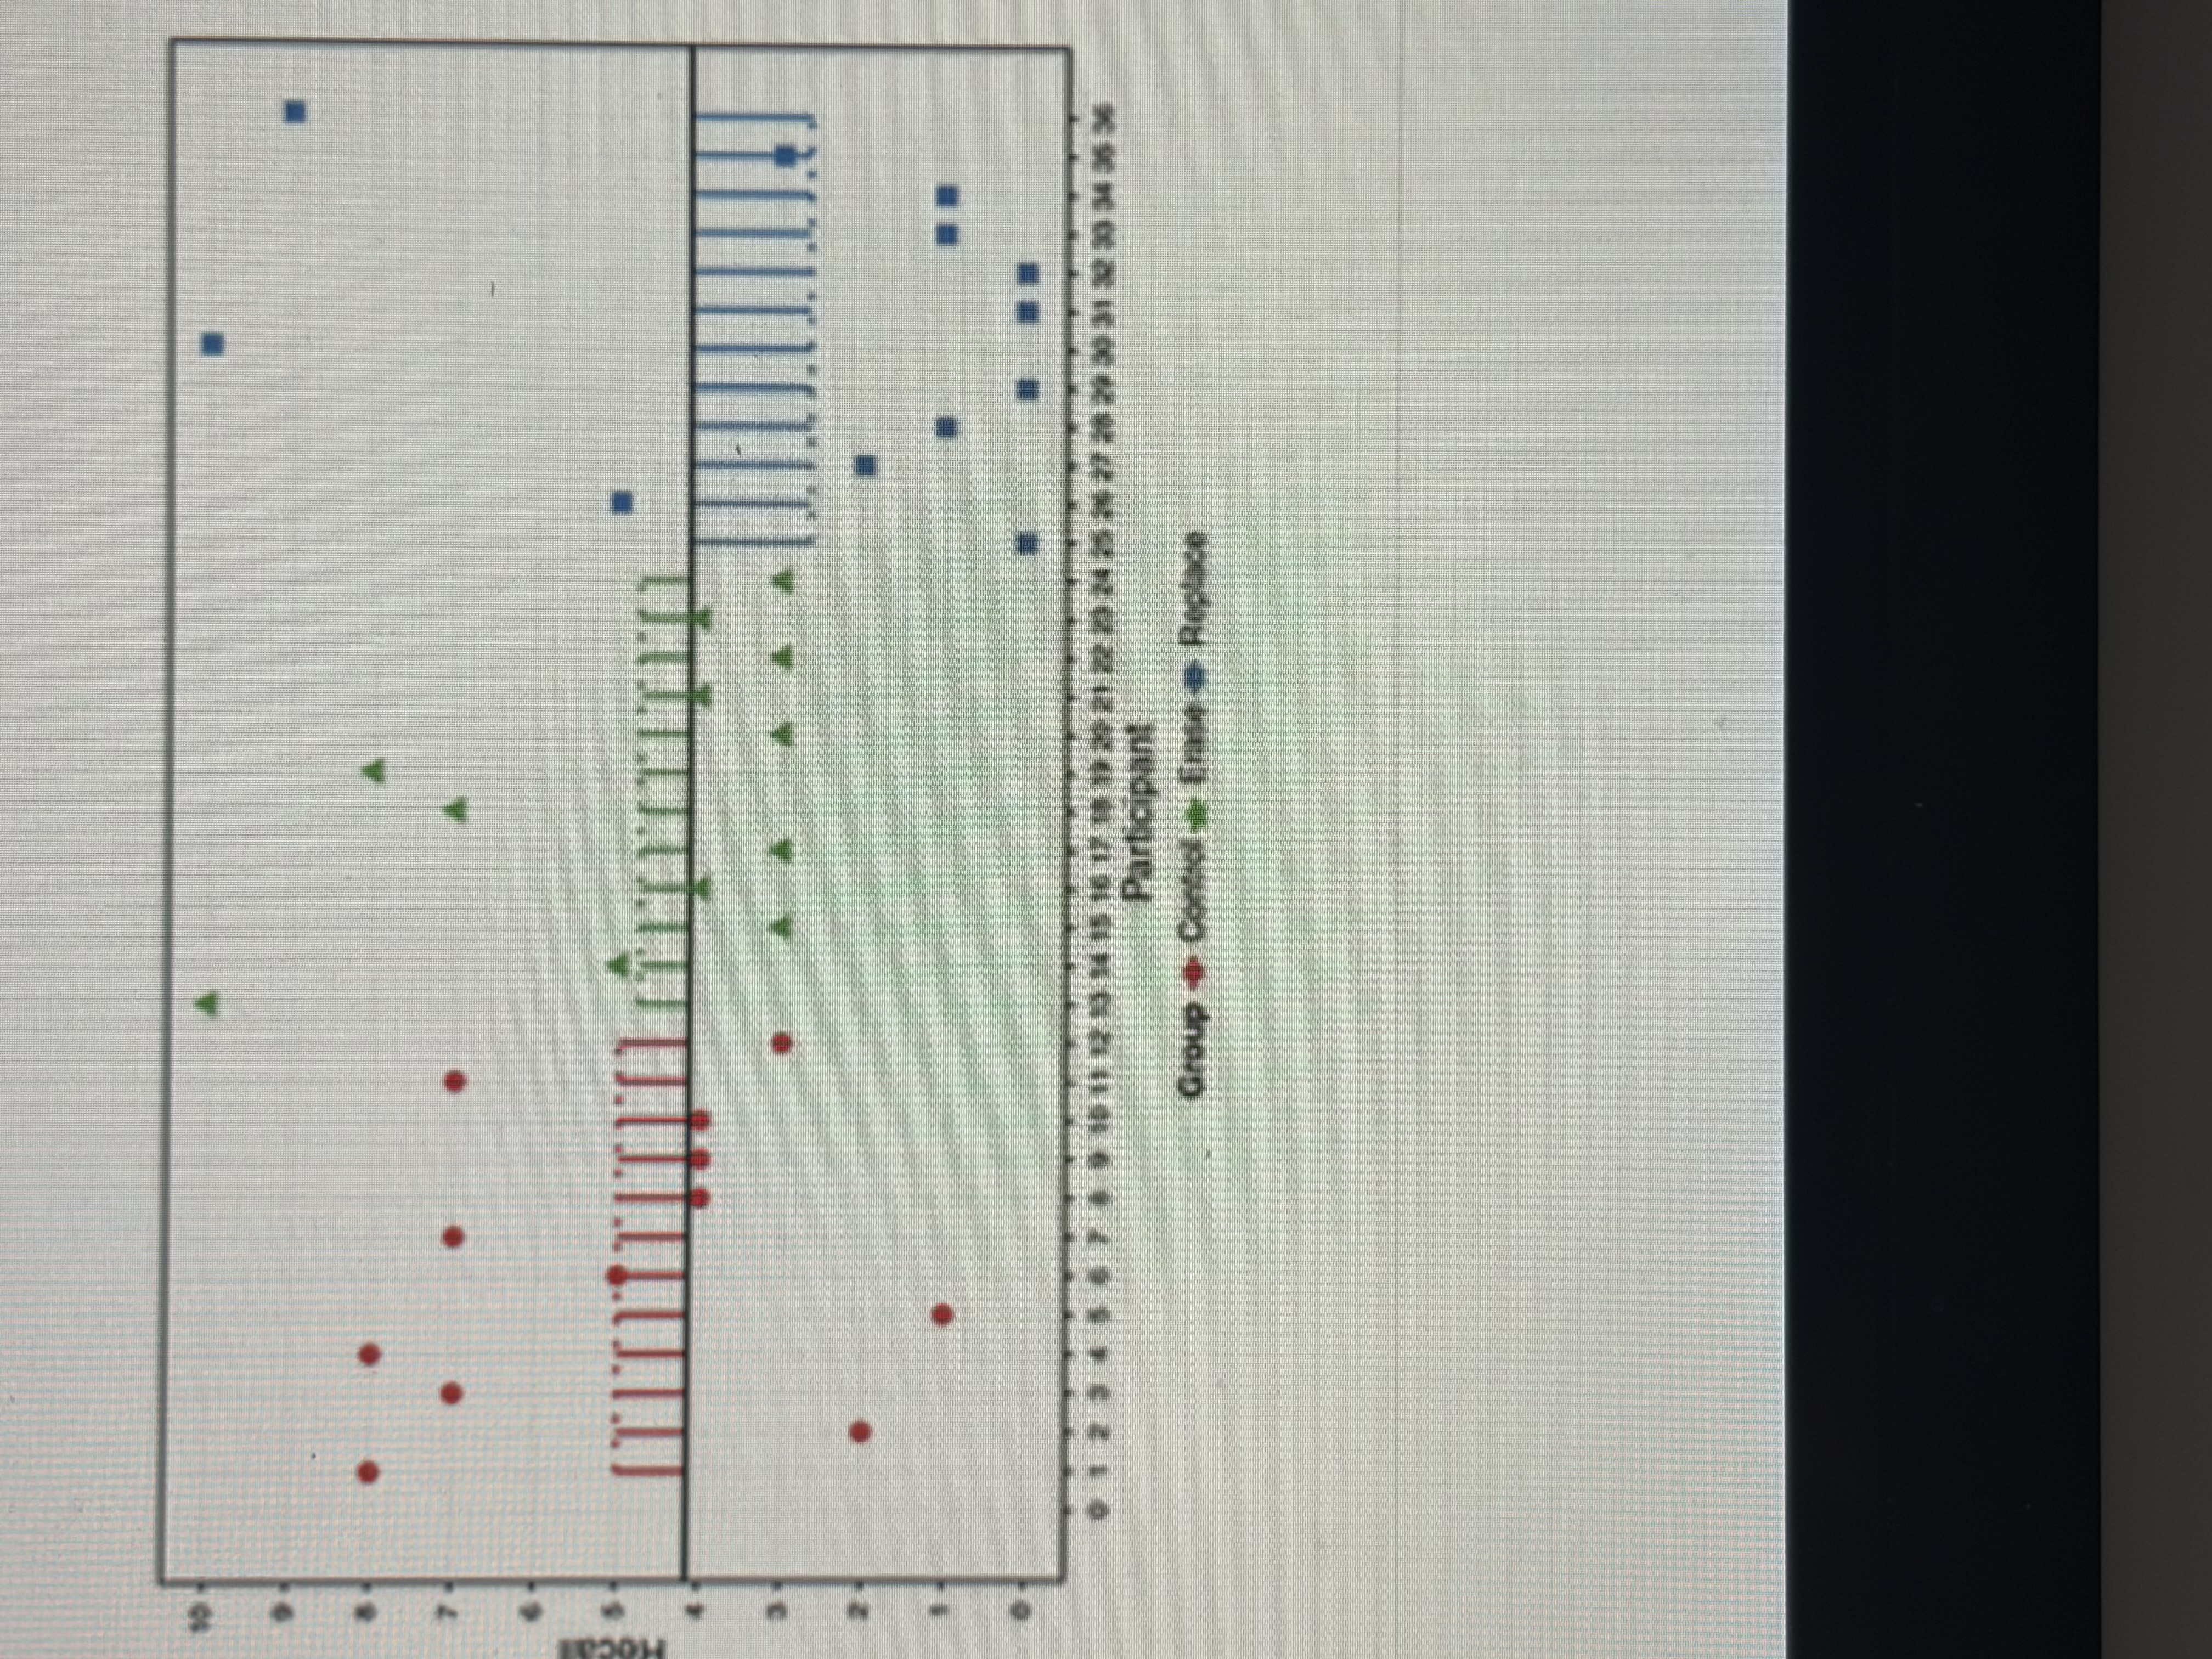
What type of t-test is this
Independent because 1 participant is only in 1 condition

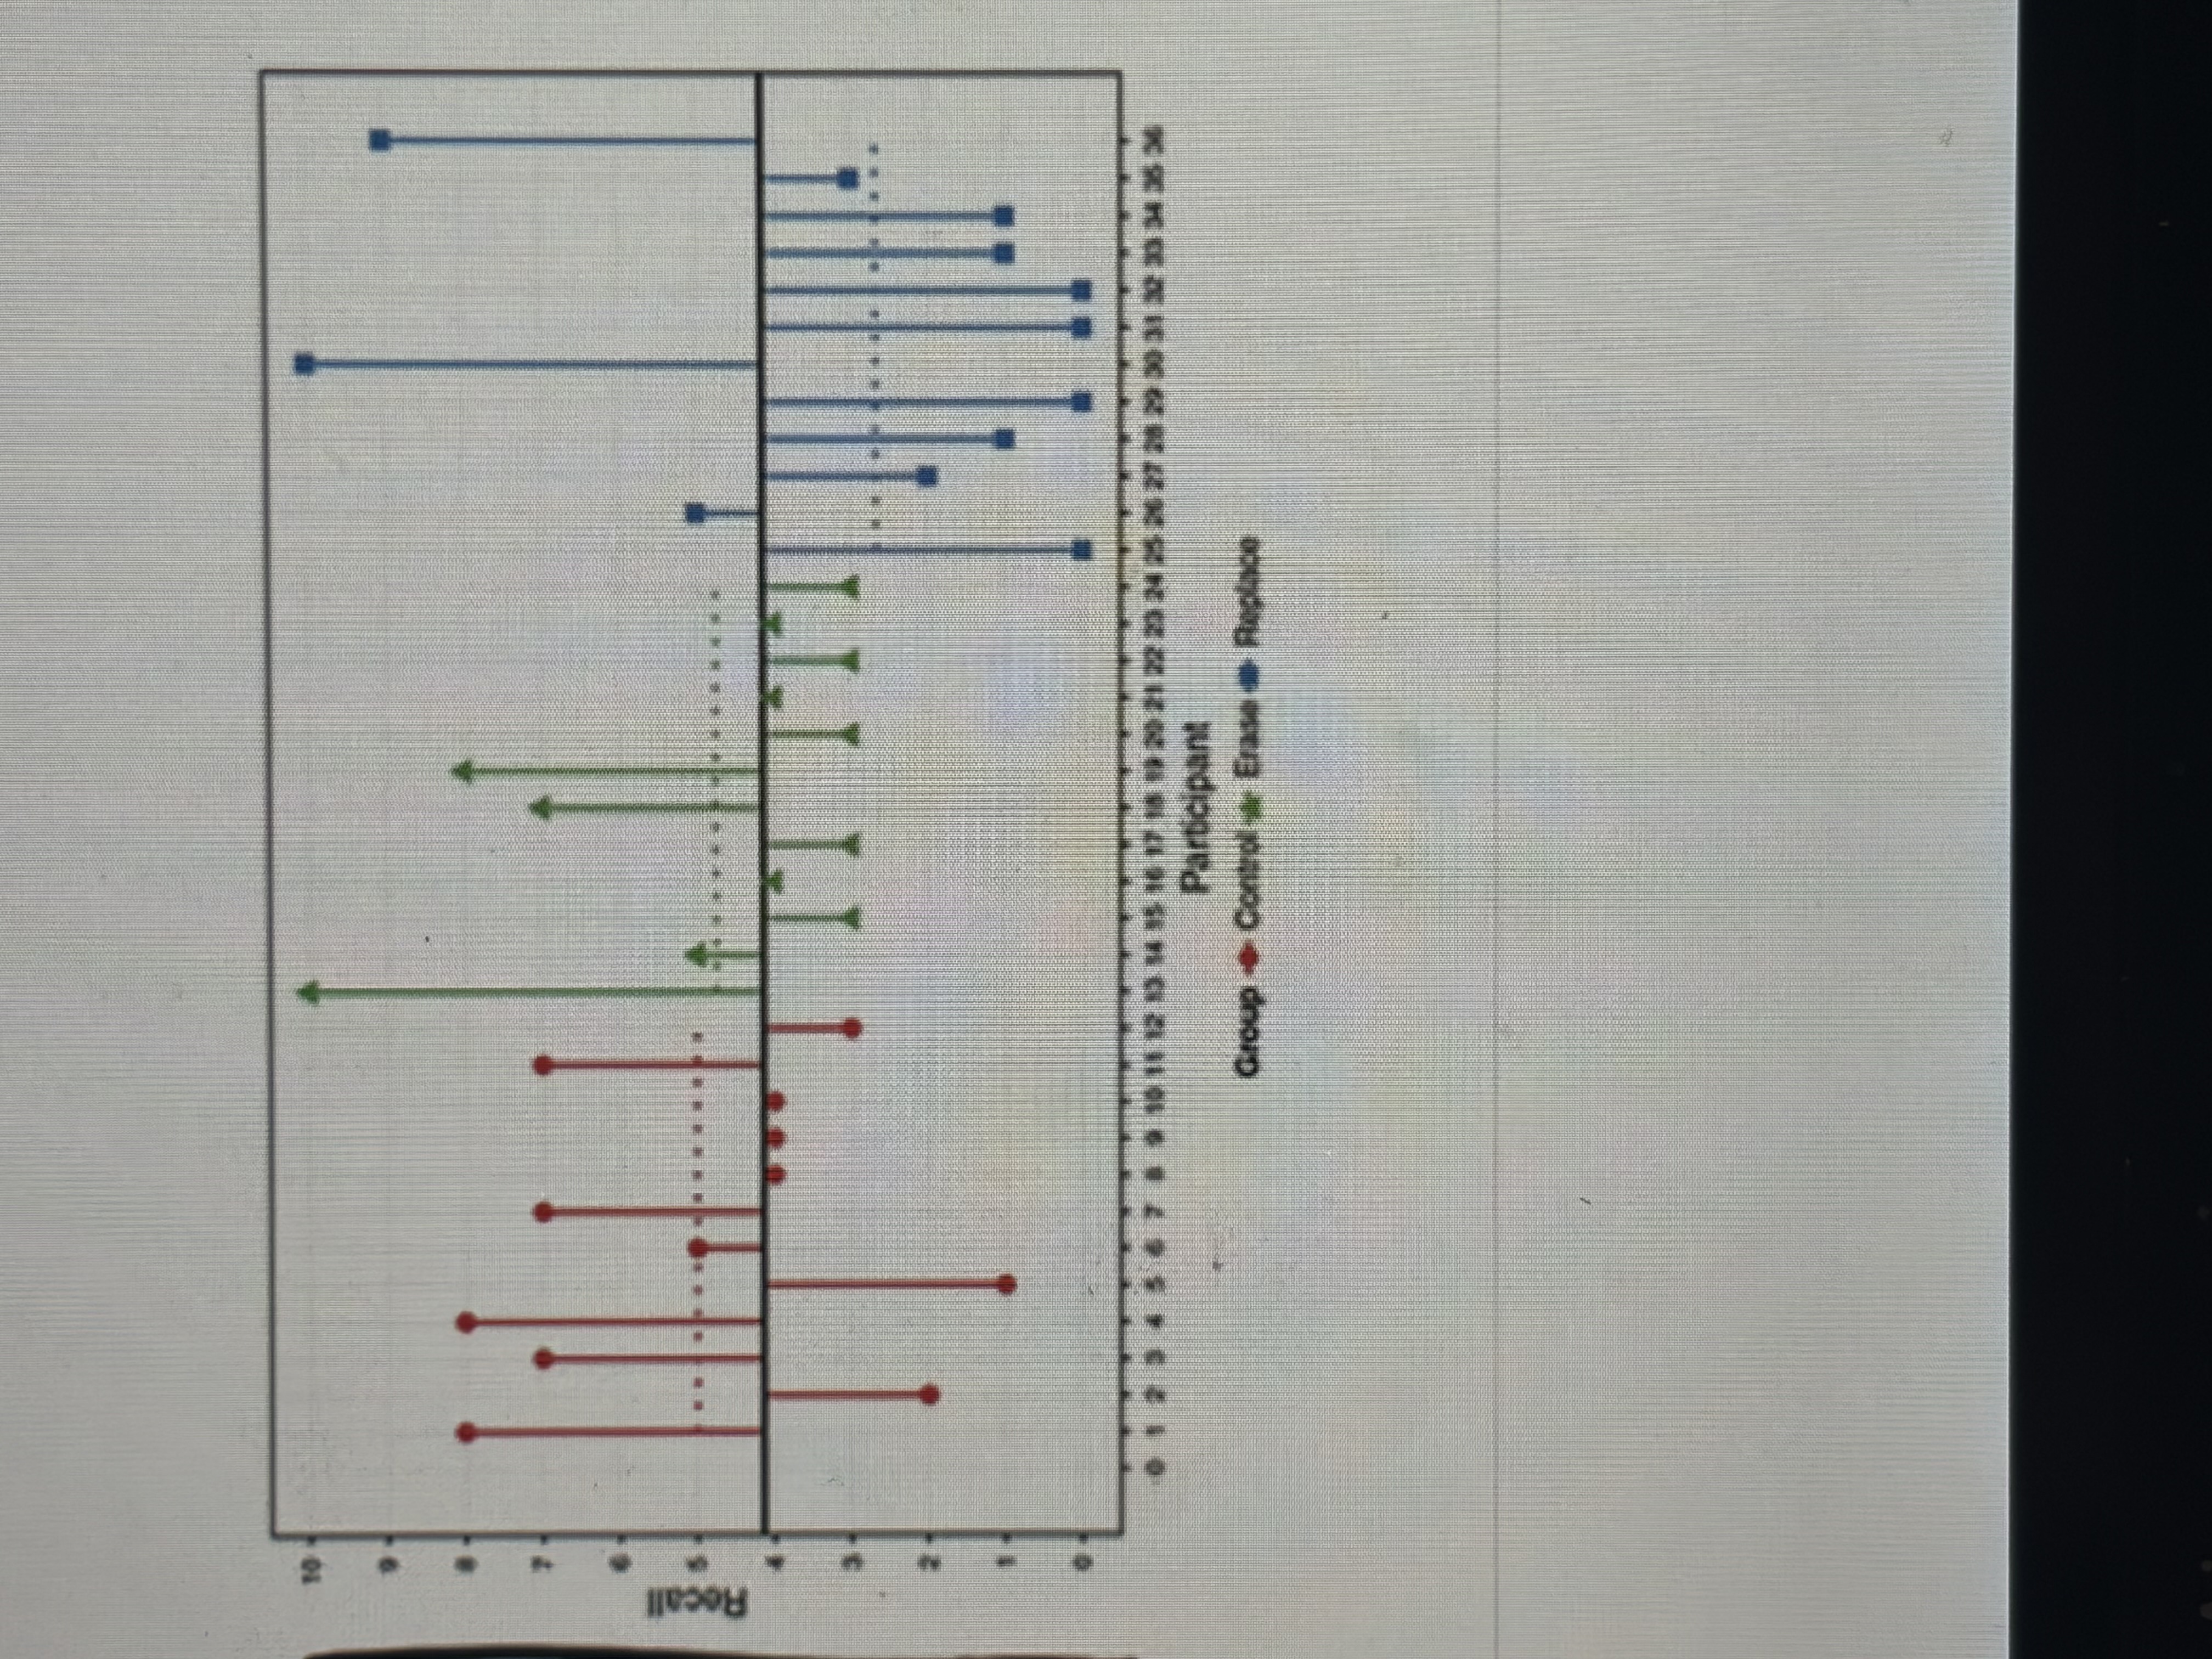
What type of t-test is this
Paired samples because each participant is in multiple conditions
The simplest form of an experiment
One that has 1 IV manipulated in 2 ways and 1 DV
Eg: does listening to music help with exam performance (IV= music and no music DV=grades)
When can independent t-test be used
When there’s 2 IV levels and 1 DV
Null hypothesis
There’s no effect (t-test null = no difference between means)
Alternative hypothesis
There’s a real effect (t-test alternative null = 2 means come from different distributions)
P<.05
Reject null (there’s a difference)
P>.05
Fail to reject the null (there’s no difference)
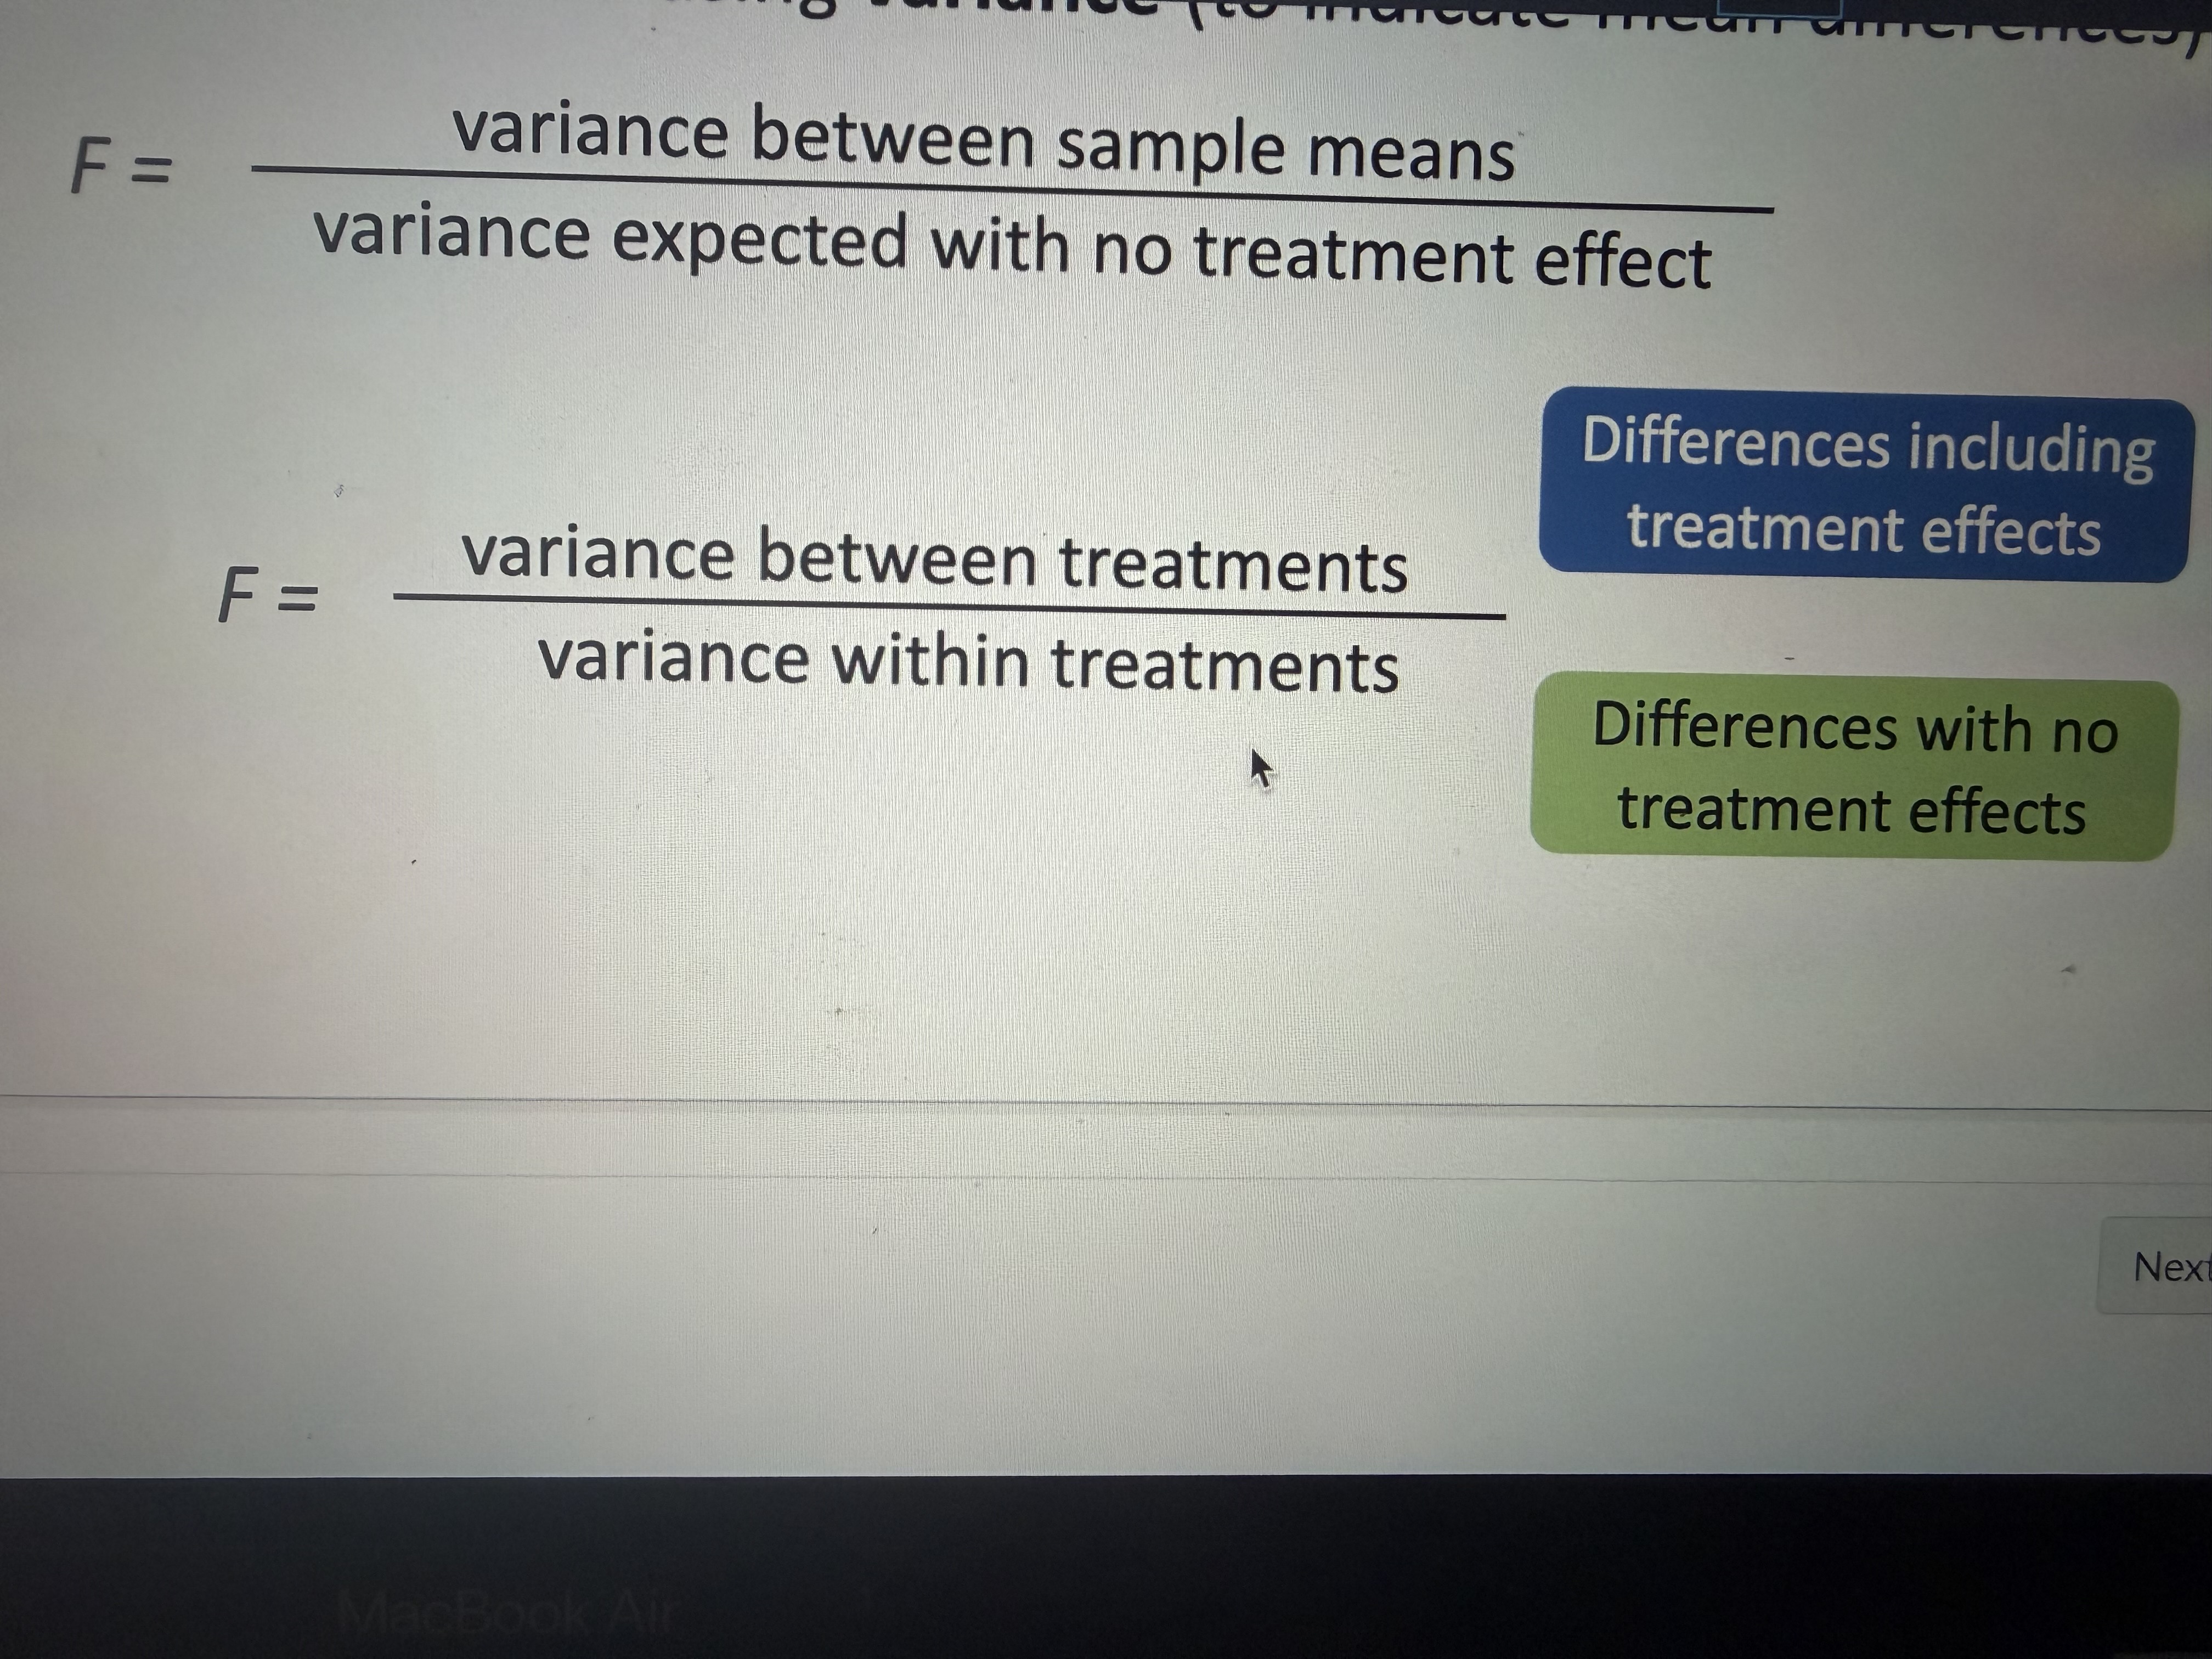
Test statistic equation
Variance explained by the model (effect)
Variance not explained by model (error)
*want the top part to be bigger*
Assumptions of independent t-test
Scores are independent, normality, homogeneity of variance
How to we calculate homogeneity of variance
Levens test (want this to be non significant)
What does it mean if CI don’t overlap
Both CI contain the mean but come from different populations
Both samples come from same population but one (or none) contain the mean
What does it mean if you CI contains 0 (eg. -0.314, 2.378)
Cannot reject the null (don’t have a significant effect)
What does it mean if CI doesn’t contain 0 (eg. 0.782, 7.218)
Can reject the null
Effect size
Tells you the magnitude of your effect and is not dependent on sample size
Cohens D equation
D= estimated mean difference
Estimated standard deviation
D= 0.20
Small effect
D= 0.50
Medium effect
D= 0.80
Large effect
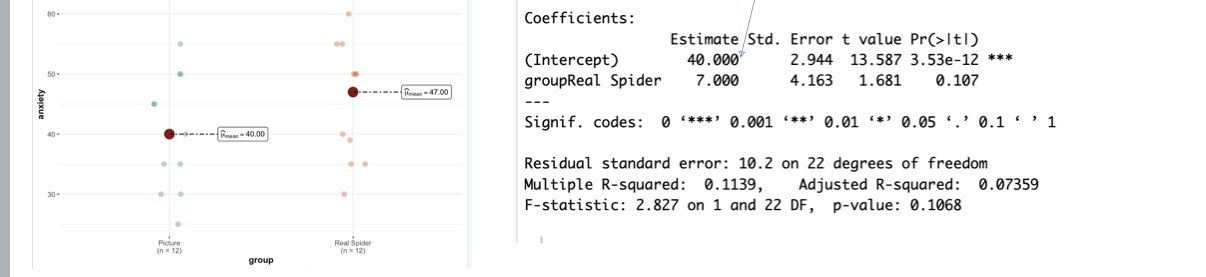
What does value for 40 and 7 mean
40= the intercept
7= the increase for every 1 unit
Pros of within subject research design
Exact same people are in both groups
Desire removed extra noise
Cons of within subject designs
Time may have an effect on scores
Order effects
Practice effects
We can fix this using counterbalancing
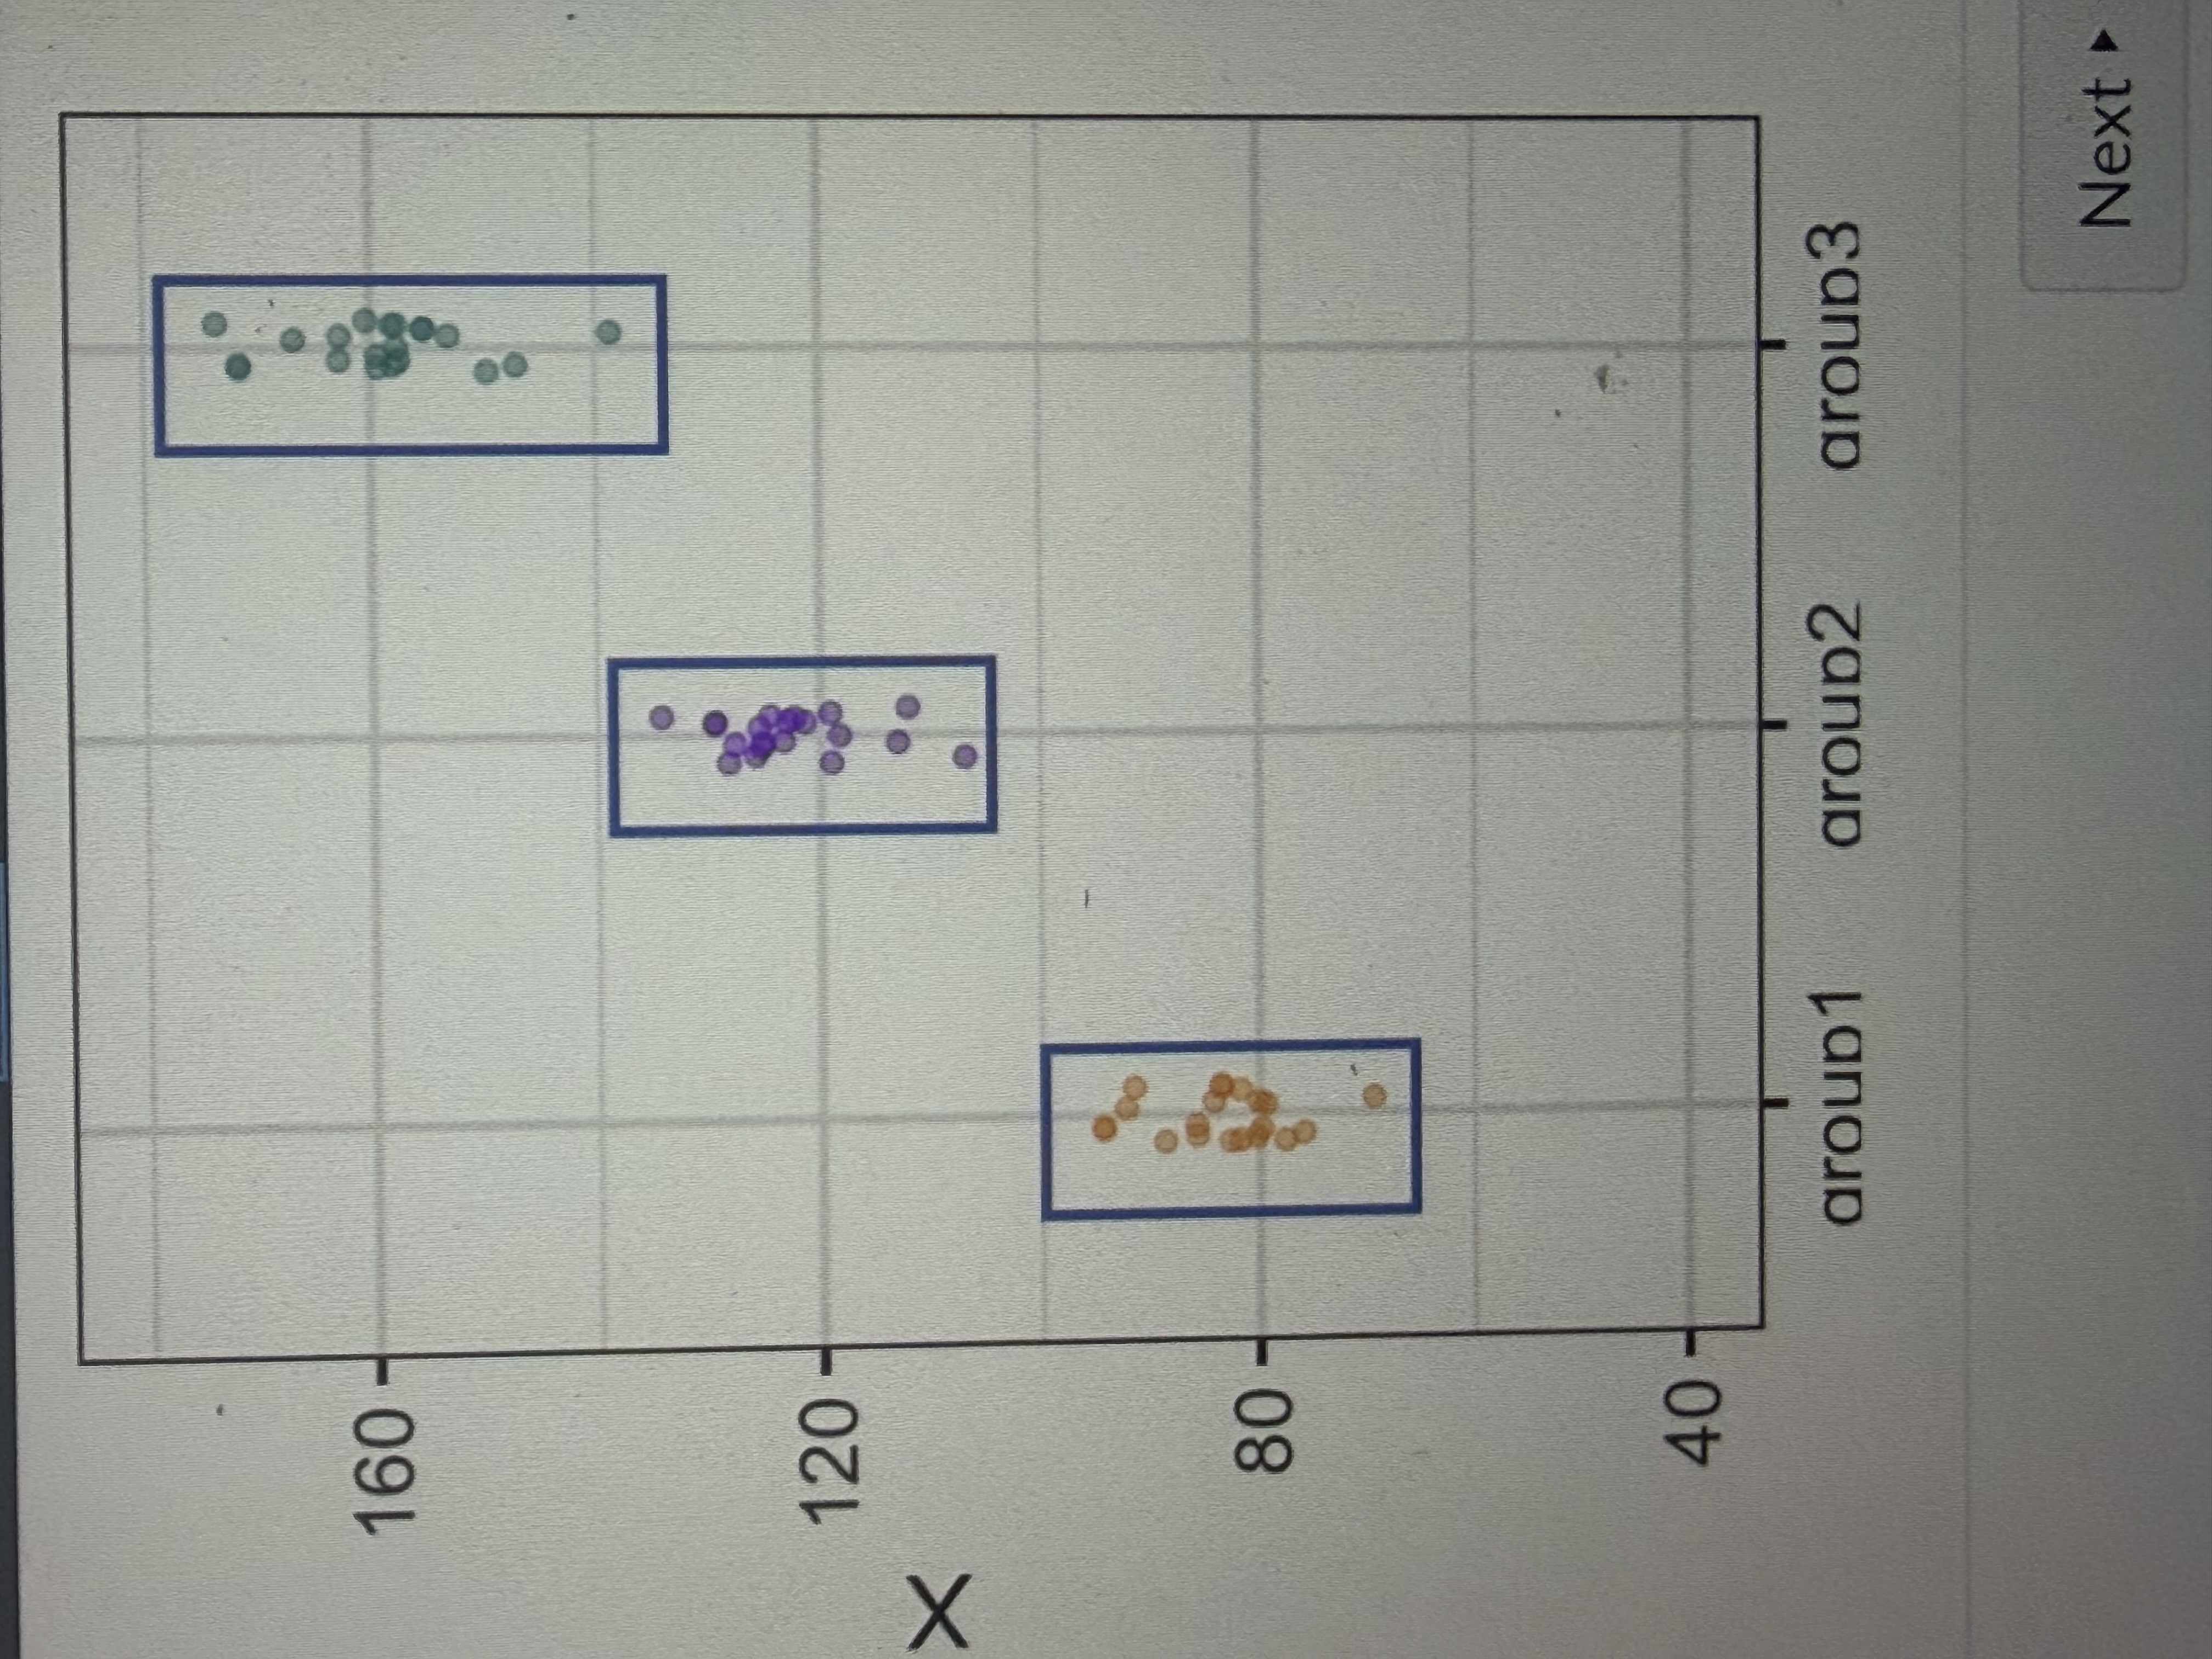
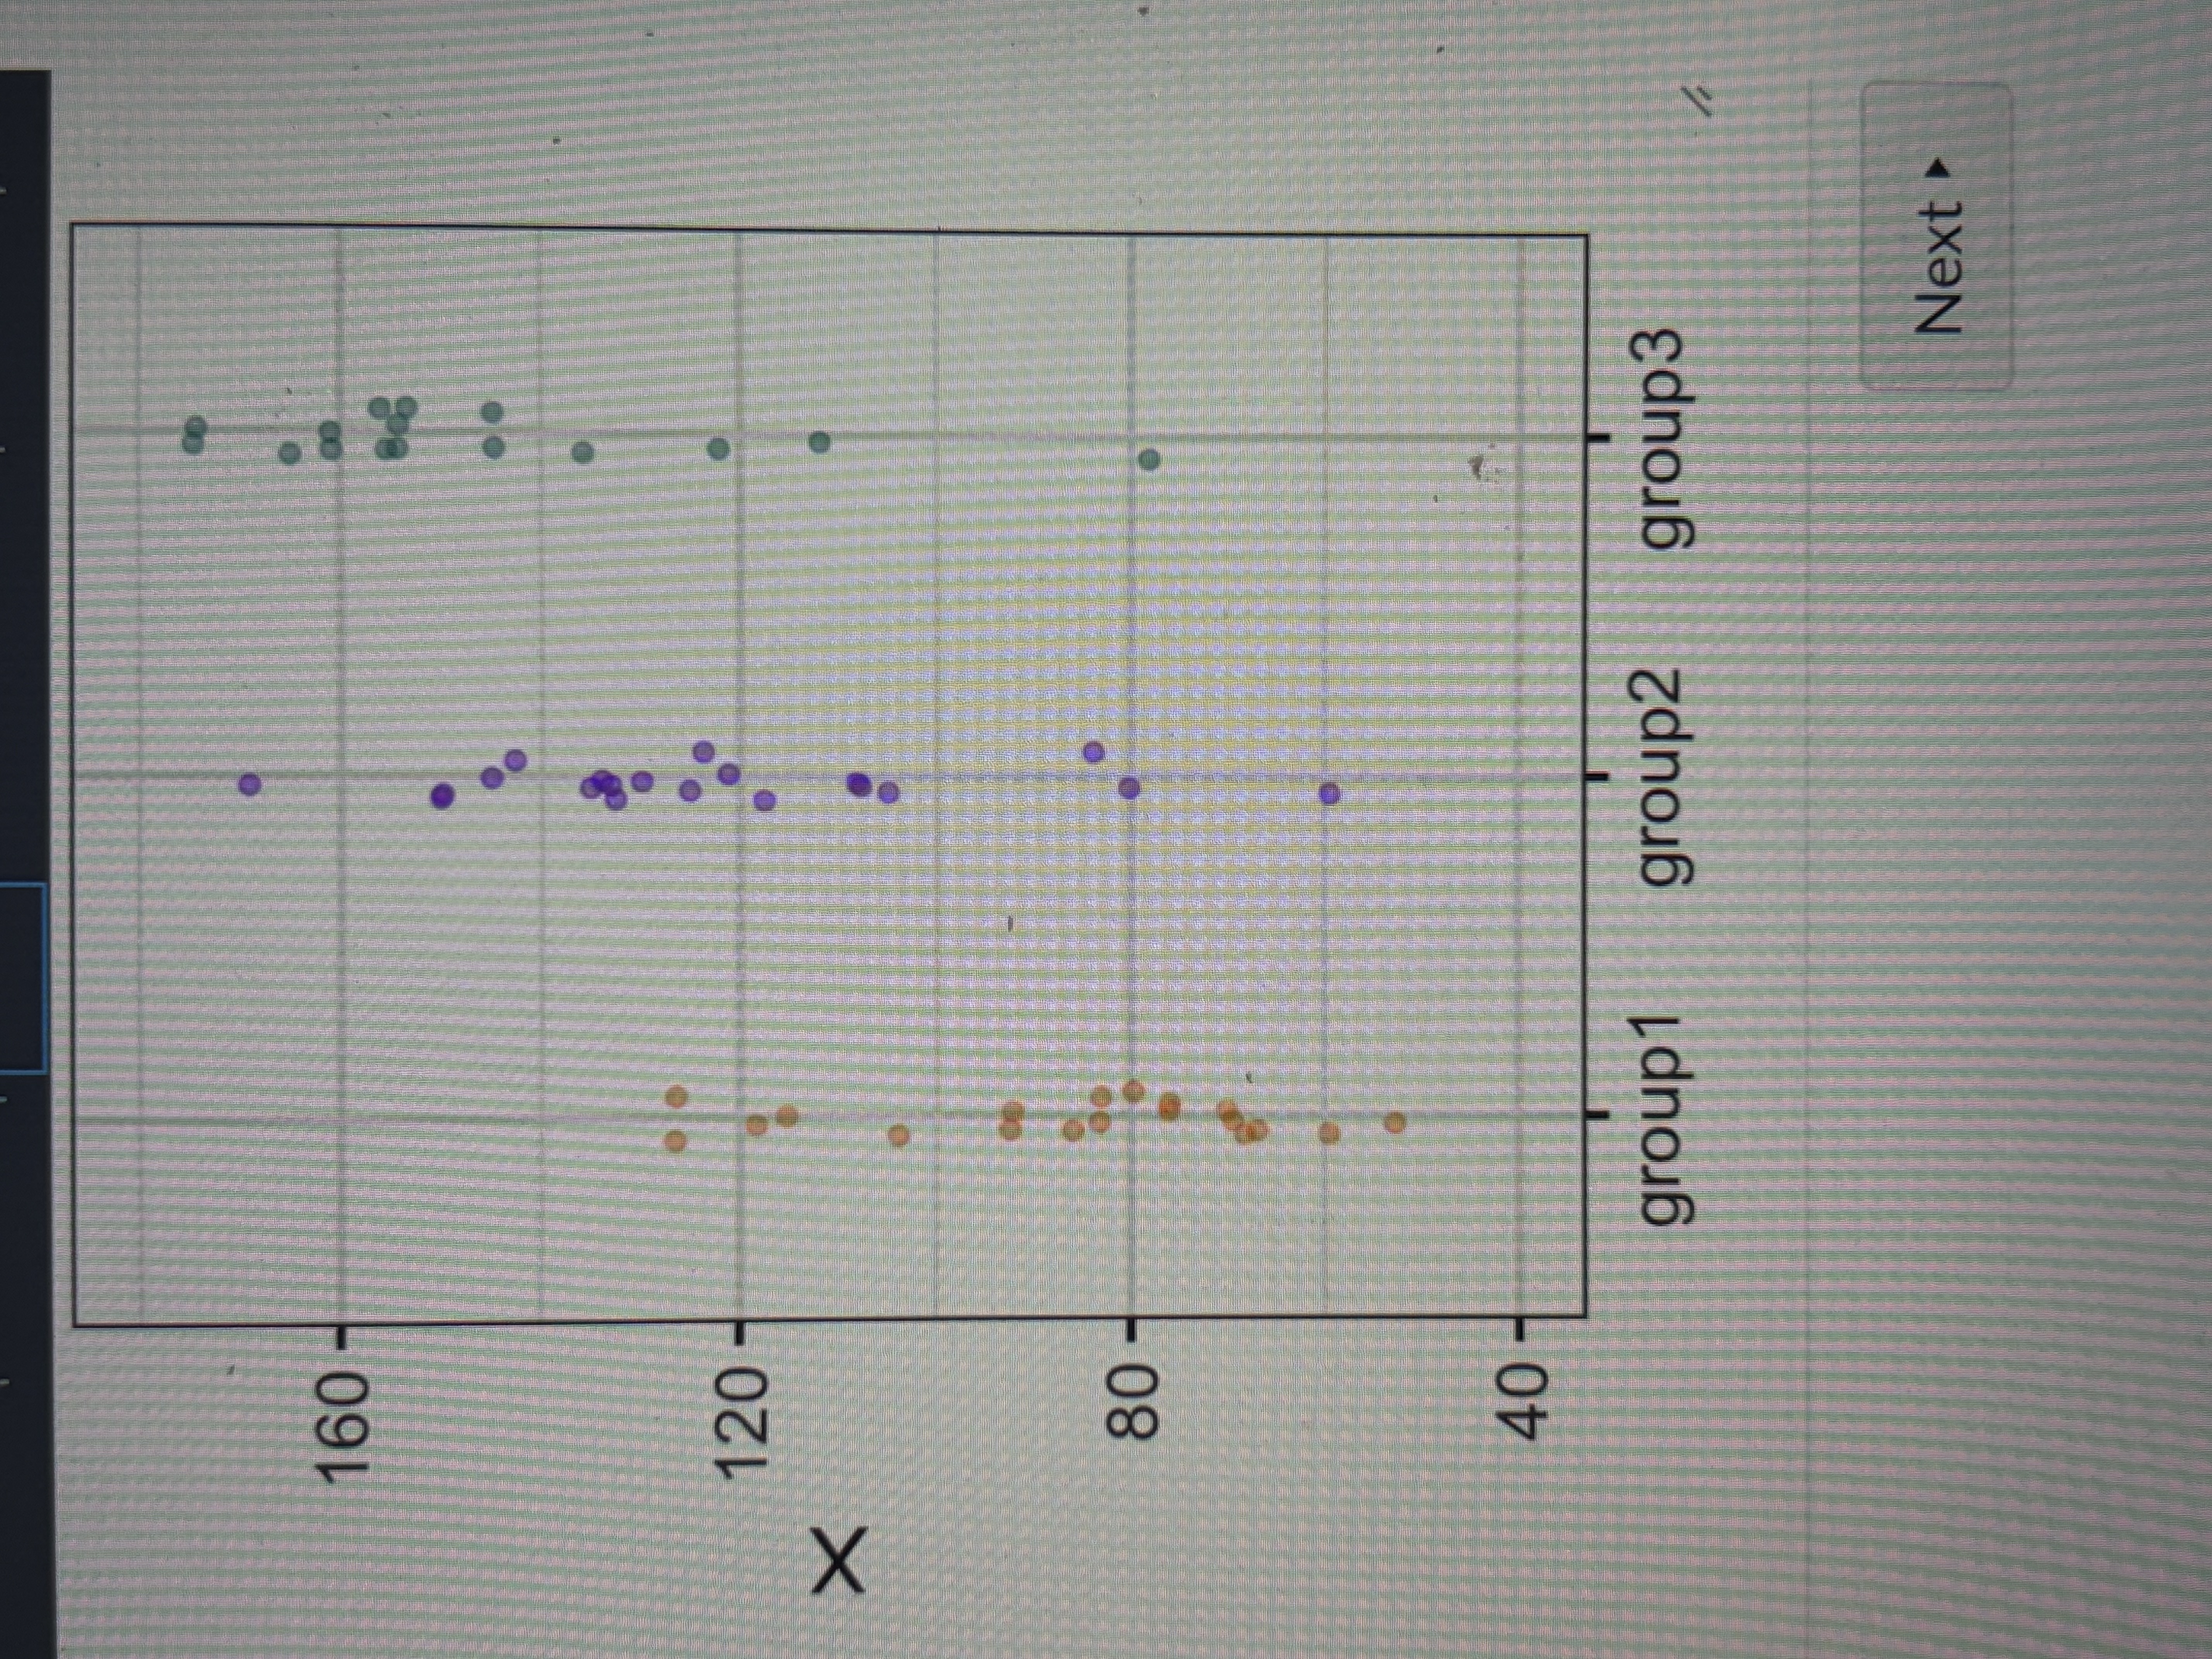
ANOVA (analysis of variance)
Tests mean differences between 2+ (several) groups —> must have a categorical IV and a continuous DV
Goal of ANOVA
To see if there’s a significant mean difference between groups
Types of ANOVAS
Between subjects
Within subjects
One way
Factorial
Repeated measure
Between subjects ANOVA (one way)
compares means form 2+ separate groups
Within subjects ANOVA (RM)
Comparing 2+ means within the same people
One way ANOVA
Examining only 1 factor
Eg. Mean vocabulary scores across 3 age groups (3,5,7). IV is age and this has 3 levels
Factorial ANOVA (2-way, 3-way, 4-way, etc.)
Examining more than 1 factor (IV)
Eg. Mean vocabulary scores across age groups and gender (can be within or between subjects or mixed)
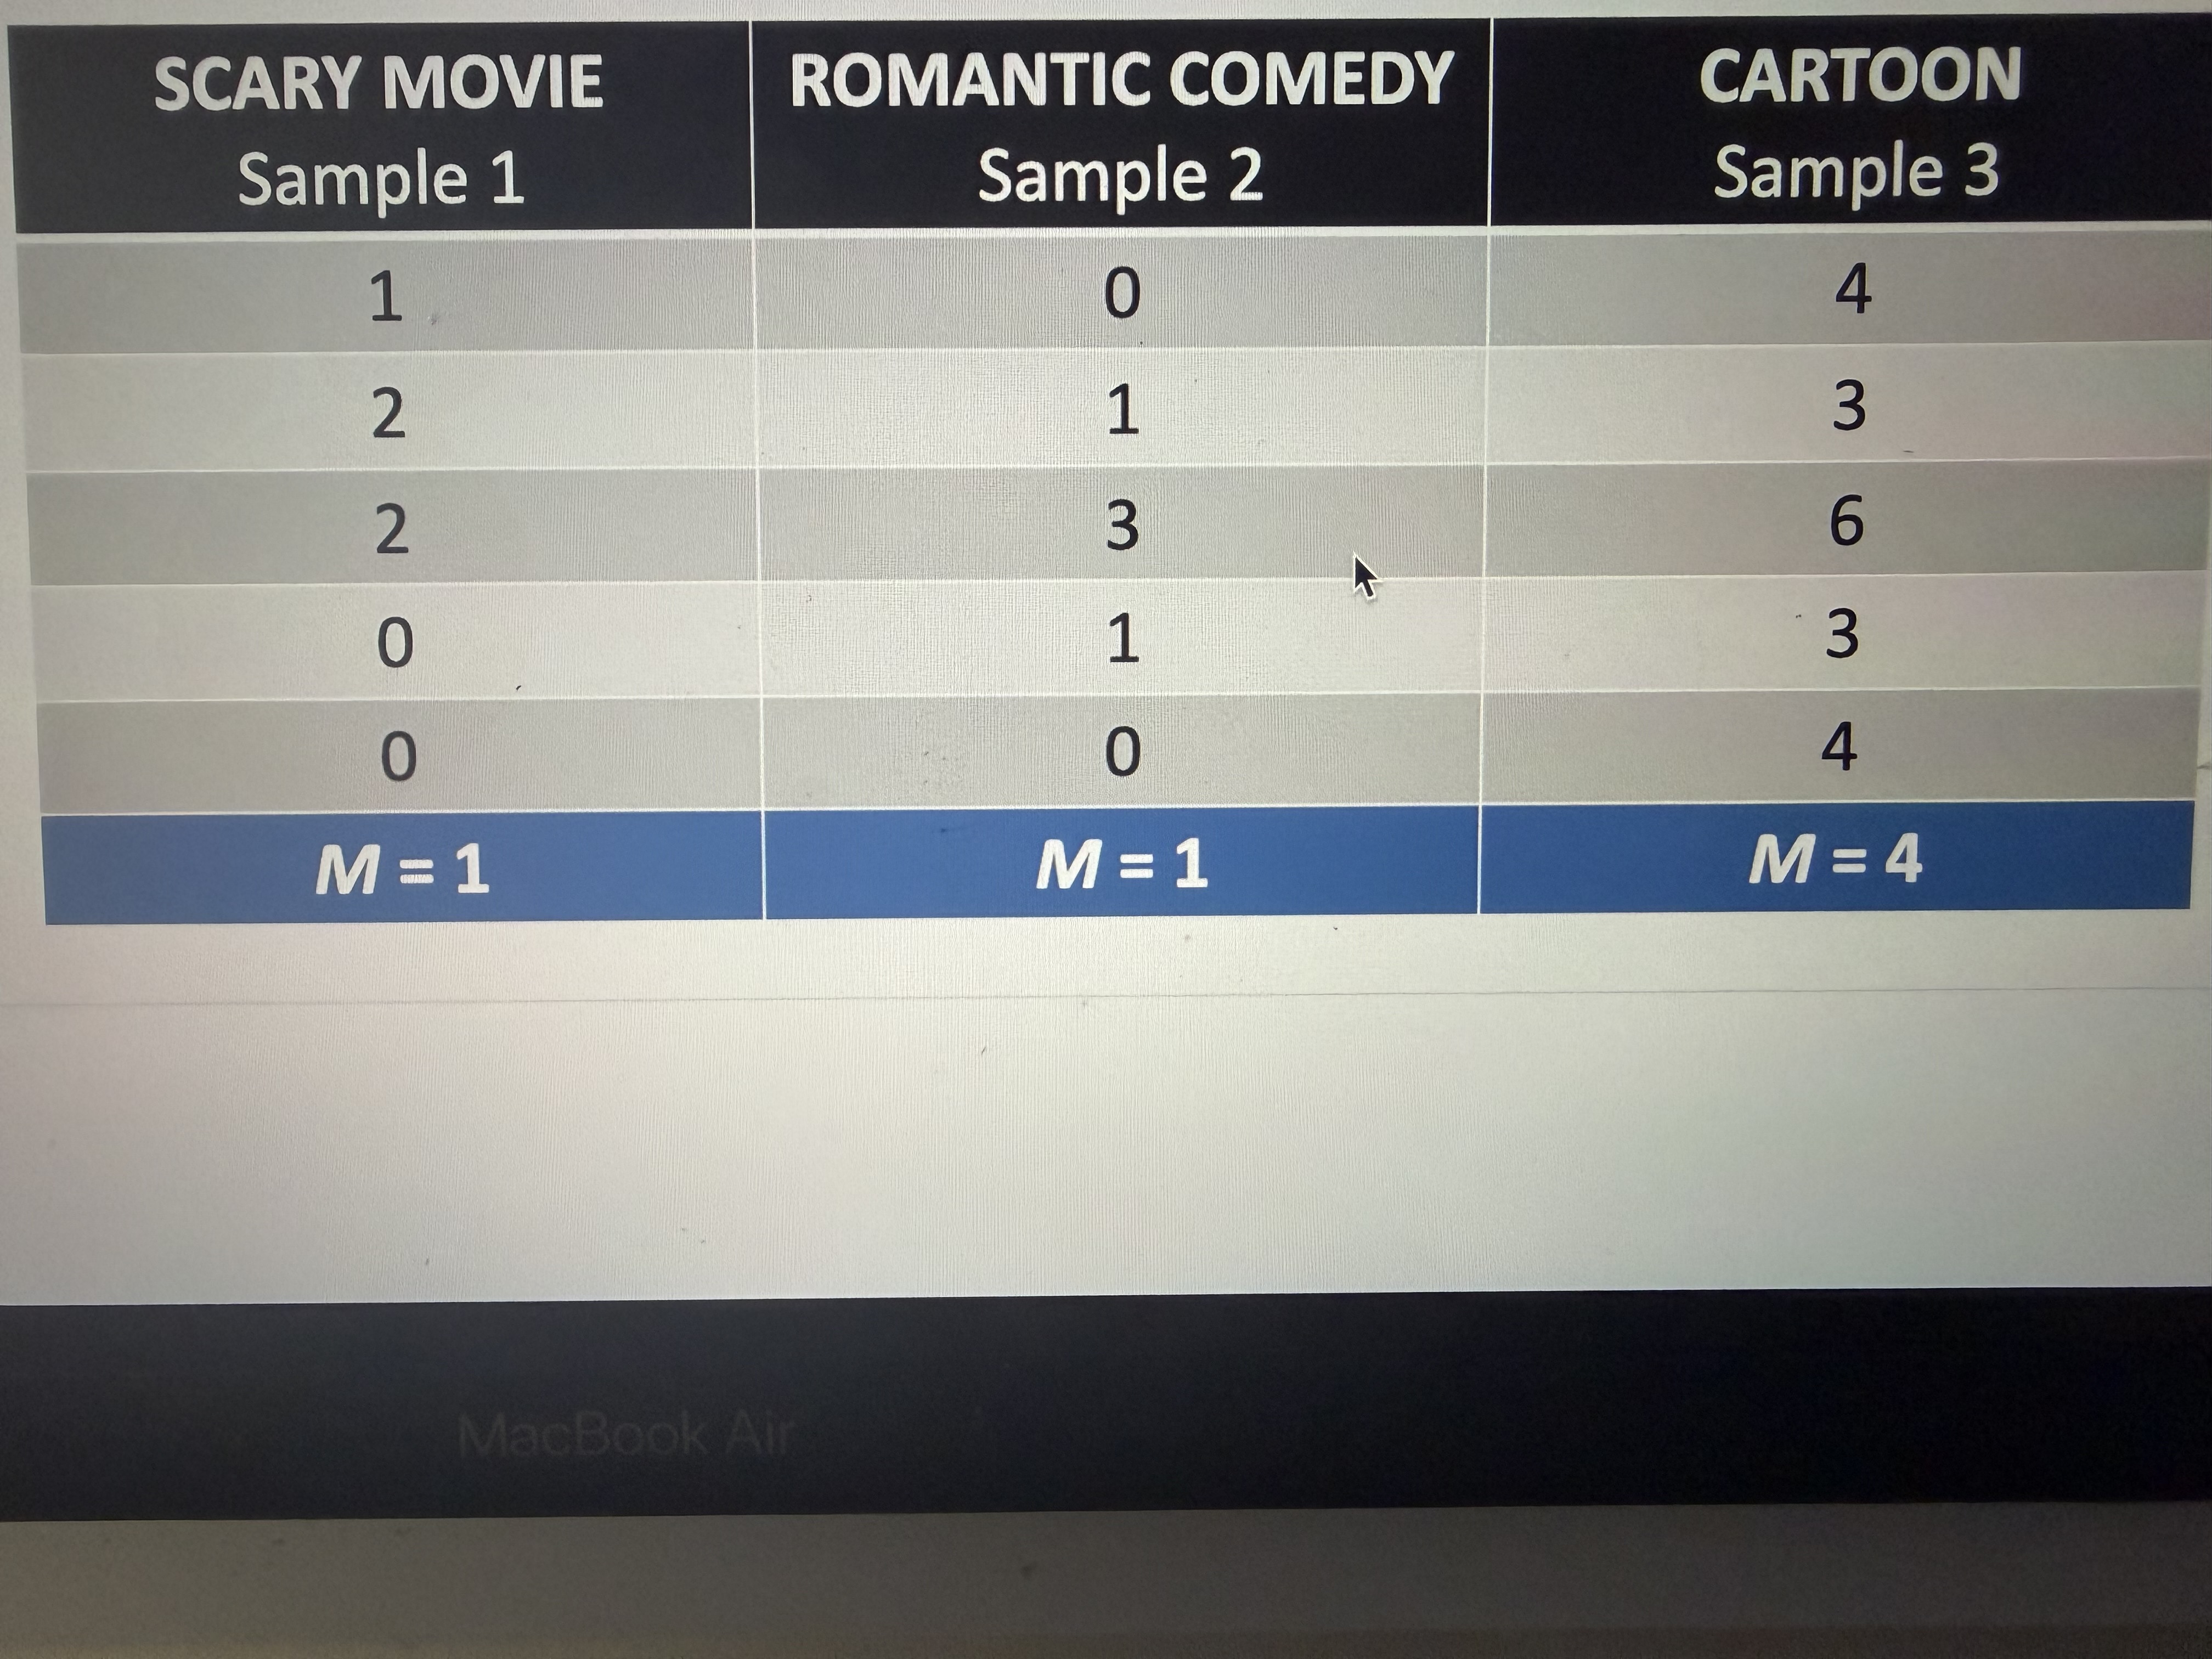
How does ANOVA calculate variance
Calculates total variance ten separates it into between-treatments and within treatments variances
Do we want a large f value
Yes (#of explained variance)
Type of variance
Between treatments
Type of variance
Within treatments
Would this F value be small to large
Large because the variance is small
Is this F value small or large
Small because it’s spread out which indicates a larger variance
ANOVA assumptions
Observations in each sample must be independent
Normality (qq plot or histogram)
Homogeneity (levens test—> sig= bad)
What do we do if our levens test is sig in our ANOVA
Welsh test
Effect size ANOVA
ETA squared (n²) = effect size for between subject ANOVA
n² equation for ANOVA (effect size)
N² = ss between
ss total
N²= 0.01 ANOVA
Small effect
N²= 0.06 ANOVA
Medium effect
N²= 0.14 ANOVA and how to interpret it
Large effect; 14% of the variance is explained by between subject treatment
Between groups df equation
K (number of groups) - 1
Within subjects df equation
N (number of people) - K (number of groups)
When should you use post hoc
If u rejected null hypothesis
Have 3 or more treatments (k>3)
SSt- total variance in data
Difference between the observed data and grand mean
SSm accounts for
Variance explained by the model (improvement due to the model)
SSr accounts for
Unexplained variance (error)
SSt accounts for
Total variance in the data

SSr- unexplained variance
Difference between the observed data and group means (ignore black line in image) (error)
SSm- variance explained by the model
Difference between grand mean and group means (improvement due to model)
MSm equation
SSm
DFm
MSr equation
SSr
DFr
Benefits of factorial ANOVA
Helped and some more complex questions and takes into account the interactions of factors
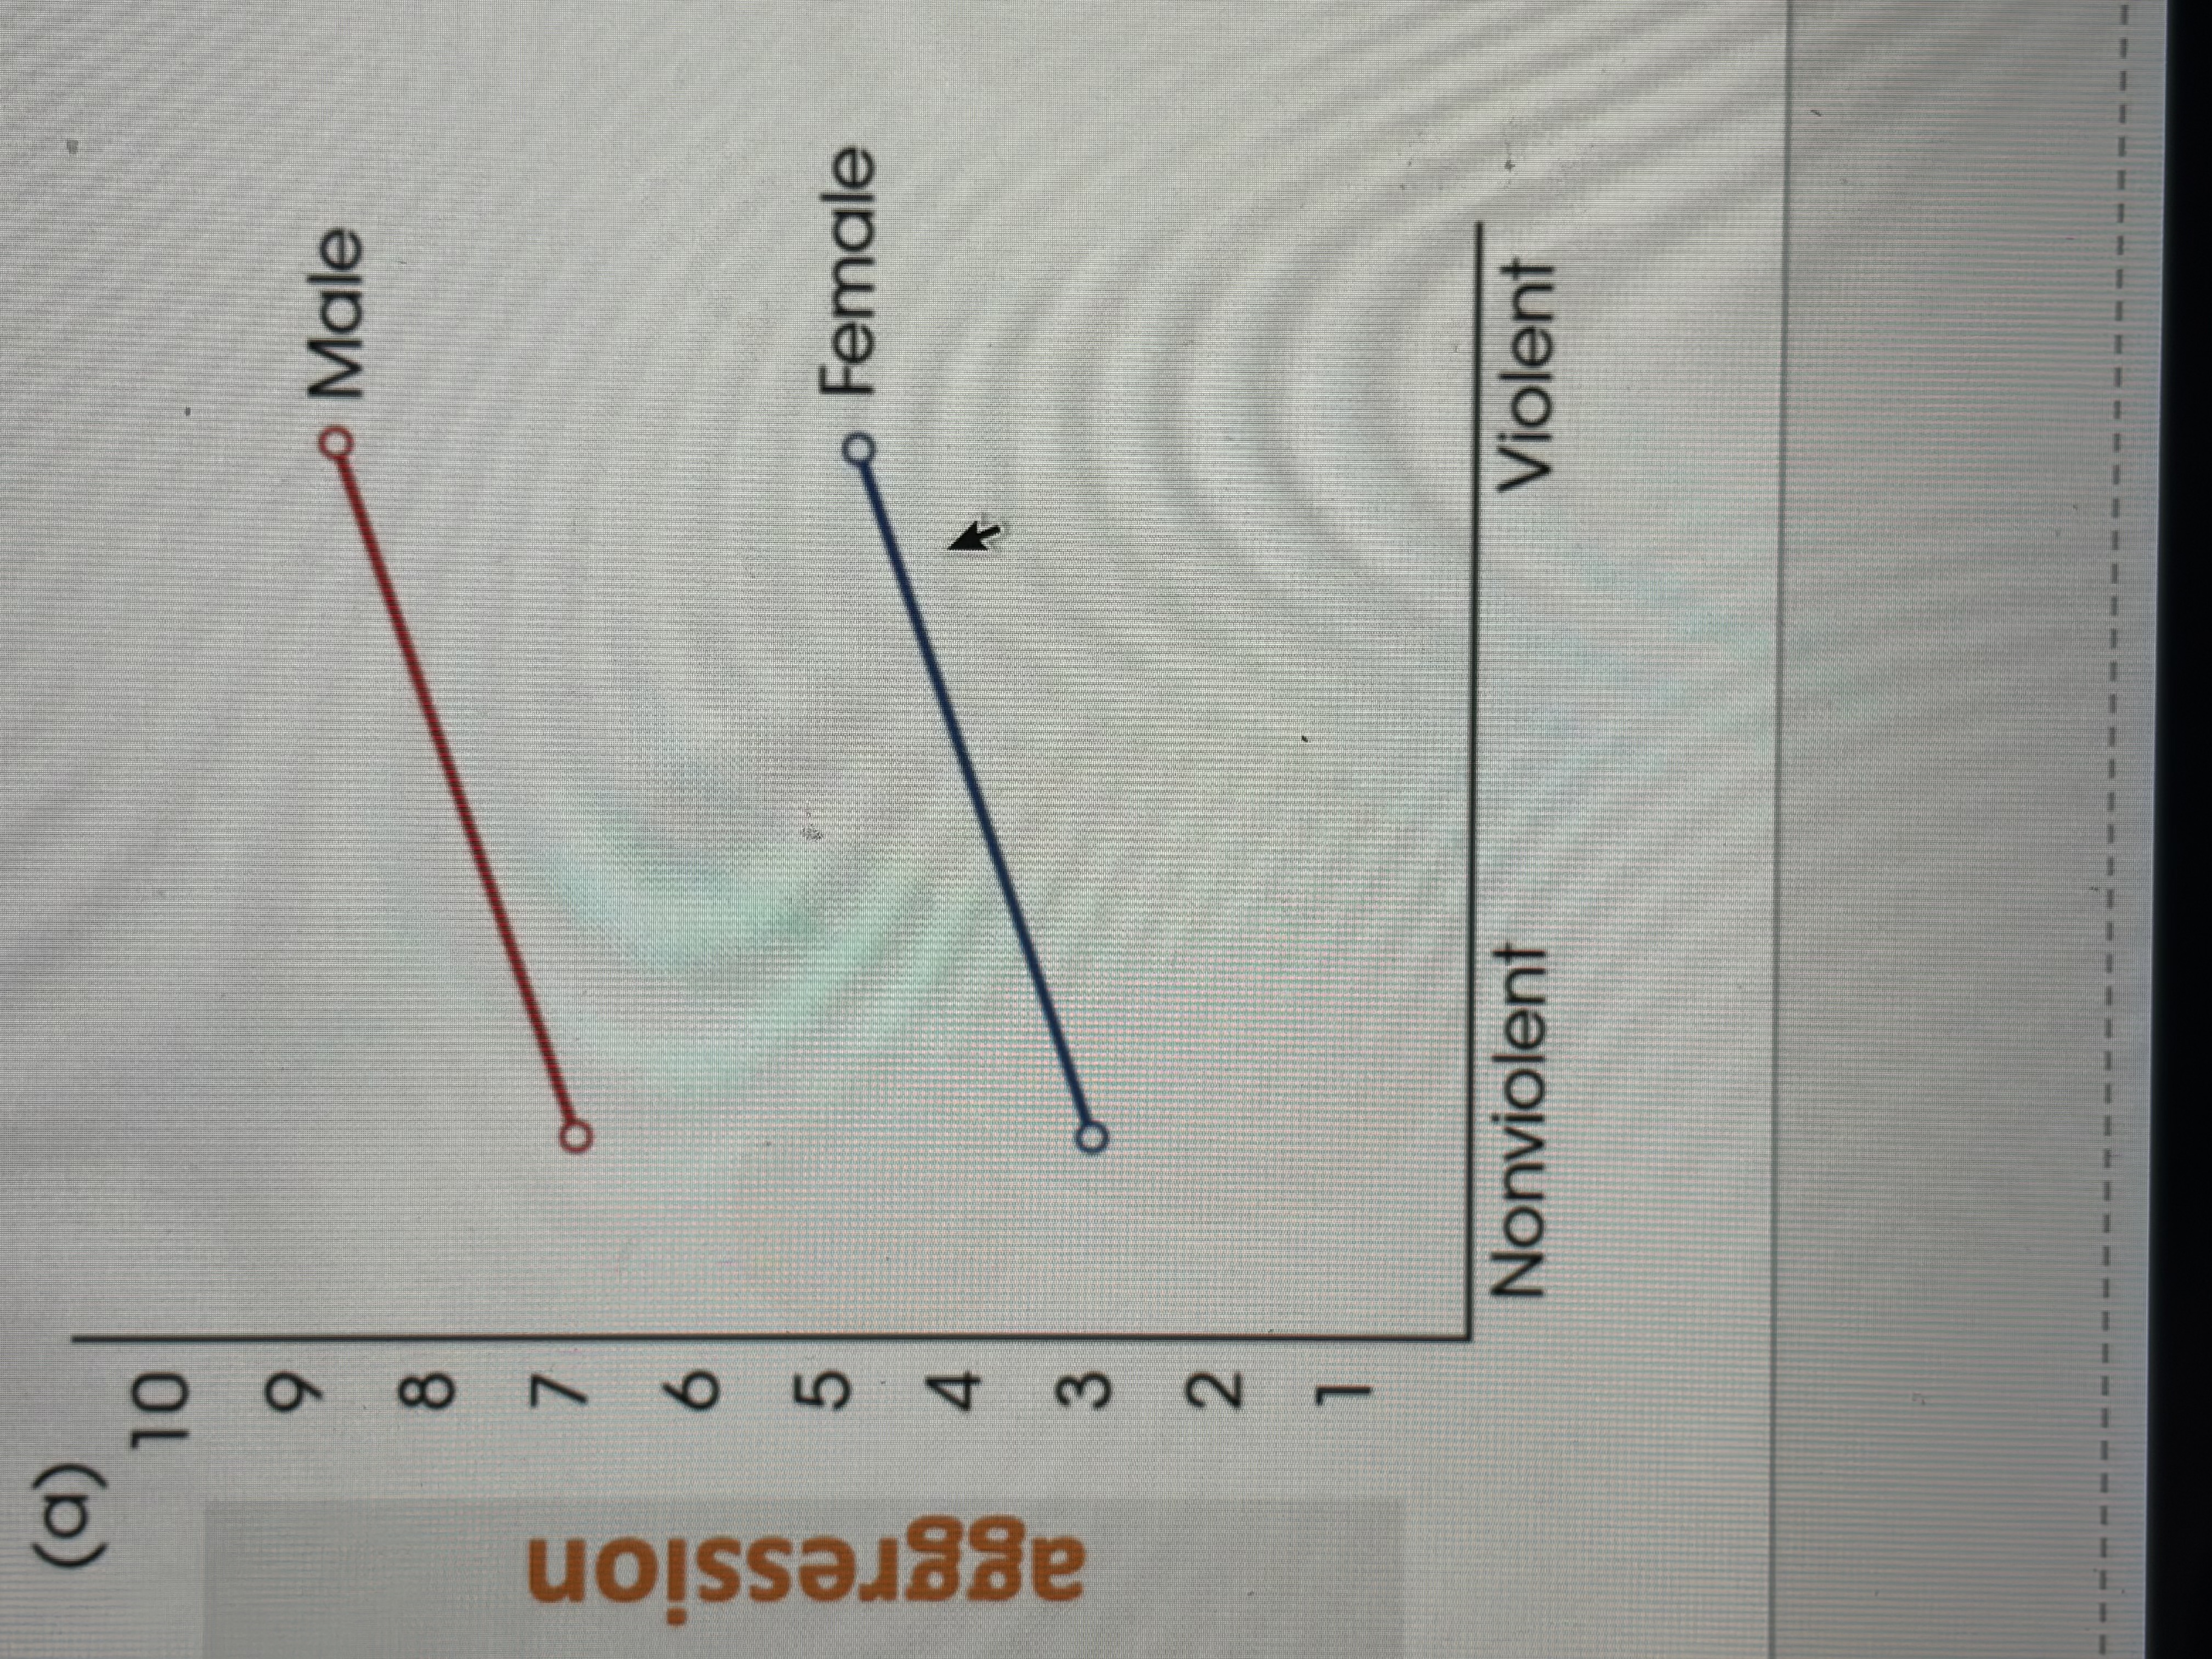
Does aggression different across gender and conditions (violent versus nonviolent video games)? Wht type of design is this
Factorial ANOVA
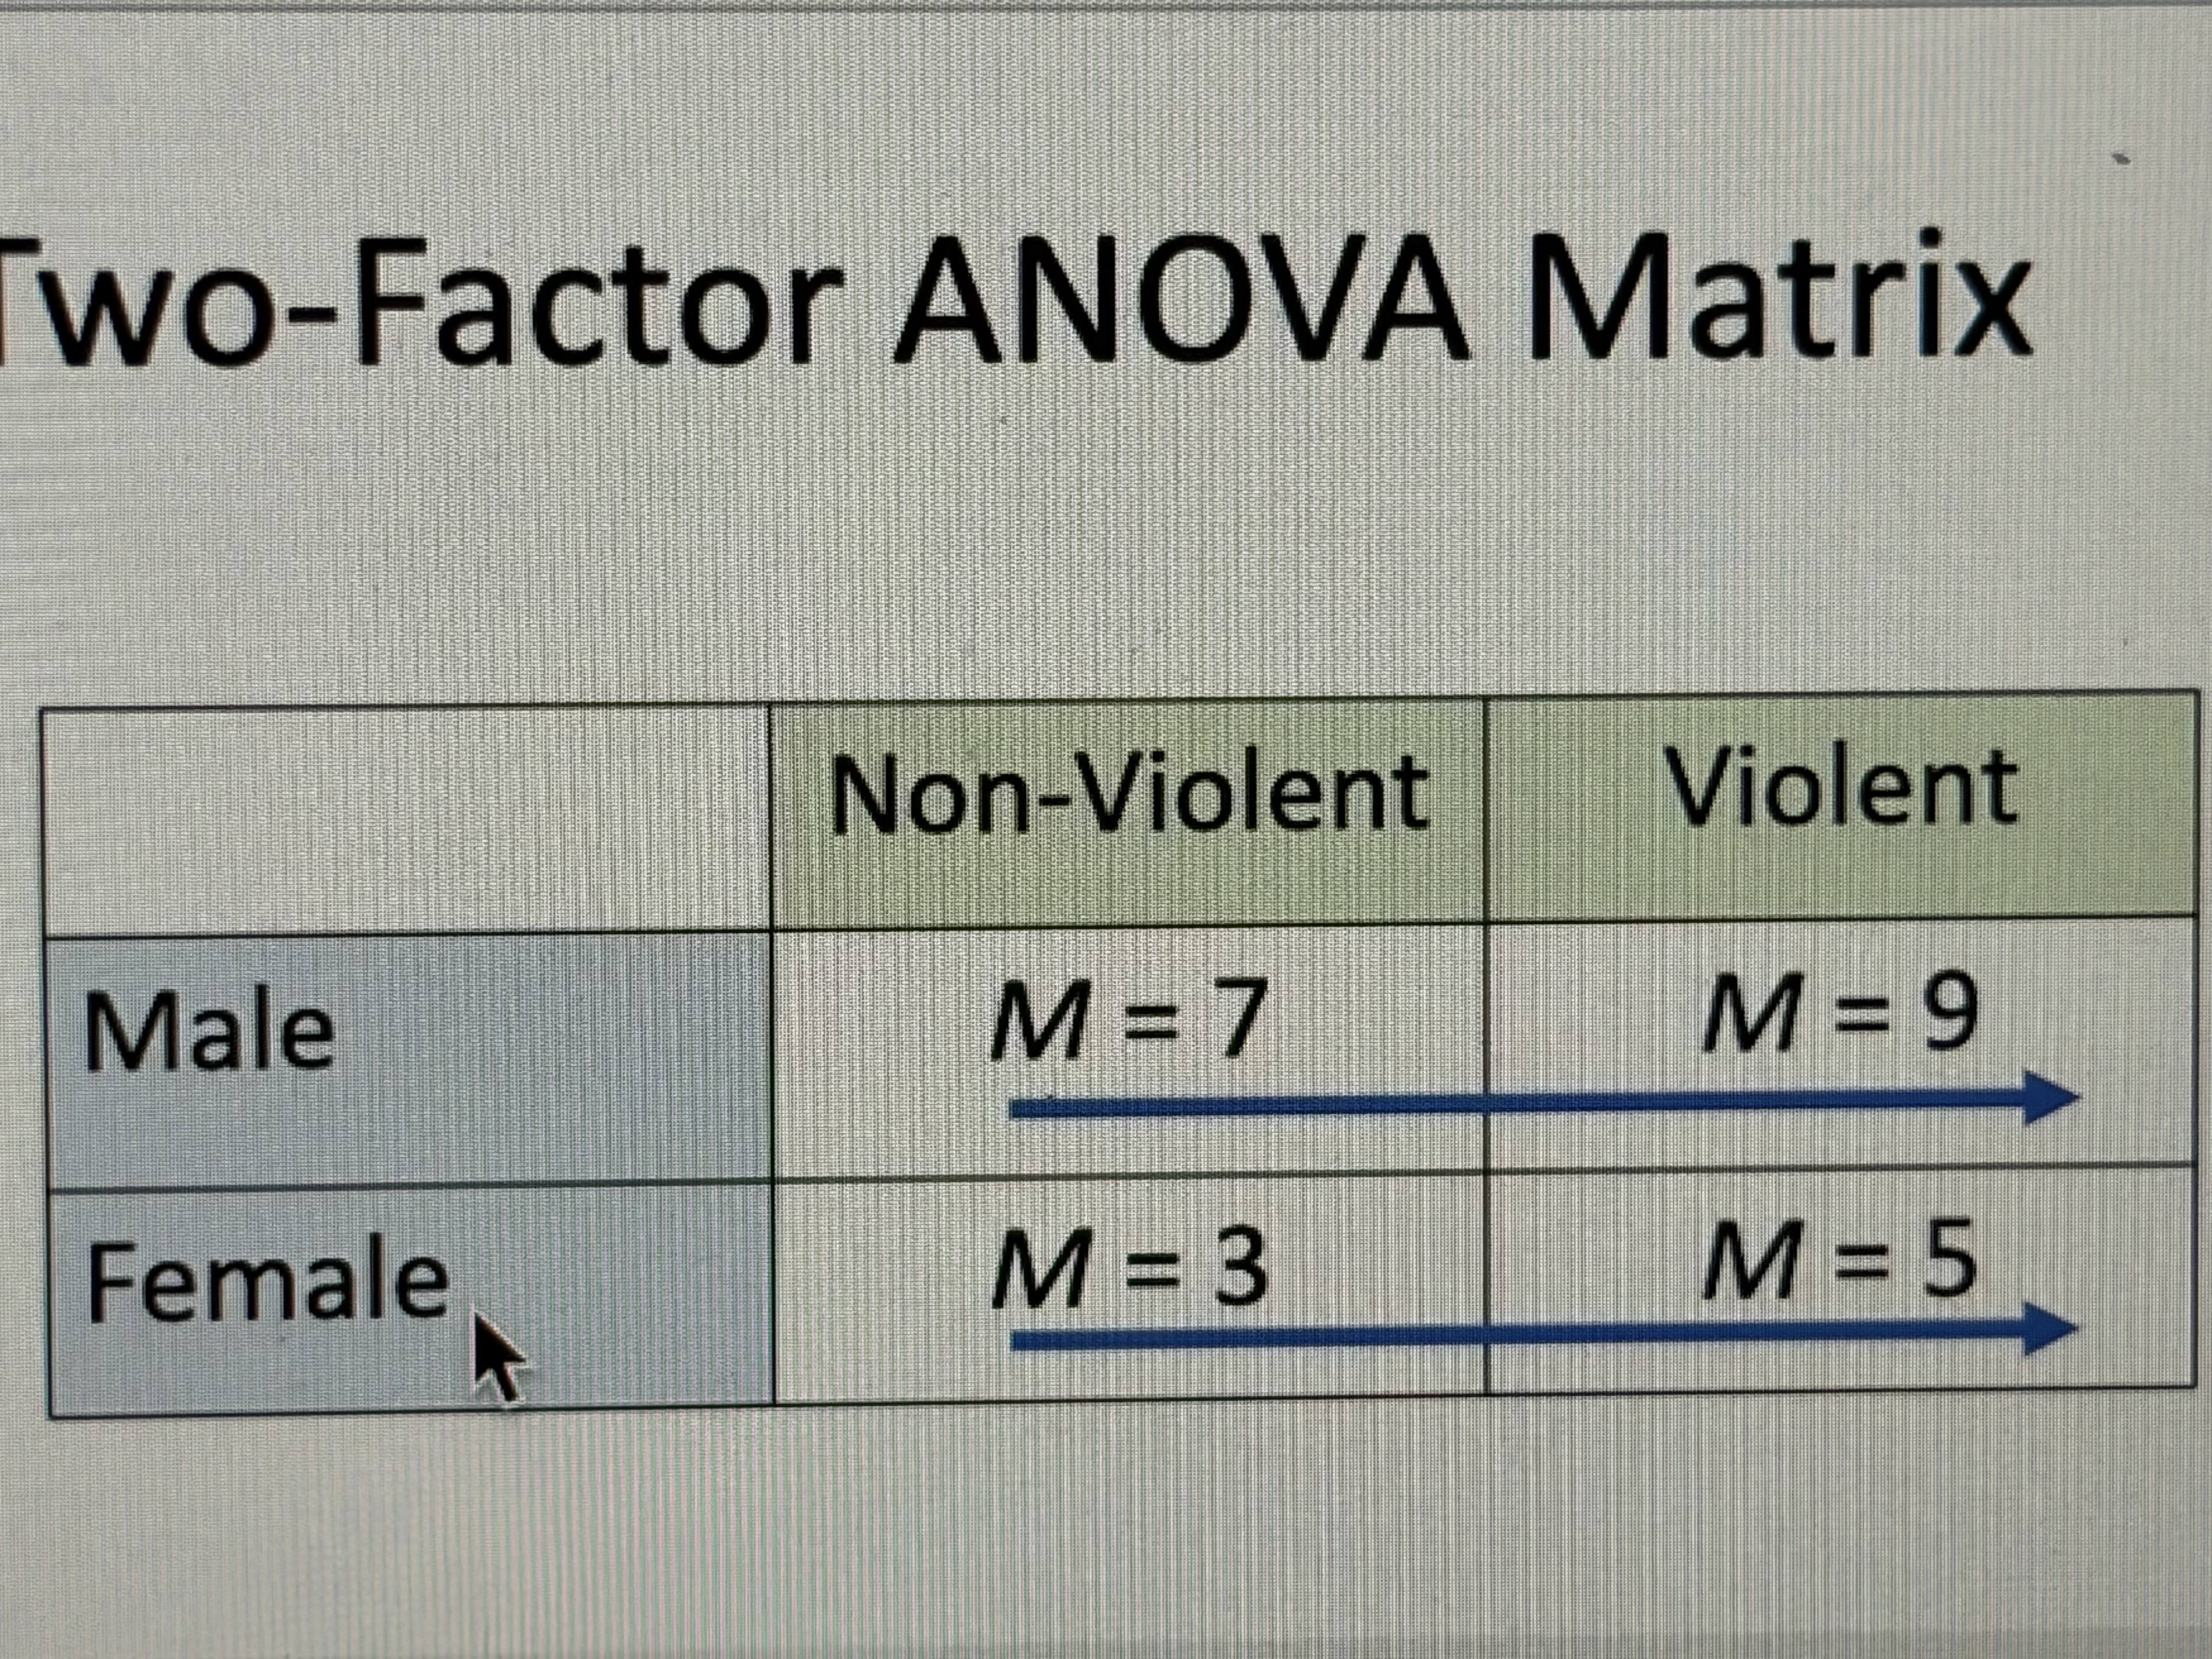
What’s the effect of gender
8, and 4

What’s the effect of the condition
5, and 7
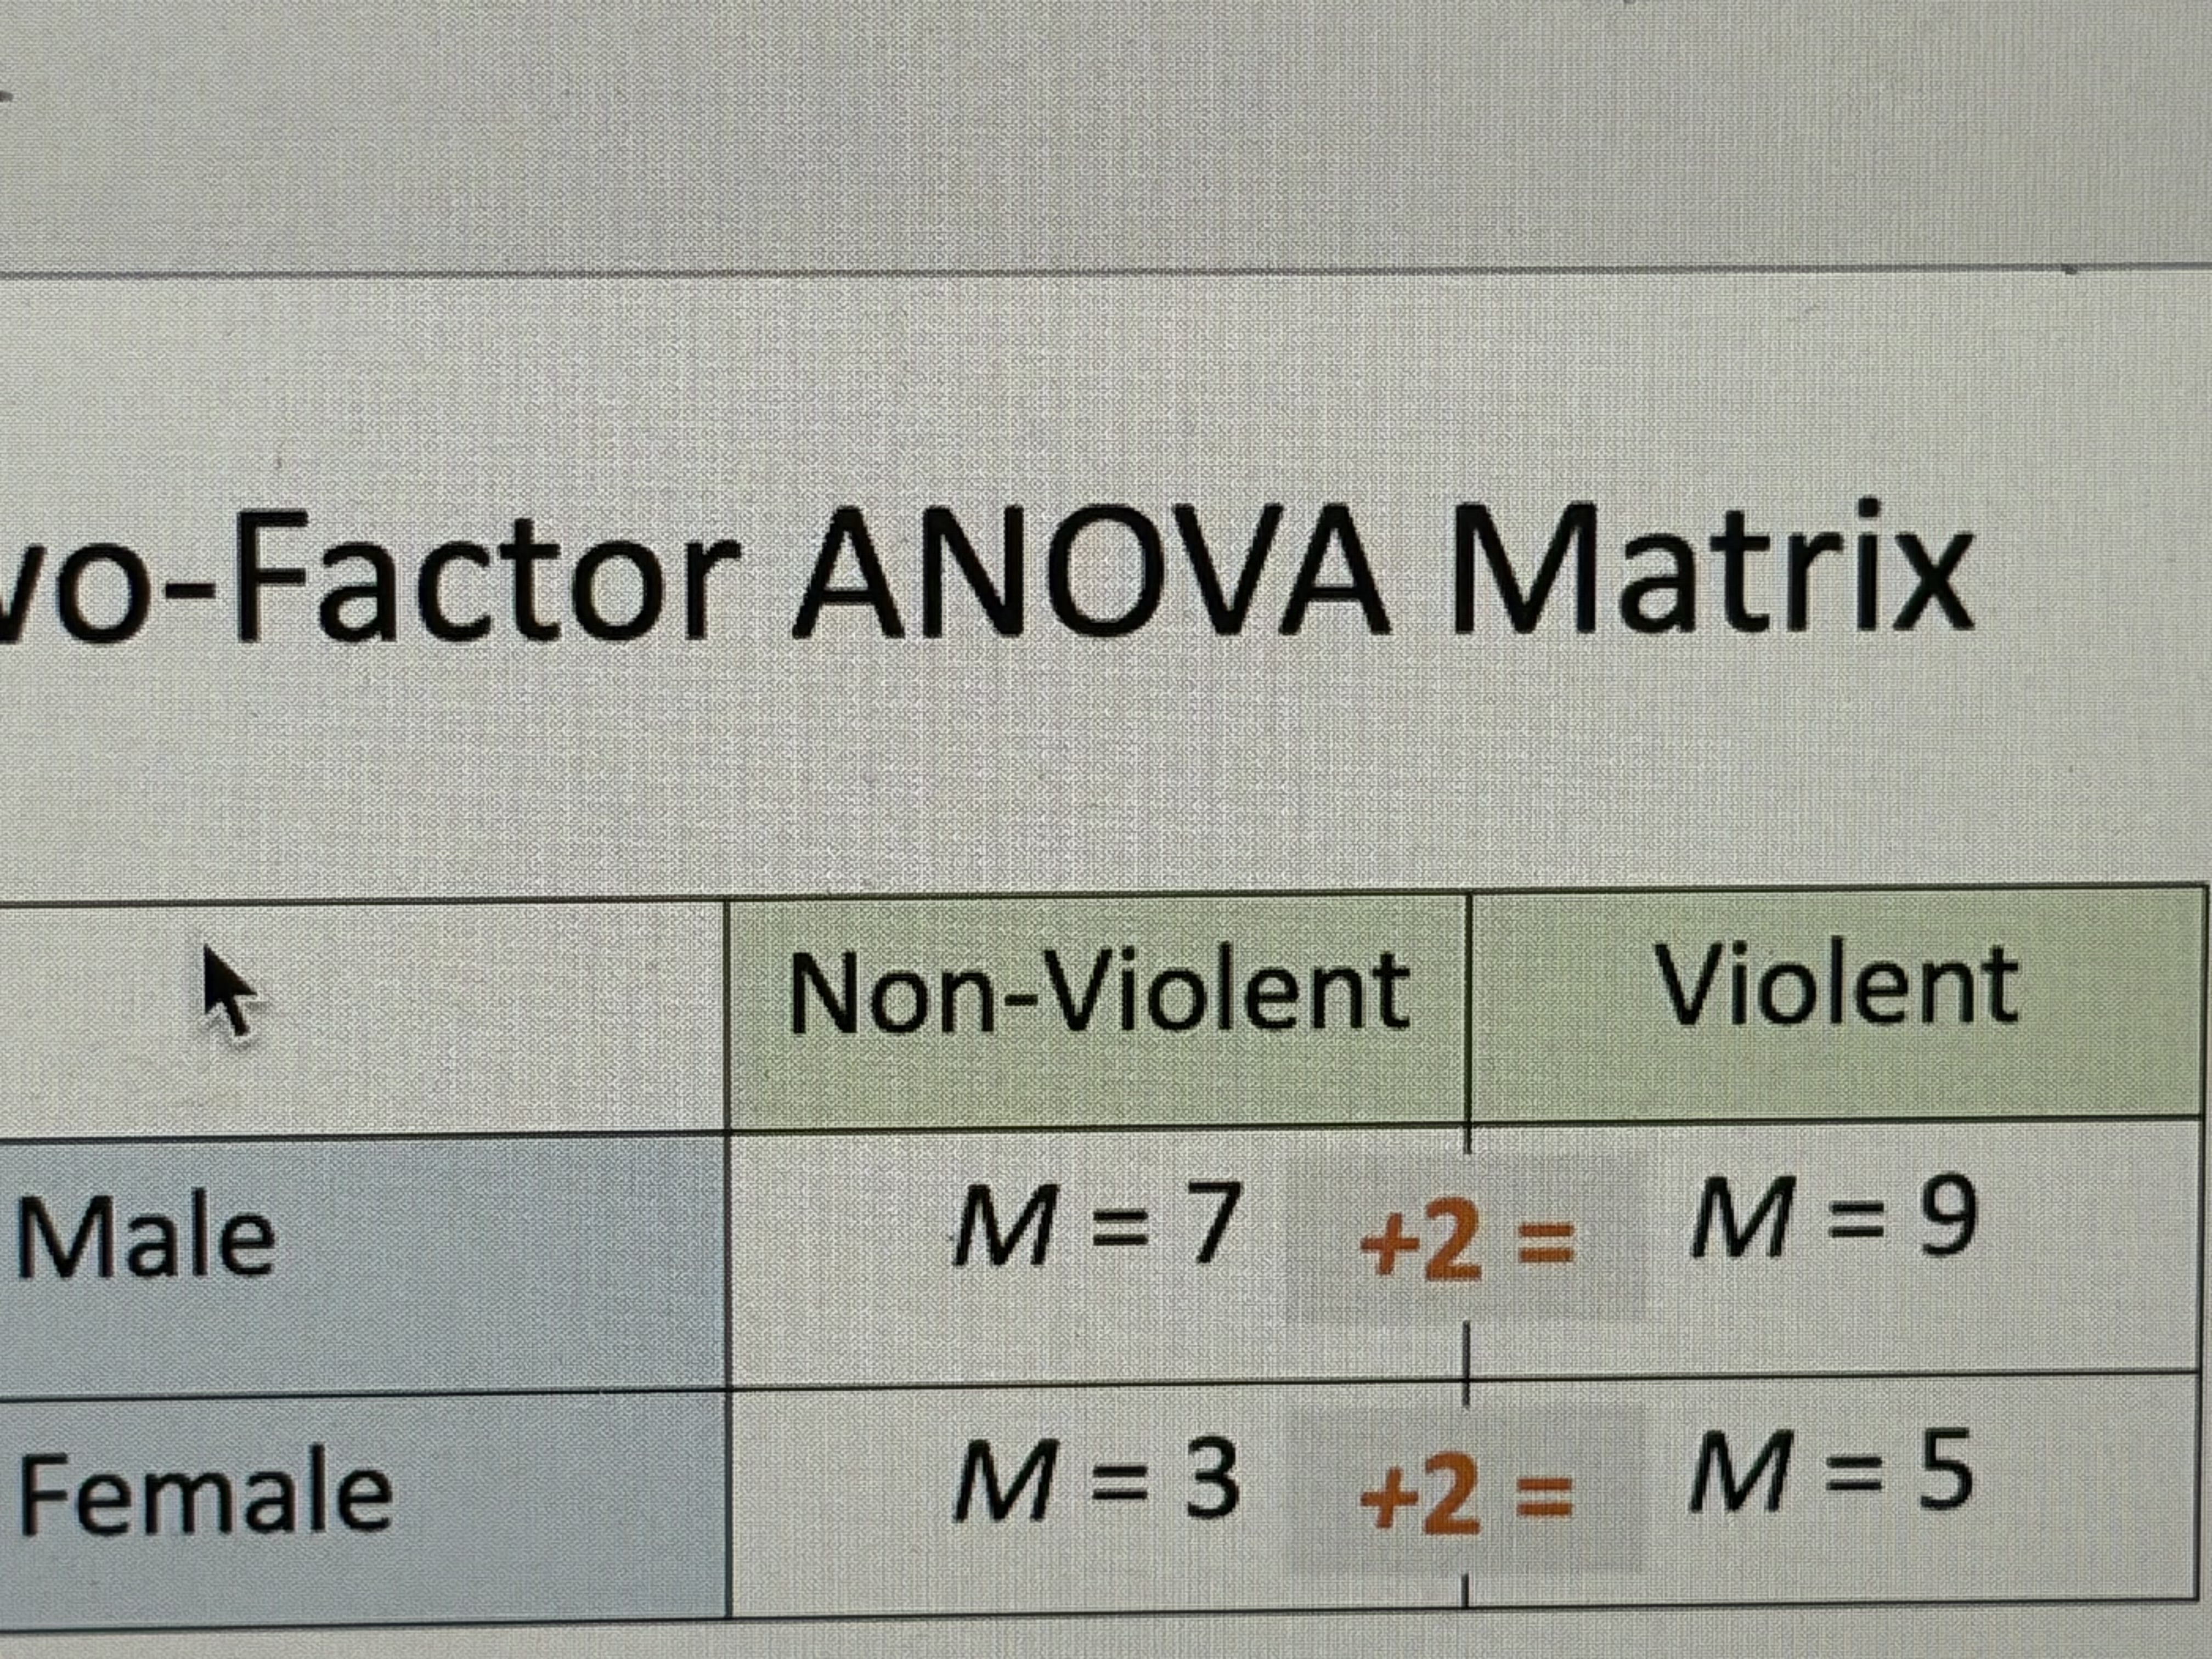
Is there an interaction between a&b
No, because the effective condition was similar for both genders
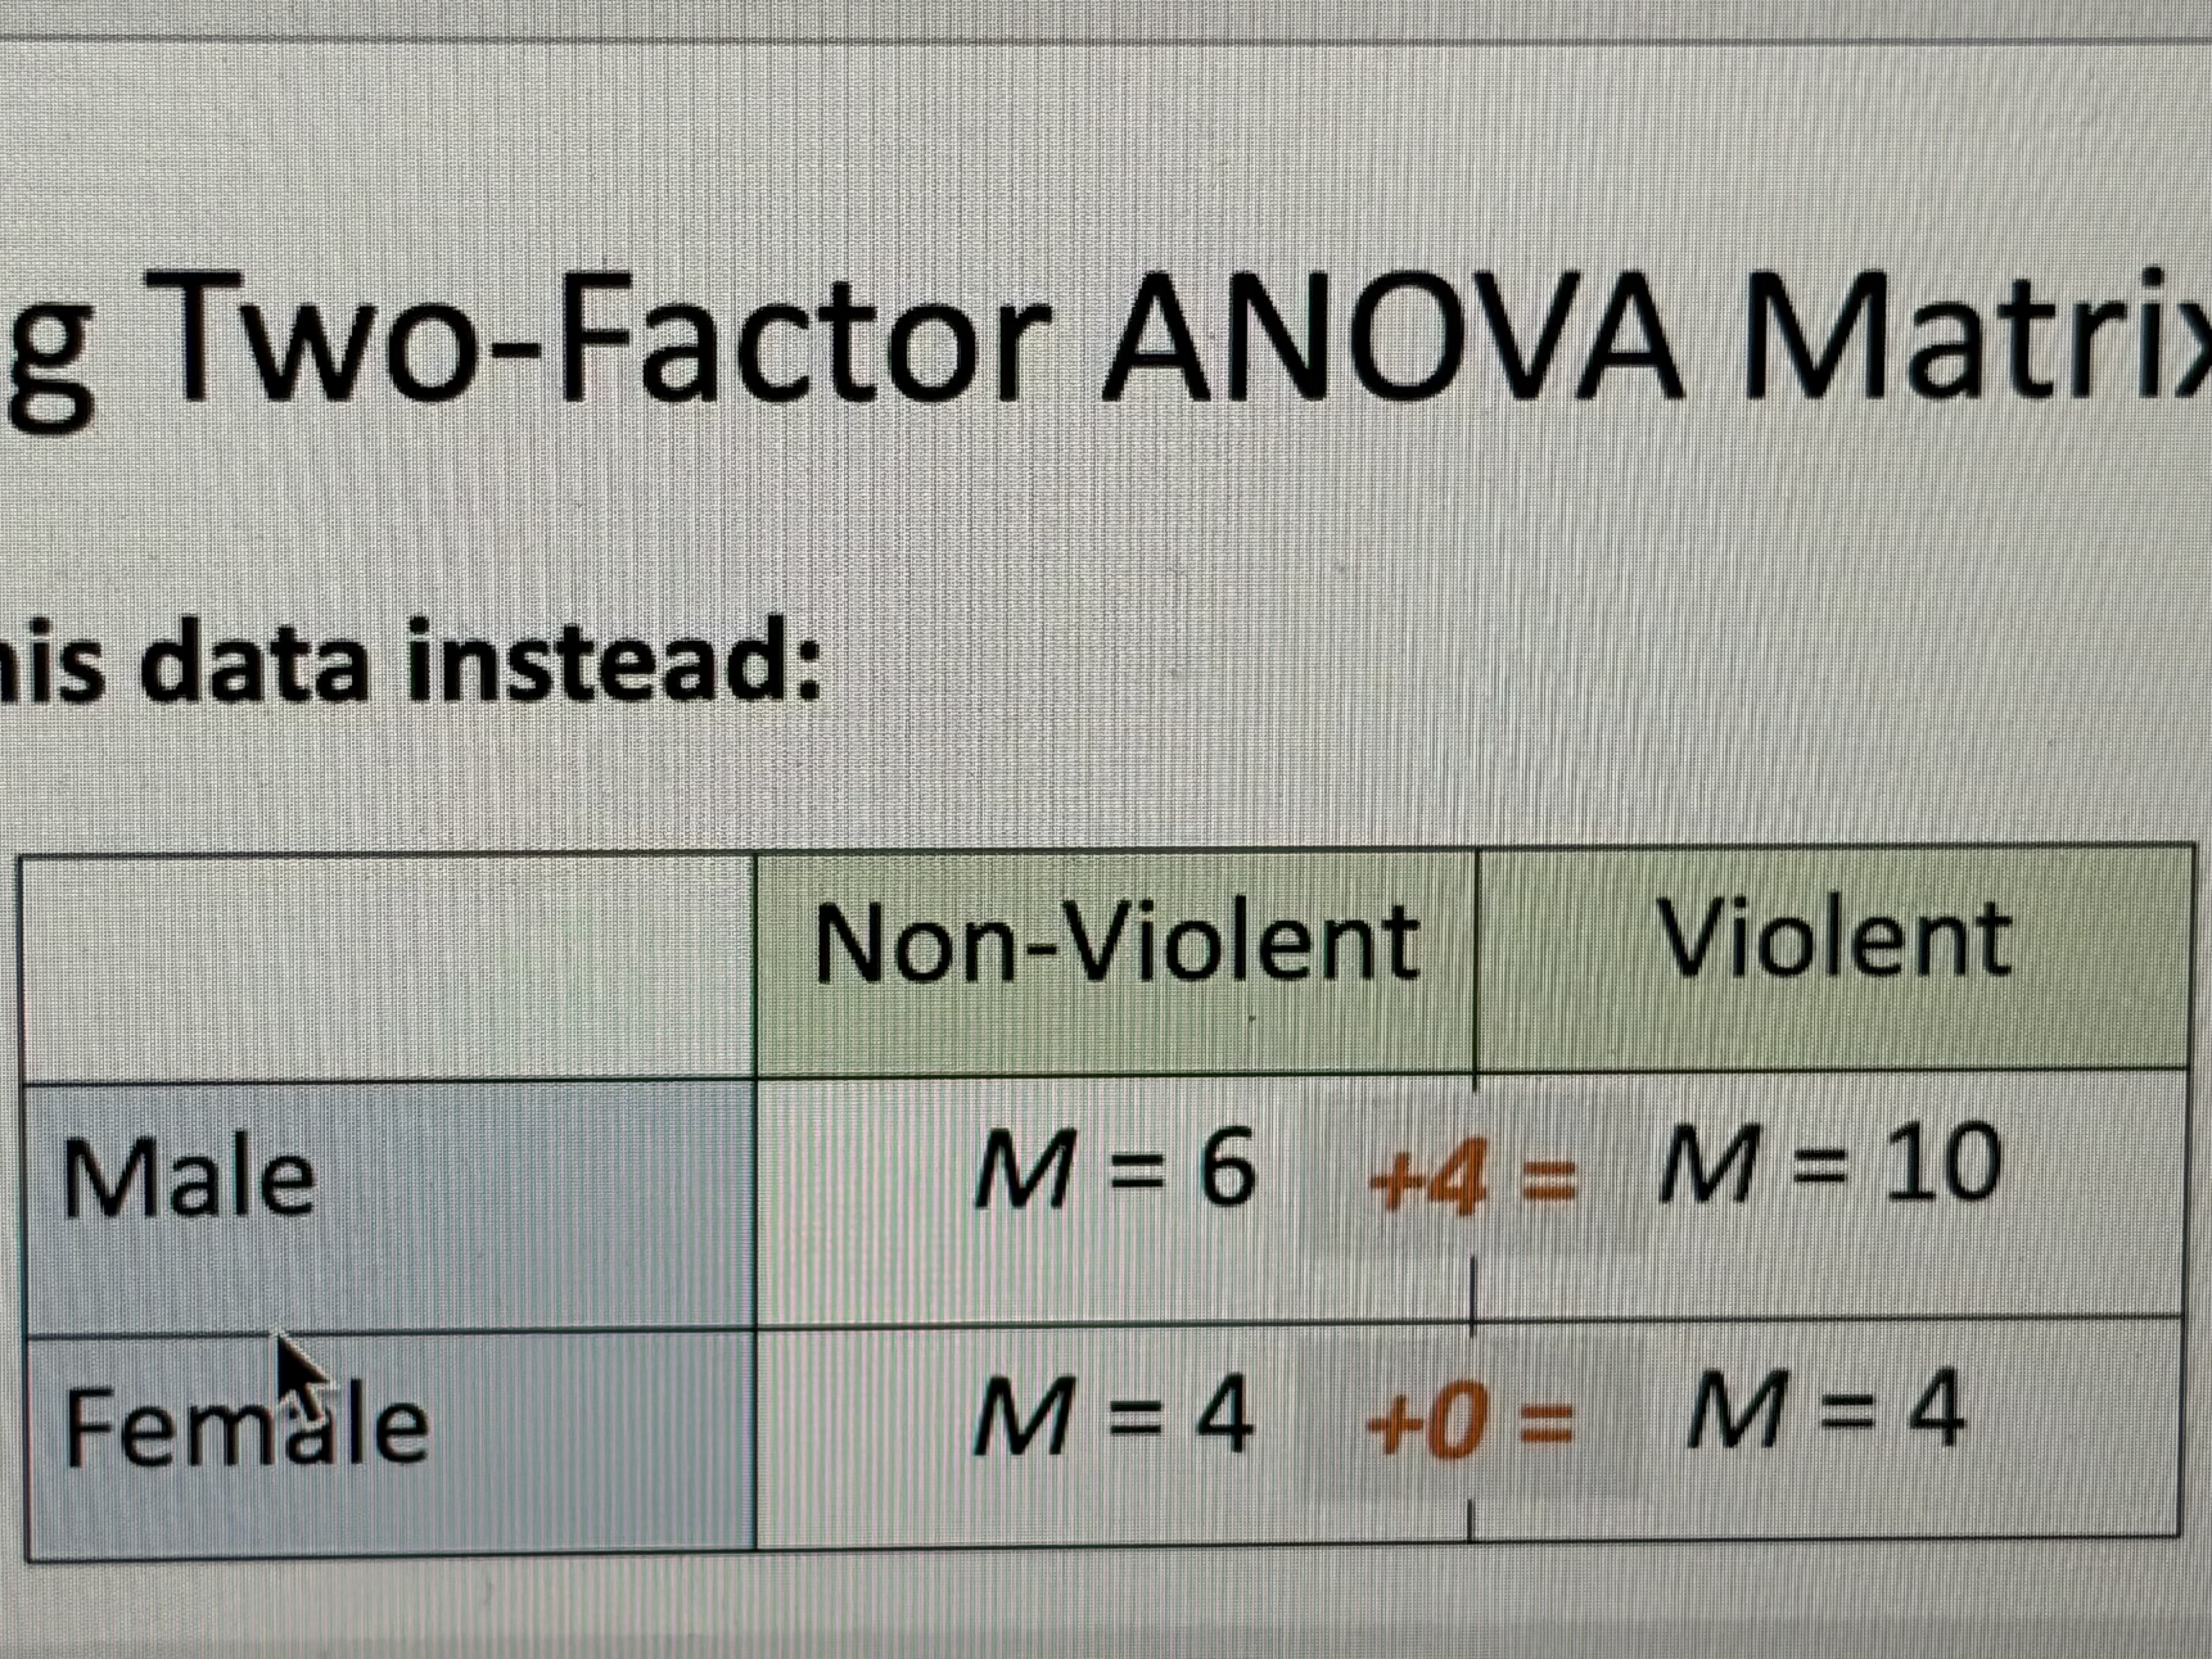
Is there an interaction between a and b
Yes, condition had an impact on males aggression, but didn’t seem to affect females aggression at all
Parallel lines regarding interaction
Indicates no interaction

Different slopes regarding interaction
Indicates an interaction
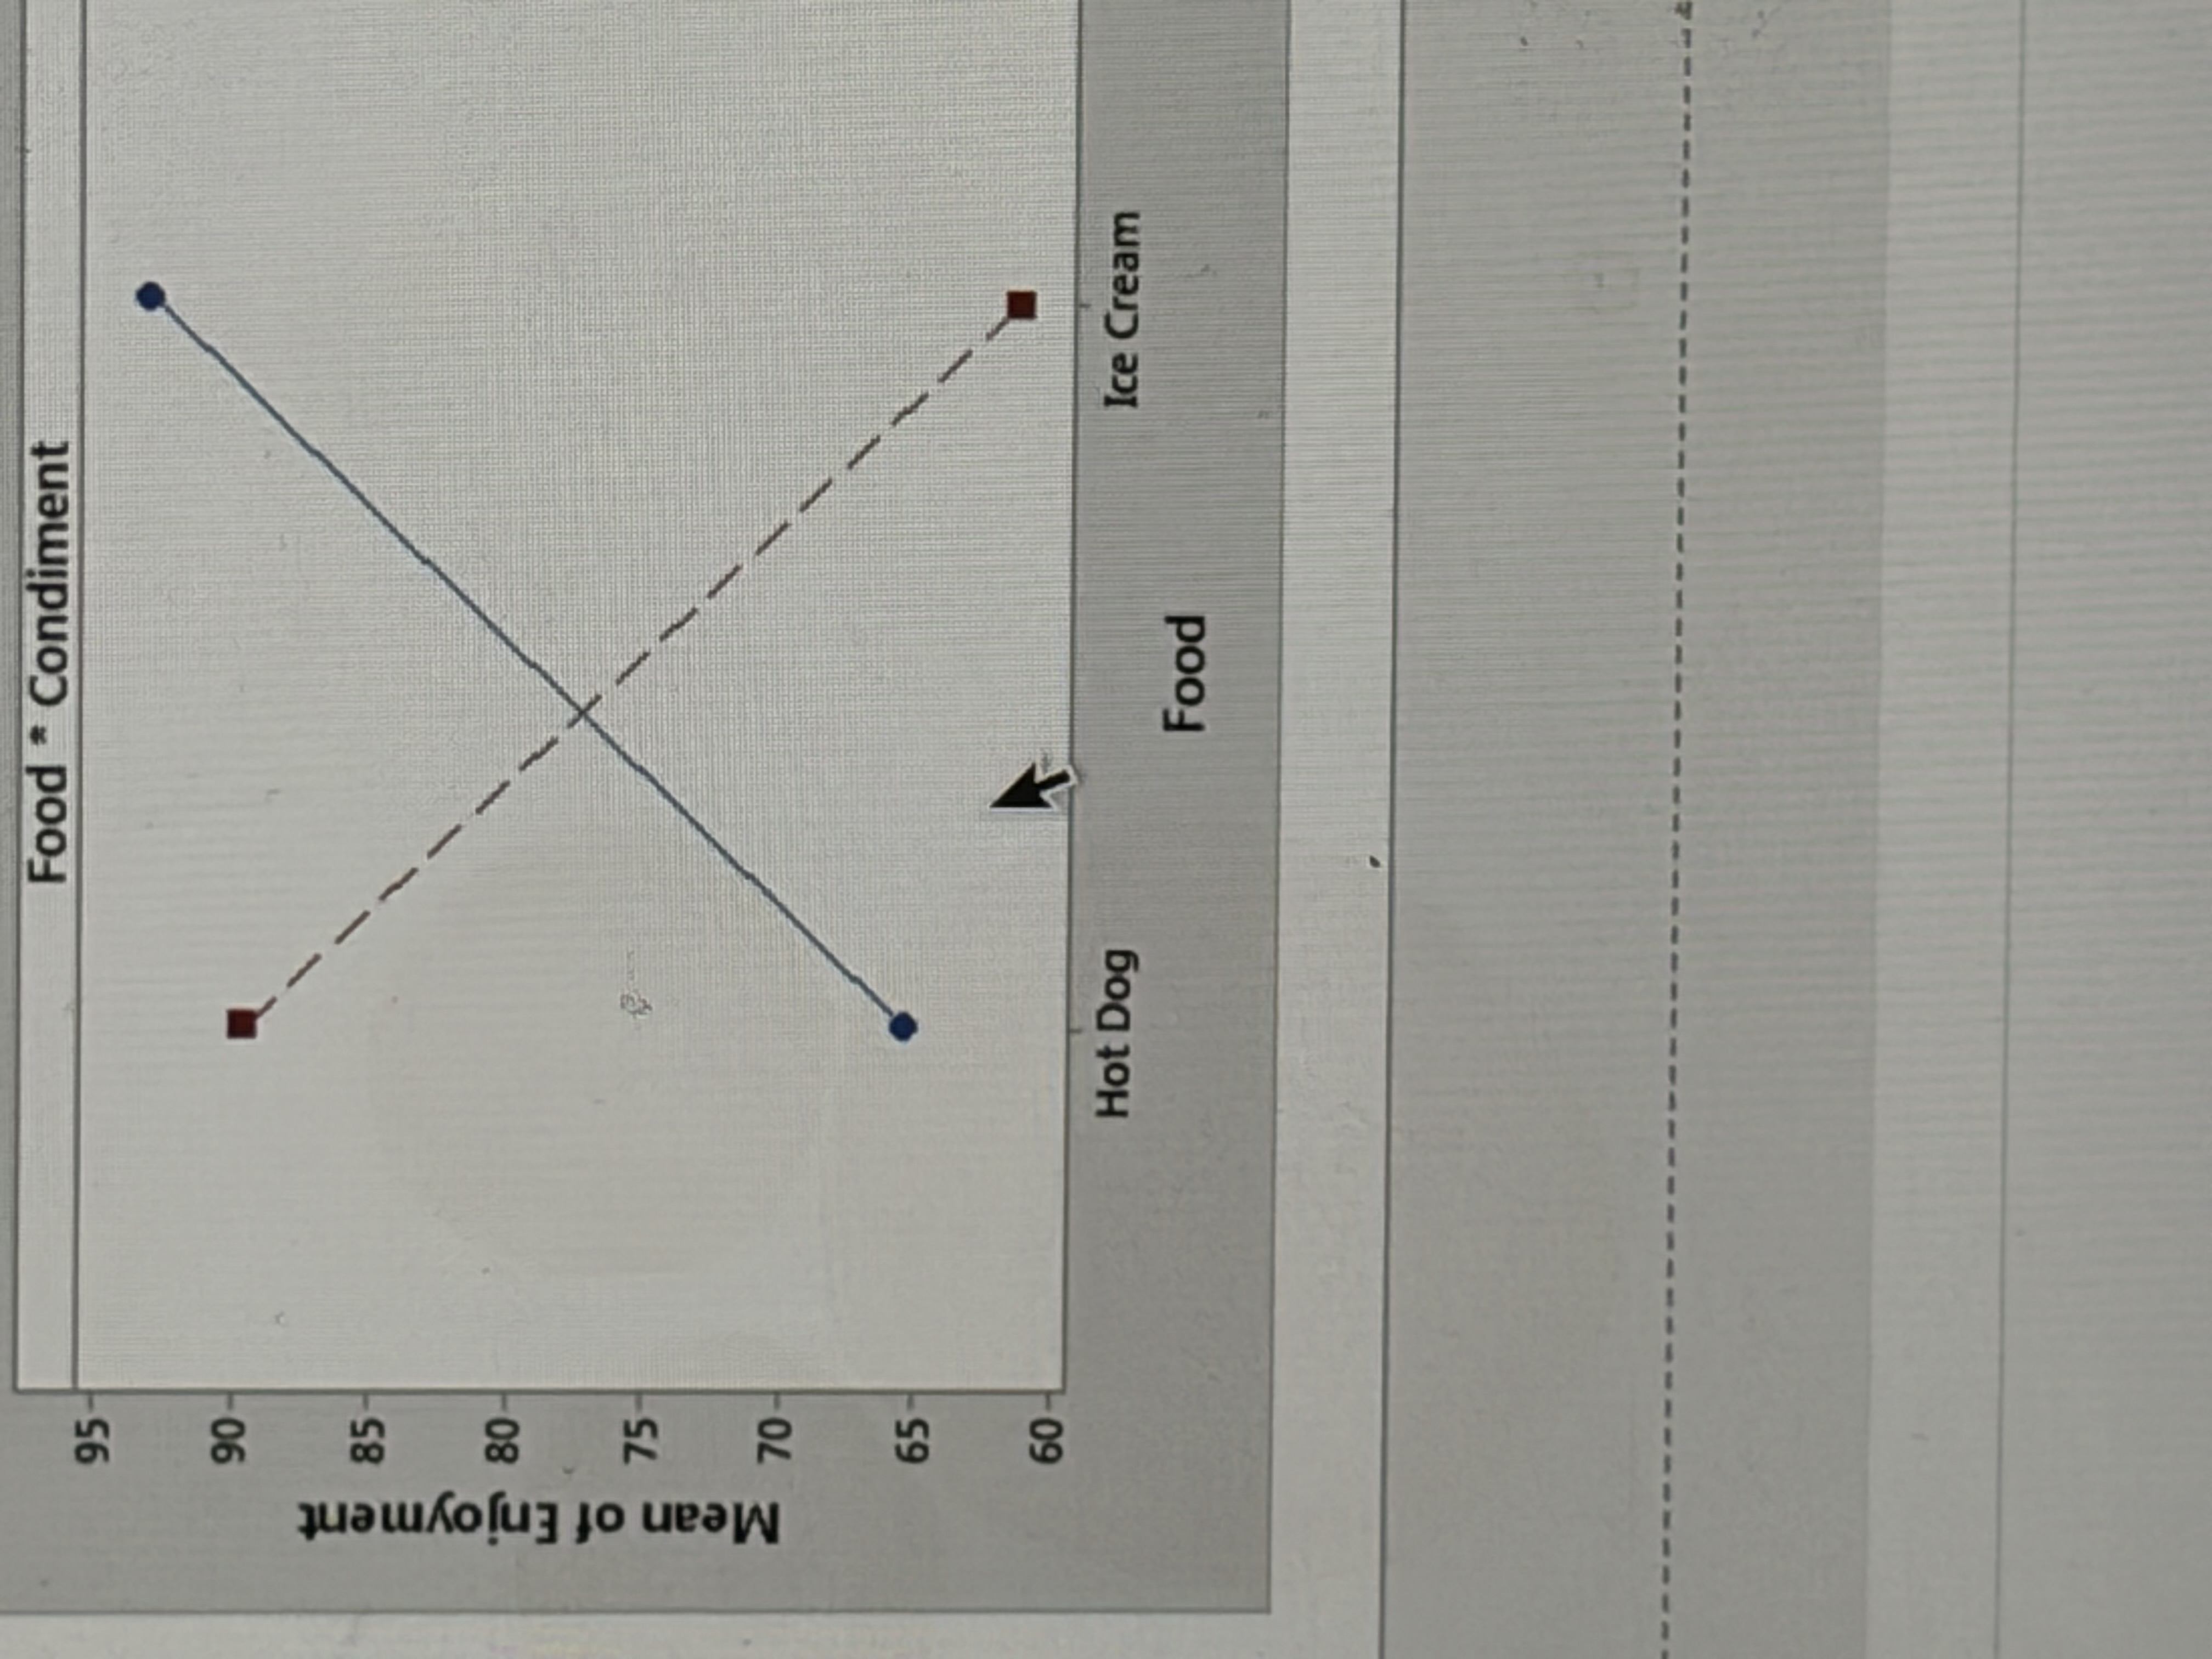
Opposite patterns regarding interaction
Indicates interaction
Can we assume an interaction based off graphs without actual testing?
No
SSa
Variance explained by variable A
SSb
Variance explained by variable B
SSaxb
Variance explained by interaction of A and B