Bio 2 Test #2
1/74
There's no tags or description
Looks like no tags are added yet.
Name | Mastery | Learn | Test | Matching | Spaced |
|---|
No study sessions yet.
75 Terms
Population
A group of individuals of the same species living in the same geographic area at the same time
metapopulations
populations of the same species linked together through dispersal
Population size at time (t)
= N (t-1) + birth + immigration – death – emigration
Closed population
no exchange of individuals with other populations, i.e. assume no immigration/emigration
transect
sampling method - a path along which one counts and records occurrences of the species of study
quadrat
sampling method - a small plot to isolate a standard unit of area for study of the distribution of immobile or slow-moving organisms over a large area.
Crude density
number of individuals per unit space
Ecological density
number of individuals per unit area of habitable habitat
Peterson-Lincoln estimator of population size
N = total pop. estimate
M = Number of individuals captured in first sample and marked
n = number of individuals recaptured in second sample
m = number of marked individuals in second sample
m/n = M/N
N = nM/m
Errors of Peterson-Lincoln estimator of population size
Learn to avoid capture in the second round
same animals may preferentially be re-trapped—especially if a food reward is offered
may be harmed by the marking technique, reducing their survival
The approach also assumes that animals don’t die, get born, leave, or enter the population during the period of the study
cohort
a group of same-aged individuals that grow and survive at similar rates
Life Table equations
Age class: x
number alive: nx
number dying: dx = (nx + (nx+1))
Pop. surviving: lx = nx/n0
mortality rate: qx = dx/nx
Avg # alive in age class: Lx = (nx + (nx+1))/2
Total years lived: Tx = summation Lx
Life expectancy: ex = Tx/nx
fecundity: mx (average # of offspring produced at that age)
reproductive rate: R0 = summation (lx)(mx) + …
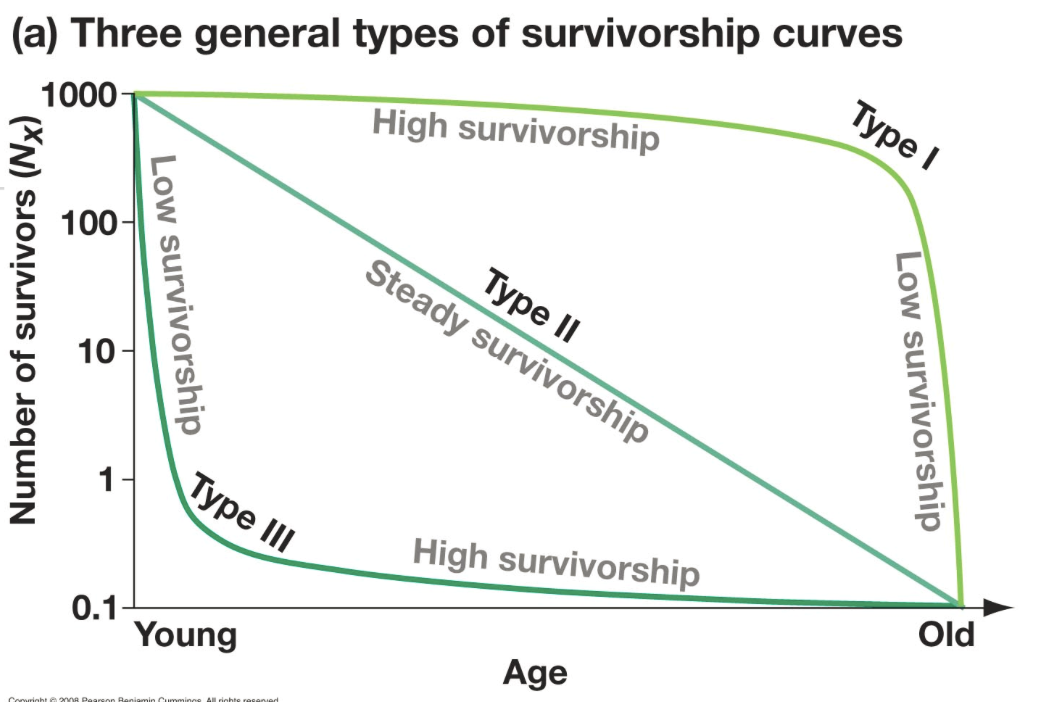
Survivorship Curve
Graph
Population growth rate
r = lnR0/g
g = generation time
Recall R0 =1, the population is stable
Given ln (1) = 0
r = 0 (stable population)
r> 0 population is growing
r< 0 population is shrinking
unit for r = year -1
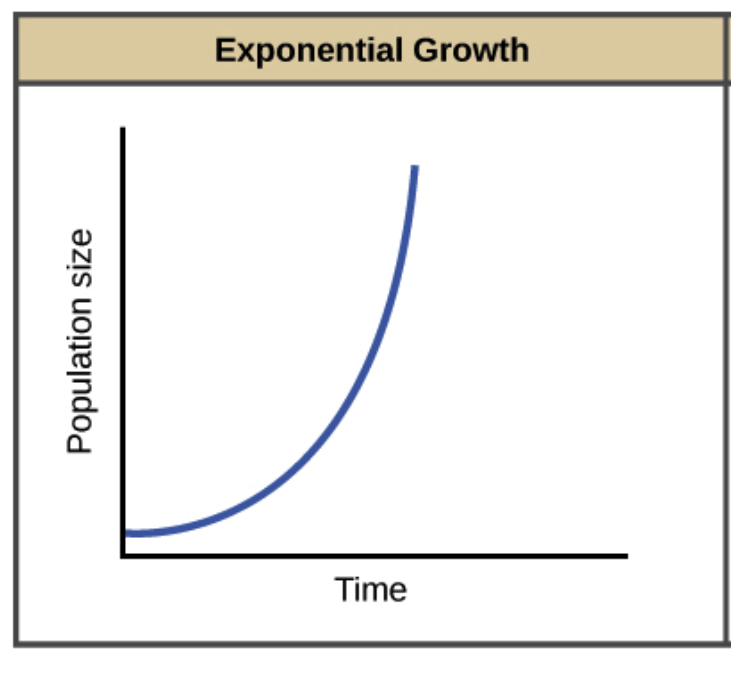
Population growth curve - exponential
dN/dt = rN
resources not limited
instantaneous population growth (dN/dt) increases as the population increases (density independent growth)
r remains constant throughout the process
j shape
Factors that limit population growth
Density independent factors
Often abiotic in nature
Density dependent factors
Often biotic in nature
Carrying capacity (k)
max. pop. size of a biological species that can be sustained by that specific envioronment
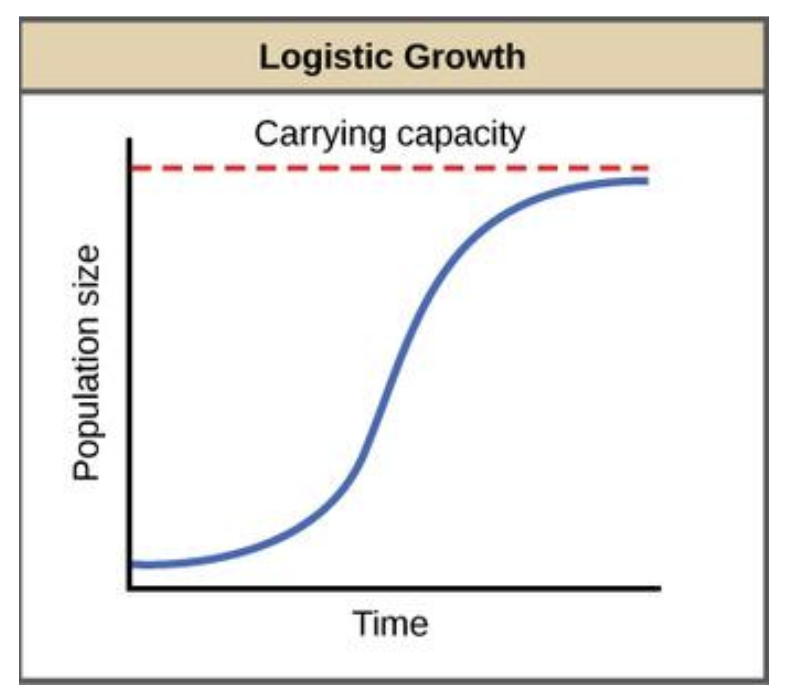
Population growth curves - logistic
resources limited (carrying capacity)
instantaneous population growth (dN/dt) decreases as the population increases (density independent growth)
S shape
dN/dt = rN(1 - N/k)
Life History
lifetime pattern of growth, development and reproduction
Fitness
number of viable offspring that is produced
Three key components of life history
Survival
Reproduction
Maturity
Semelparity
Reproduce only once before dying, e.g. squid and cicadas.
Iteroparity
Reproductive effort spread over more than one episode over its lifetime, e.g. elephants and humans
Community
a group of different species living close enough together for potential interaction
Species interactions
competition
Consumption
Commensalism
Mutualism
Competition
Individuals use the same resources (overlapping niches) – resulting in lower fitness
Species 1 -
Species 2 -
Consumption
One organism eats or absorbs nutrients from another. The consumer’s fitness increases but the victim's decreases
Species 1 +
Species 2 -
Commonsalism
One species benefits but another species is unaffected
Species 1 +
Species 2 0
Mutualism
Fitness benefits conferred to both species involved
Species 1 +
Species 2 +
Niche concept
The range of resources that a species can use and the range of conditions that it can tolerate. More broadly, the role that a species plays in its ecosystem
Realized niche
The portion of the fundamental niche that a species occupies given limiting factors, such as
Constraints with other abiotic or biotic variable
Competition with other species
Types of competitions
Intra-specific : within a species
Inter-specific : between species
Mechanism of competition
Consumptive or exploitation competition: Compete through resource depression or depletion
Interference competition: Compete through direct interactions (chemical or behavorial)
Types of consumptive interactions
Predation
herbivory
Parasitism
Predation
A predator kills and consumes all or most of its prey
Herbivory
plant eater
Parasitism
organism that lives in or on a host taking resources from it
Endoparasite
consumes a relatively small amount of tissue or nutrients from inside the host
Ectoparasite
consumes a relatively small amount of tissue or nutrients from outside the host
Parasitoid
free living as an adult but endo or ecto when larva (young)
Constitutive defense
traits that are present even in the absence of predator
Mimicry
Phenomenon characterized by the superficial resemblance of two or more organisms that are not closely related taxonomically
Inducible defense
Physical, chemical, or behavioral defensive traits that are induced in the prey in response to the presence of a consumer.
Plants are famous for inducible chemical toxics e.g., cyanide, nicotine, caffeine, morphine.
Co-evolution
A repeating cycle of reciprocal adaptation often happens when predator and prey, herbivores and plants, or parasites and hosts interact over time.
Functional response of predator
Type I : Linear increase in consumption rate until satiation, then no change in consumption rate above satiation.
Type II: Consumption rate increases at a decelerating rate, gradually leveling off at maximum rate.
Common
Type III: Sigmoid increase in consumption rate as prey density increases.
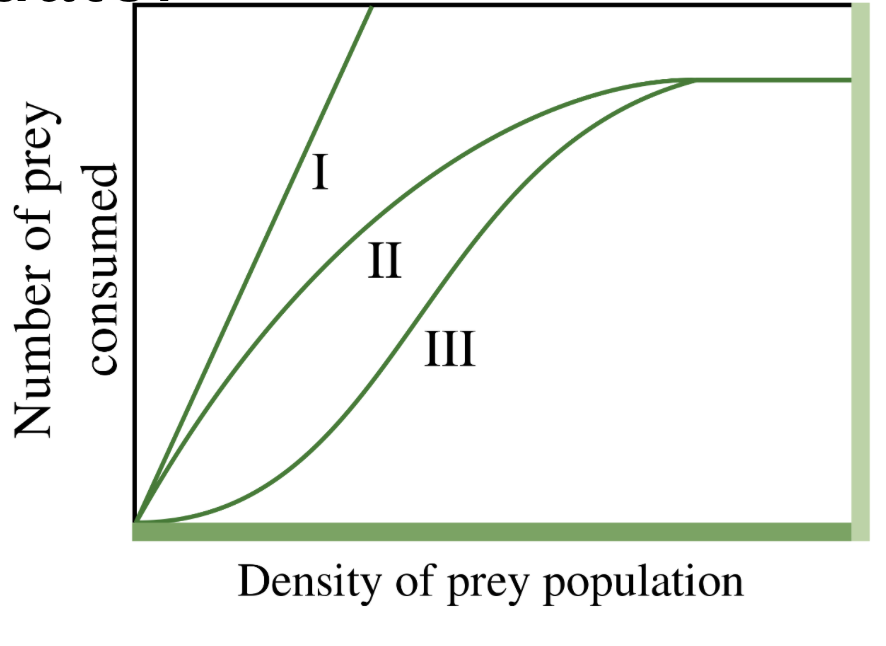
Mechanisms behind type III functional responses
Prey switching
Learning
Limitation of prey refuge
Trophic cascade
Predators can shape their community through indirect interactions.
Presence of predators can affect herbivores, which in turn indirectly affects primary producers.
The indirect interactions can either be density-mediated (i.e. primary consumer got eaten) or trait-mediated (i.e. primary consumer goes into hiding).
“Keystone species”
A species which has a disproportionately large effect on its natural environment relative to its abundance.
Lay science description is MISLEADING
Keystone is CONTEXT-dependent.
The 10% rule
Energy transfer between trophic levels is inefficient. Only about 10% of the net productivity of one level ends up as net productivity at the next level.
Why?
Partial consumption: not all the organisms at a lower trophic level get eaten by those at a higher trophic level.
Incomplete digestion and assimilation: Some parts of the lower trophic level do get eaten but are not digestible by predators and are lost in the predators' feces.
The dead bodies and feces are remineralized by decomposers.
Energy is loss in the process of cellular respiration, as heat
Homeostasis
The array of relatively stable chemical and physical conditions in an organism’s cells, tissues, and organs.
conformational homeostasis
achieved by passively matching the conditions of a stable external environment
regulatory homeostasis
active physiological processes triggered by variations in external of internal environment
Why keep conditions within a tolerate range?
Homeostasis
Structure and function of enzymes is influenced by temperature, pH, and other physical and chemical conditions
Extreme high temperatures can denature proteins
Temperature affects membrane permeability
Thermal expansion of water at extreme cold can rip cells and damage tissues
Temperature affects diffusivity (how fast solute diffuse in a medium)
Negative feedback
restoring feedback
feedback serves to reduce an excessive response and keep a variable within the normal range.
Positive feedback
reinforcing feedback
feedback serves to intensify a response
Heat exchange with the environment
Radiation
Convection
Conduction
Evaporation
Bergmann’s rule
Within a broadly distributed taxonomic clade, populations and species of larger size are found in colder environments, while populations and species of smaller size are found in warmer regions
Rationale is that larger body size reduce radiative heat loss
Allen’s rule
Animals adapted to cold climates have shorter limbs and bodily appendages than animals adapted to warm climates
Once again to reduce surface area to volume ratio to limit heat loss.
Thermoregulation in ectotherms
Behavioral means are often used to regulate body temperature
Exploiting microclimates
Seeking shade to cool down
Locating sunny place to warm up
Raising the body from the ground to decrease conductance
Underground burrows
Temperature and performance in endotherm
Thermal neutral zone refers to the range of temperature which endotherm does not need to alter metabolic rate to maintain constant body temperature (Tb)
Countercurrent heat exchange
Given water has a high specific heat capacity, it is a good conductor
Aquatic animals often have special adaptation to reduce heat loss
Heterothermy
Hummingbirds reduce their activities at night, bats during the day, such that endothermic organisms become poikilothermic.
Mammal hibernation is an example of homeothermic animals that undergo controlled hypothermia
Electrolyte
Solutes that dissociates into ions in water (NaCl 🡪 Na+ + Cl-)
Osmolarity
osmotic concentration
Osmoregulation is important for
Maintaining Protein conformation and function is affected by the presents of ions
Maintaining cell volume
Maintaining electron gradient inside and outside a cell
Difusion
solute molecules move from high to low concentration
Osmosis
Solvent molecules move from low concentration to high concentration
the net diffusion of water molecules that is caused by a difference in osmolarity between the two compartments
Net diffusion
when the flow of solute particle moving in one direction is bigger than the flow of solute particles moving in the opposite direction
Osmotic potential
Water moves from a region where its potential energy is greater to a region where its potential energy is lower
Regardless of the reason for the water potential energy difference
Water will move until the same water potential energy is reached in all regions.
The differences in potential energy of water between two regions can be caused by several factors
Differences in entropy, osmolarity, pressure, temperature, etc.....
Osmoconformers
remain isosmotic with their surroundings and do not regulate their osmolarity
Osmoregulators
expend energy to control water uptake and loss in a hyperosmotic or hyposmotic environment
Fick’s Law of Diffusion
Q = D A ((P1-P2)/L)
D is the diffusion coefficient (dependent on the diffusing substance, the medium, the temperature)
A: area across which the gas is diffusing
L is the distance between the two locations
(P1-P2)/L partial pressure gradient
Partial pressure is the pressure of that constituent gas if it alone occupied the entire volume of the original mixture at the same temperature.
Obtaining oxygen for aerobic respiration through diffusion
Pro:
Does not require additional energy
Con:
There is a size limit (as L ↑, Q ↓)
Henry’s Law
Cg = k * Pa
Cg is the concentration of dissolved gas (mol l-1)
K is the solubility constant (temperature, salinity, and gas dependent)
Pa is the partial pressure of the gas in the overhead space
Ideal gas law
PV = nRT
P is the pressure (atm)
V is the volume of the gas (L)
n is the number of gas particle (mol)
R is the ideal gas constant (0.0821 atm•L/mol•K)
T is temperature in Kelvin (K)