W16: short run buisness cycles ...agreggate demand &supply; debates over government’s role in managing the cycle
1/30
Earn XP
Description and Tags
NEED TO LOOK AT GRAPHS ->
Name | Mastery | Learn | Test | Matching | Spaced | Call with Kai |
|---|
No analytics yet
Send a link to your students to track their progress
31 Terms
Business cycle
the irregular and largely unpredictable fluctuations in economic activity, as measured by the production of goods and services or the number of people employed
Recession
period of declining real incomes and rising unemployment.( depression is severe recession
Non stationary data -
time series data where the mean value can either rise or fall over time ( in the picture GDP regularly rises )
Stationary data
time-series data that has a constant mean value over time
buissness cycle 2 ?
Most macroeconomic quantities fluctuate together (procyclical) Real GDP falls in a recession ;GDP falls ⇨ Unemployment rises (countercyclical)
Cyclical indicators
leading indicators change before the change in the GDP trend. They can be used to foretell future changes in economic activity
Lagging indicators change after
changes in economic activity have occurred
coincident indicators change at
the same time as changes in economic activity
In the long run the increase in productivity
determines the increase in real GDP
why does economy fluctuate in short run:
money supply matters - real GDP may deviate bc of this
Aggregate-demand curve
curve that shows the quantity of goods and services that households, firms, the government and customers abroad want to buy at each price level
Aggregate-supply curve
a curve that shows the quantity of goods and services that firms choose to produce and sell at each price level
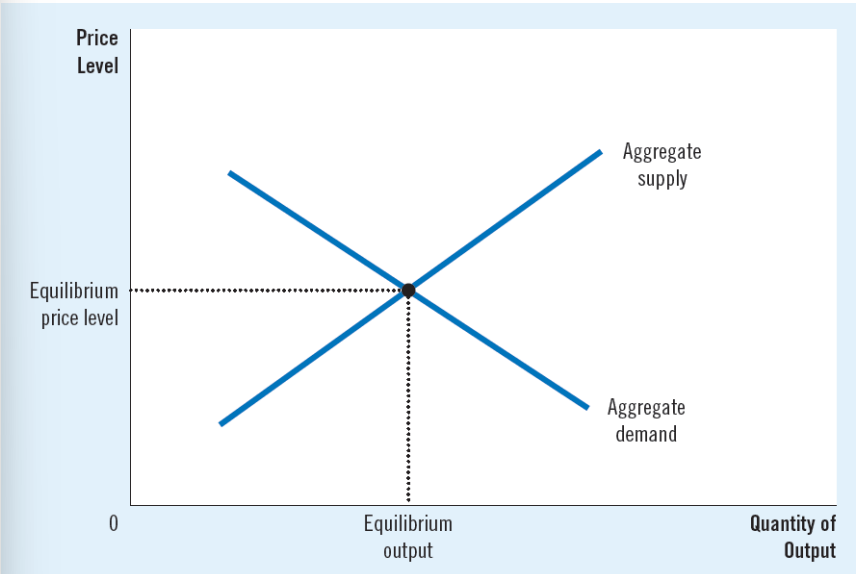
Output and the price level adjust
to the point at which the aggregate-supply and aggregate demand curves intersect
Aggregate demand as model
Equillibrum output X Equillburim price level = GDP
diffrence from micro economic model:
In market demand and supply model the customers may move into/from another market (for another product) and the suppliers may move resources from/to another market (for input)
( consumers and suppliers move around)
reasons for downward sloping Aggregate demand curve:
wealth effect, intrest rate effect, exchange rate effect
The price level and consumption (C) wealth effect
people spend more as the value of their assets rise
The price level and investment (I): the Interest rate effect
movement along the Aggregate Demand curve due to change in Price Level. Price level affects how much people spend and save, which affects the interest rate.
The price level and net exports (NX): the Exchange rate effect
prices of imported goods will change in value, including domestic products that rely on imported parts and raw materials
reasons for shift in Agg demand curve
changes in… consumption, investment, government spending, net exports & disasters
aggregate supply curve is vertical in long run
In the long run, price level has no impact,
Shifts of Agg supply in long run:
changes in labor, capital, natural resources, technical knowledge
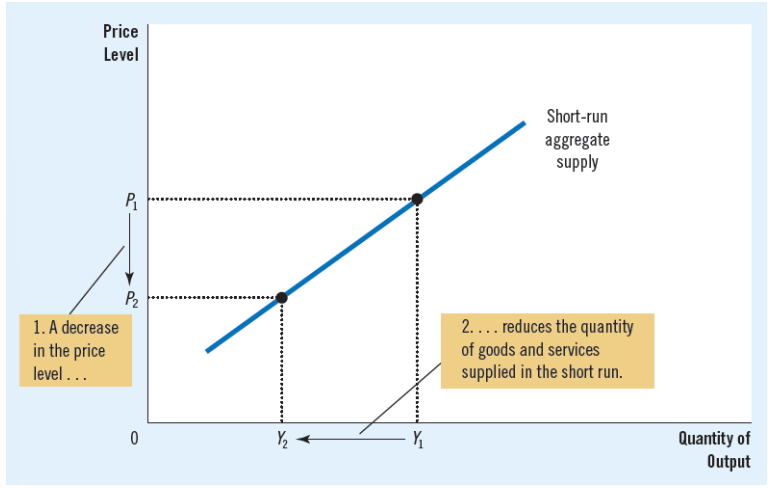
A-S curve slopes upward in short run
in short run, price level does affect the economy’s output→
increase in the overall level of prices in the economy tends to raise the quantity of goods and services supplied (short run!)
decrease in the level of prices tends to reduce the quantity of goods and services supplied (short run!)
why does short run A-S curve slope upward
sticky wage theory, sticky price theory, misperceptions theory
Sticky-Wage theory
nominal wages are slow to adjust to changing economic conditions
Sticky-Price theory
prices of some goods and services also adjust sluggishly in response to changing economic conditions
Misperceptions theory
changes in the overall price level can temporarily mislead suppliers about what is happening in the individual markets in which they sell their output ( suppliers respond to changes in lvl of prices )
Sifts of A-S in short run
changes in … labor, capital, natural resourses, technical knowlege, expected price level
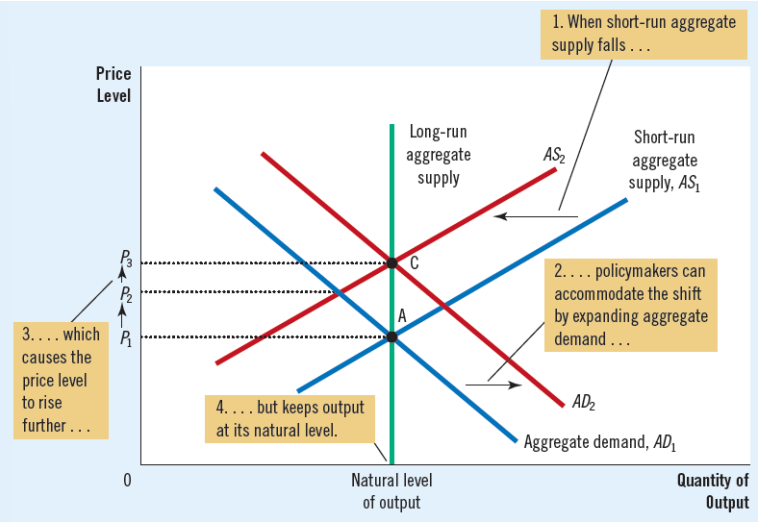
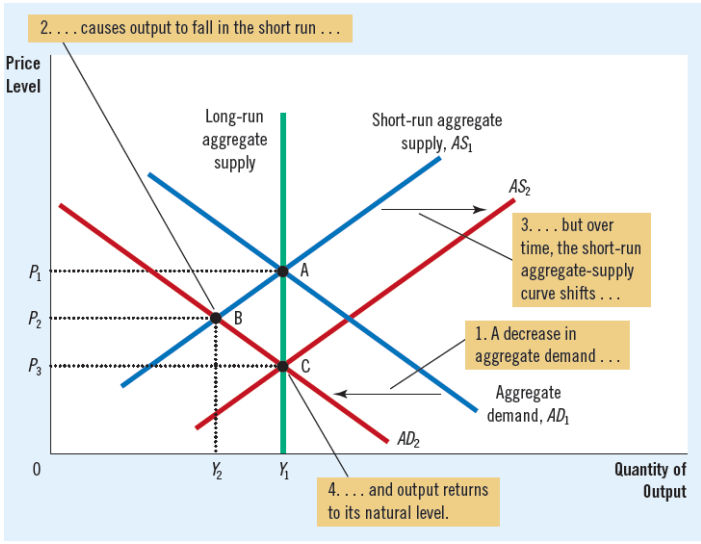
Contraction in aggregate demand
Contraction in aggregate supply
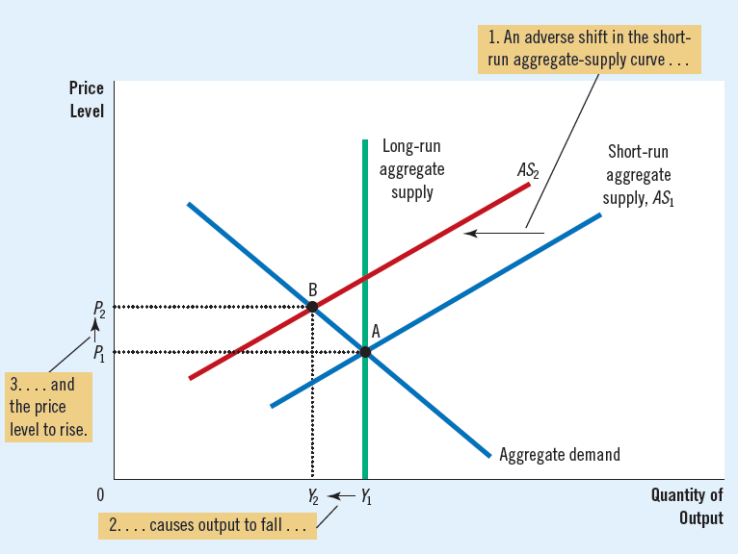
A-D reaction to adverse shift of A-S