13 - Level of overall economic activity
1/29
There's no tags or description
Looks like no tags are added yet.
Name | Mastery | Learn | Test | Matching | Spaced |
|---|
No study sessions yet.
30 Terms
What is commonly used to measure national income
Gross domestic product - GDP
Output method - National income
measures the value of the goods and services produced
Summing all of the value added by all the firms
at each stage of production process, deduct cost of input, in order to not double count
Data usually grouped in different sectors
Income method
measuring national income
value of all the incomes earned in the economy
Expenditure method
measuring national income
Value of all spending on goods and services in the economy
include:
Household spending, consumption
spending by firms, investment
government spending
spending by foreigners on exports minus import spending, net exports
What is GDP
Total value of all final goods and services produced in an economy in a year
GDP components
C + I + G+ (X-M)
What is national income equal to
National output=national expenditure
GDP
Total economic activity in a country regardless of who owns the productive assets
e.g. if an (MNC) is operating in canada, counted in canadas GDP - not indian
GNI
Total income that is earned by a countrys FOP’s regardless of where assets are located
indian MNC would be counted in Indias GNI
GNI Equal to
= GDP + Income from assets - income paid to foreign assets abroad
= GDP + Net property income from abroad
Income earned by assets abroad:
Property income from abroad
Difference between income earned from assets abroad minus income paid to foreign assets operating domestically
Net property income from abroad
What must you consider when comparing GDP from one year to another
Must consider that the priced likely rose
overstate value of GDP
That is, GDP will rise even if there hasn’t actually been increase in economic activity
How to get GDP at constant prices
take the nominal GDP and adjust for inflation to get GDP at constant prices
done through GDP deflator - value known as real
real GDP =
Nominal GDP adjusted for inflation
Real GNI =
Nominal GNI adjusted for inflation
GDP per capita
Total GDP / Size of population
GNI per capita
Total GNI / Size of population
Why are national income stats gathered
can be seen as a “report card“. Measure growth
Government use to develop policies
models of the economy and forecast future
performance of economy over time
living standards
comparing countries
Limitations of NI stats
inaccuracies
unrecorded or under-recorded economic activity - informal markets
Not everything is recorded, e.g. work from home
E.g. underdeveloped countries, farmers may grow thier own food, GDP undervalued
Illegal markets
foreign workers without permits
avoid taxes, e.g. cigs
understate full income, avoid tax
external costs
Doesn’t account resource delpetion
Cutting down trees can increase GDP, no accounting for the loss
quality of life concerns
may grow, longer hours, less holidays
volunteer work not counted, discouraged in economic growth
composition of output
Don’t benefit consumers (Capital/Defence goods)
hard to argue that increase GDP = Increase living standard
What is the business cycle
periods of rising and slowing growth
periodic fluctuations in economic activity measured by changes in real GDP
Labeled business cycle
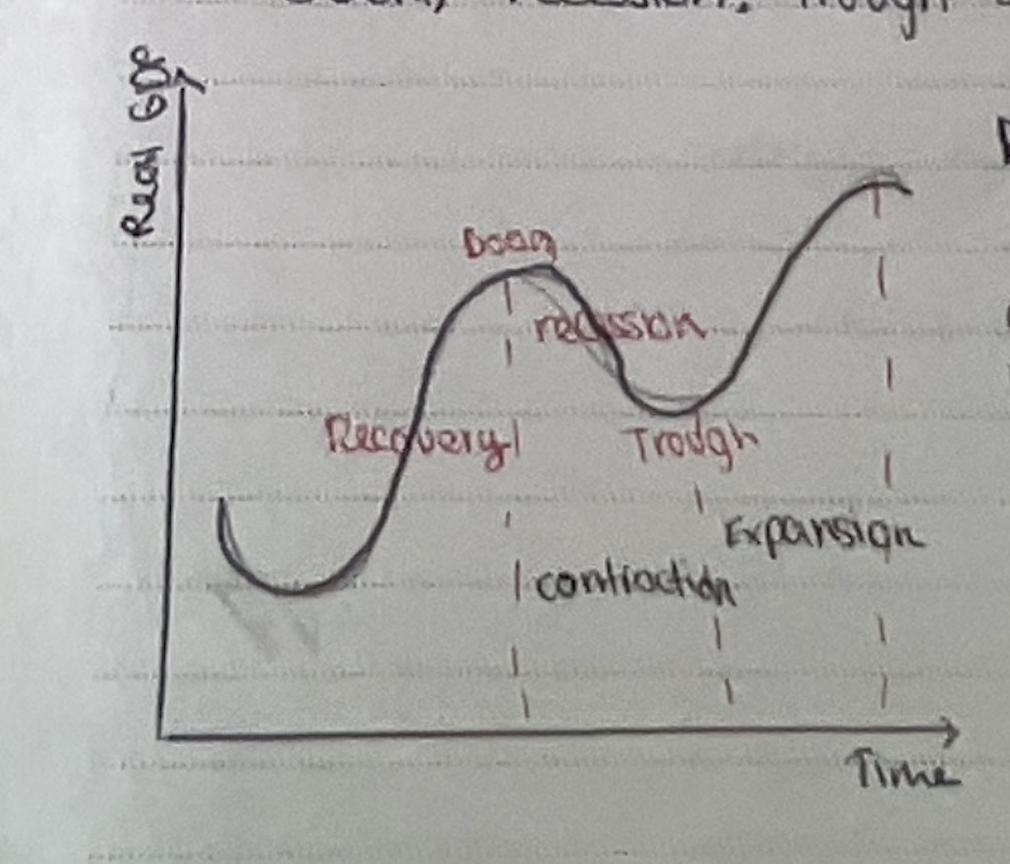
Recovery: Business cycle
GDP increasing due to AD increasing, houses and business spend more
To meet this AD, firms increase output and unemployment falls
Economy in boom
Economic policy makers, likely to react and try to slow growth, decrease AD - start of recession
Recession
Two consecutive quarters of negative GDP growth, falling GDP. Unemployment increases, low AD, lower rates of inflation, deflation
What will contraction do eventually
Come to an end, known as trough.
Output cannot fall forever.
Low demand for money for investments will result in low interest rates. AD will increase, enter recovery
Positive VS negative output gap
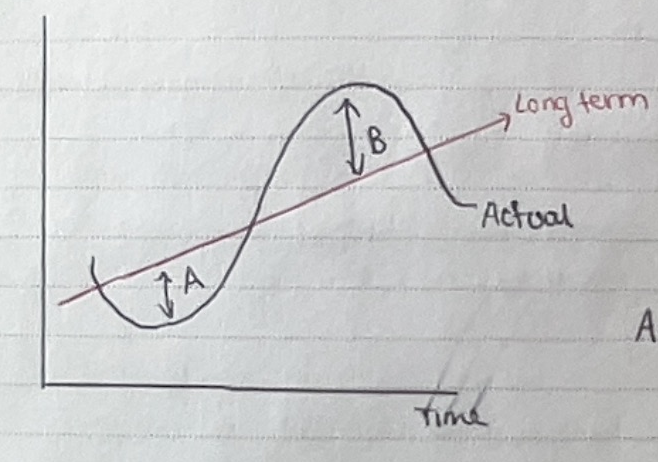
long term represents the growth which an economy can sustain over time
difference between lines = output gap
A = negative output gap - economy producing below, unemployment
B = positive output gap - economy producing beyond capacity, inflation
OECD better life index
mission to promote policies that will improve social and economic well being
comparison of well being across countries
11 topics
11 topics OECD
Material living (Housing income, jobs)
Quality of life (Community, education, environment, governance, health, life satisfaction, safety, work - life balance)
Happiness index
main consideration: GDP per capita, social support, healthy life expectancy, freedom to make choices, generosity, perception of corruption
Happy planet index
Well being x Life expetancy x Inequality of income // ecological footprint (Global hectares pp)