AP Statistics Unit 6
1/29
Earn XP
Description and Tags
Just some useful notes for the AP Stats. Fomula Sheet: https://apcentral.collegeboard.org/media/pdf/statistics-formula-sheet-and-tables-2020.pdf.
Name | Mastery | Learn | Test | Matching | Spaced | Call with Kai | Chat |
|---|
No analytics yet
Send a link to your students to track their progress
30 Terms
(6.1) How do we determine if the evidence for a claim is convincing?
Consider the two explanations for the evidence (random chance, real effect).
Estimate the probability of getting evidence as strong or stronger than the observed evidence by chance alone.
If you can eliminate random chance as a plausible explanation for the evidence, the evidence for the claim is convincing.
(6.2) How do we verify the conditions for calculating a confidence interval for a population proportion
The data is calculated using a random sample from the population
When sampling without replacement, the sample size is less than or equal to 10% of the population size.
Both np̂ ≥ 10 and n(1 - p̂) ≥ 10
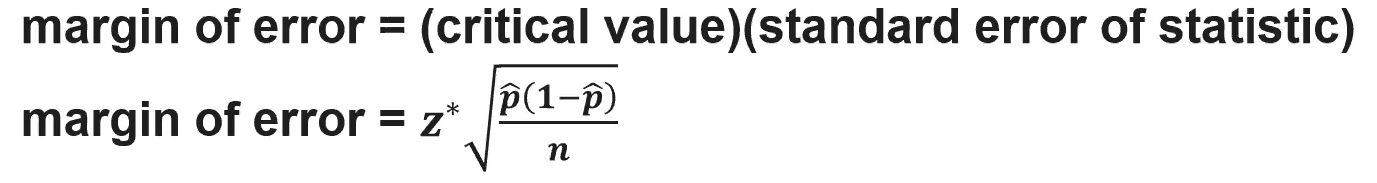
(6.2) How do we determine the margin of error when estimating a population proportion?
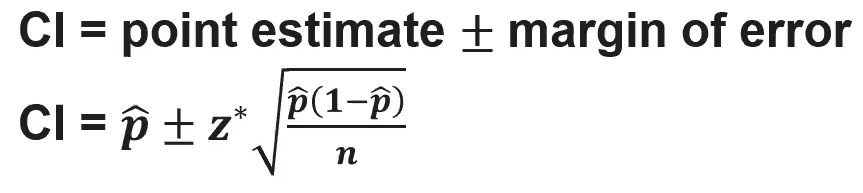
(6.2) How do we calculate a confidence interval for a population proportion?
(6.2) How do we determine the minimum sample size that will achieve a given margin of error?

(6.3) How do we interpret a confidence interval for a population proportion?
“We are C% confident that the interval from ___ to ___ captures the [population parameter].”
(6.3) How do we interpret a confidence level for a confidence interval for a population proportion?
In repeated sampling with the same sample size, approximately C% of C% confidence intervals will capture the population proportion.
(6.3) How do the sample size and confidence level affect the margin of error for a confidence interval for a population proportion?
Assuming everything else stays the same:
Increasing the sample size will decrease the margin of error.
Increasing the confidence level will increase the margin of error.
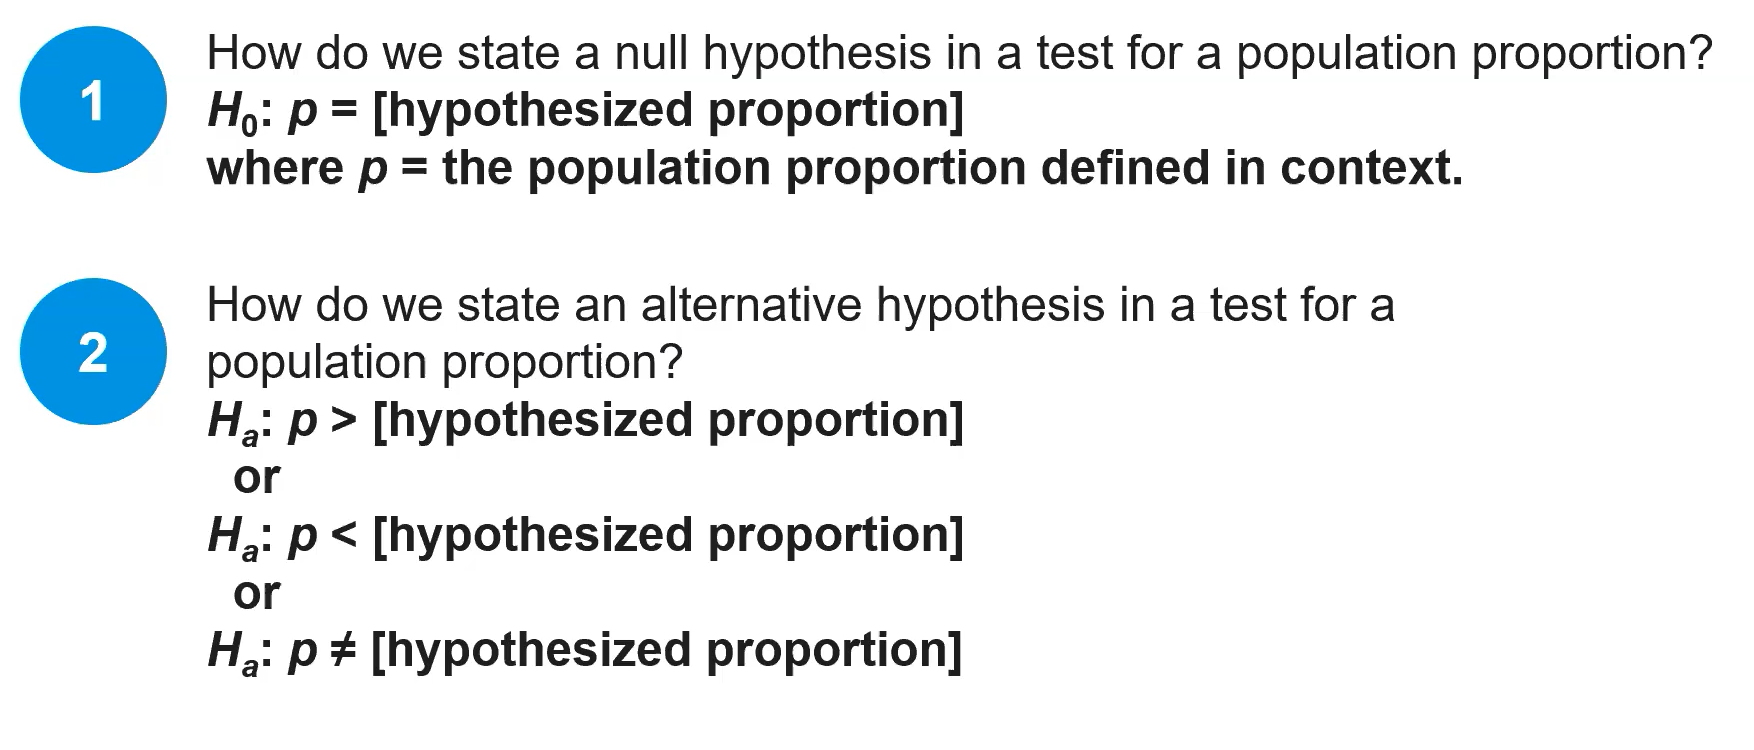
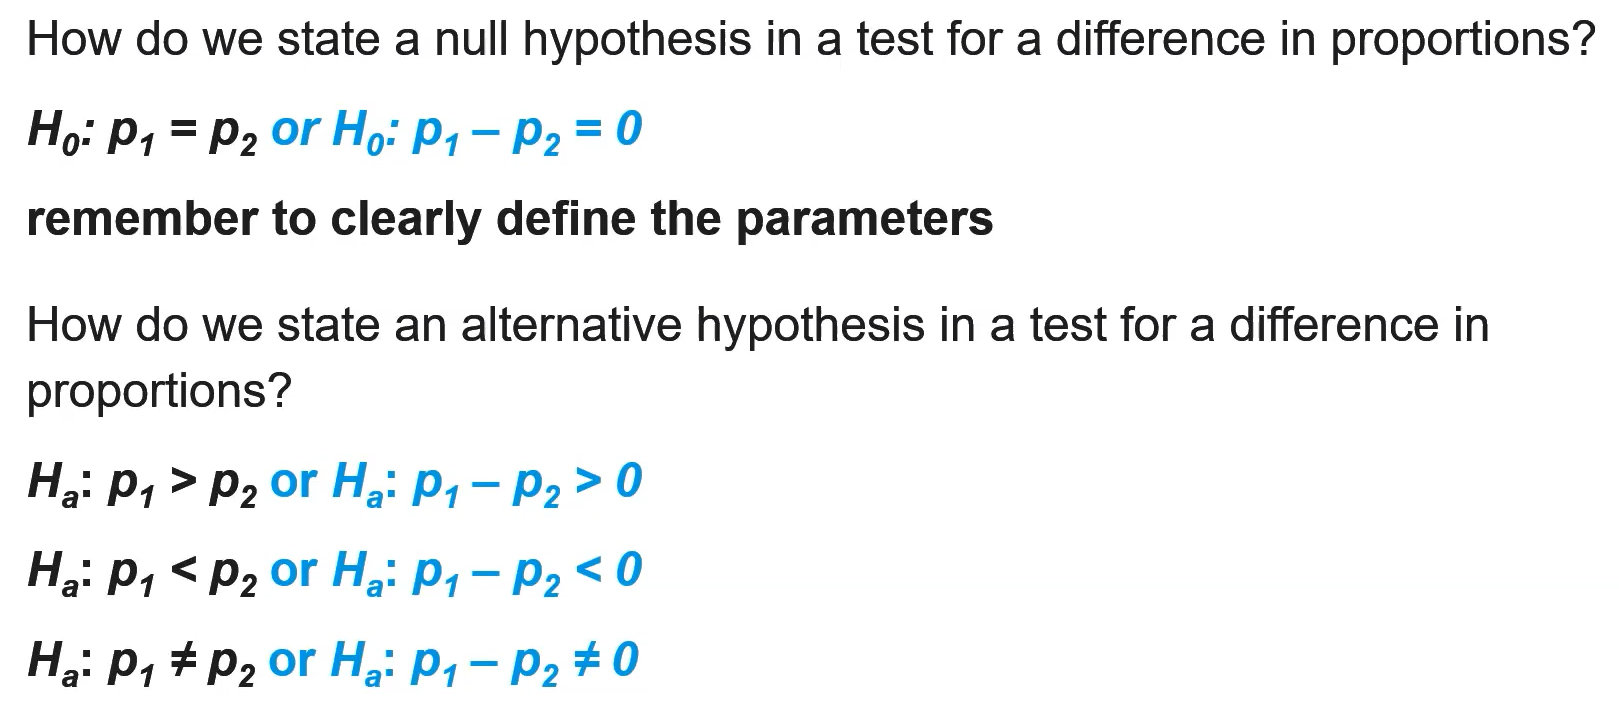
(6.4) Null & Alternative Hypotheses
(6.4) How do verify the conditions for performing significance test for a population proportion
The data is collected using a random sample from the population.
When sampling without replacement, the sample size is less than 10% of the population size
Both np0 ≥ 10 and n(1 - p0) ≥ 10, where p0 is the proportion specified by the null hypothesis.
(6.1/2/3/4) When dealing with hypotheses…
P0 is used instead of p̂ since we are assuming the null hypothesis (H0) is true until convinced otherwise
(6.5) How to calculate a standardized test statistic using the AP Statistics Formula Sheet
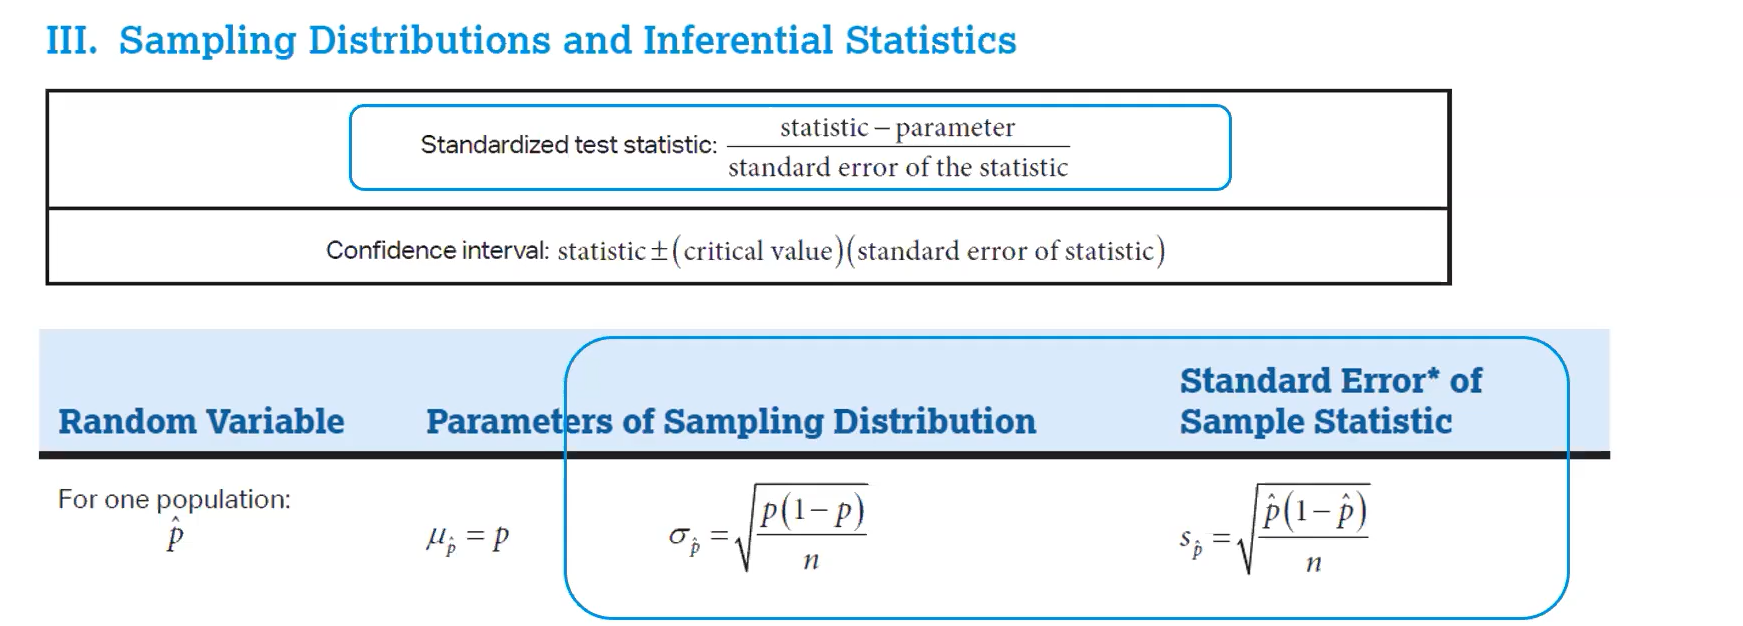
(6.5) How do we calculate an appropriate test statistic in a test for a population proportion?
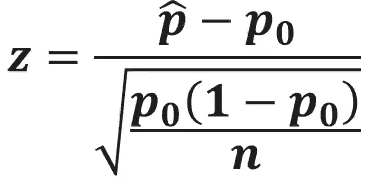
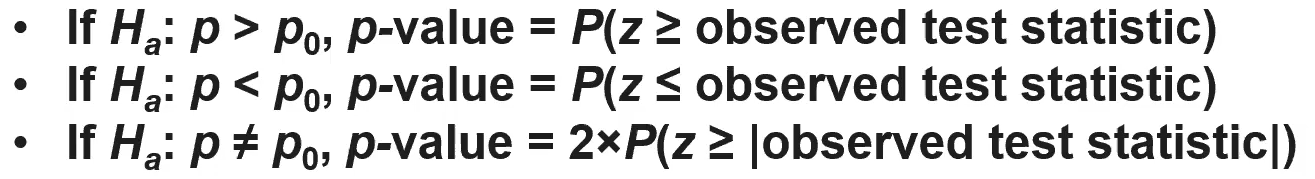
(6.5) How do we calculate a p-value in a test for a population proportion?
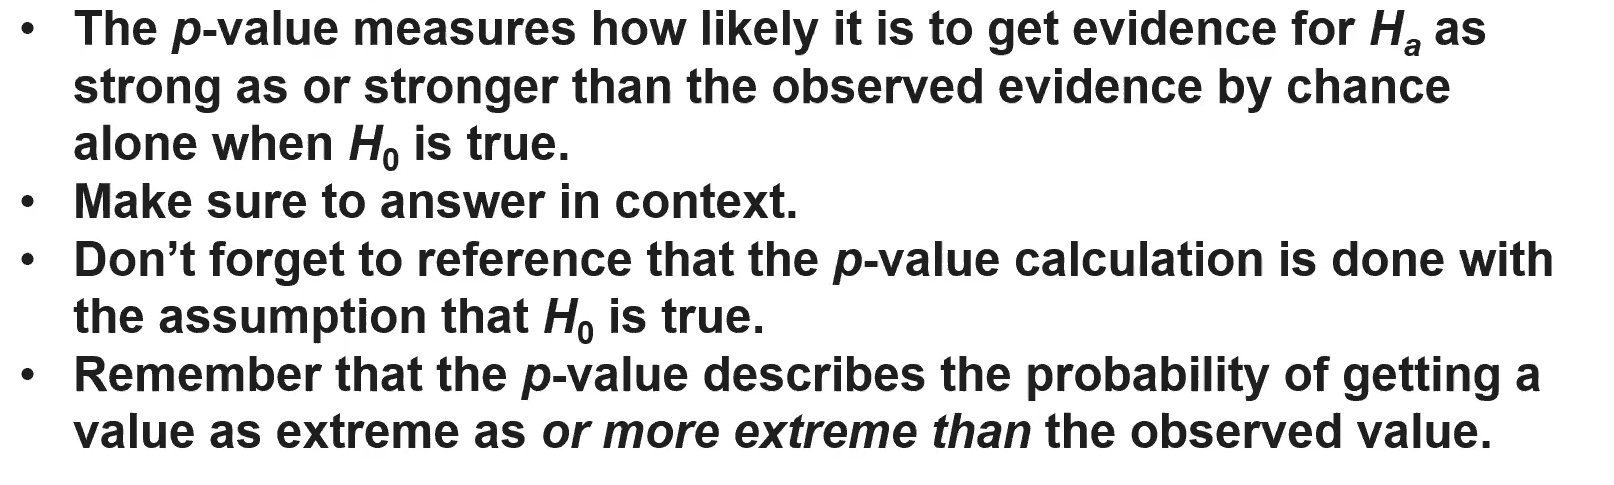
(6.5) How do we interpret the p-value in a test for a population proportion?
(6.6) How do we make a conclusion in a test for a population proportion.
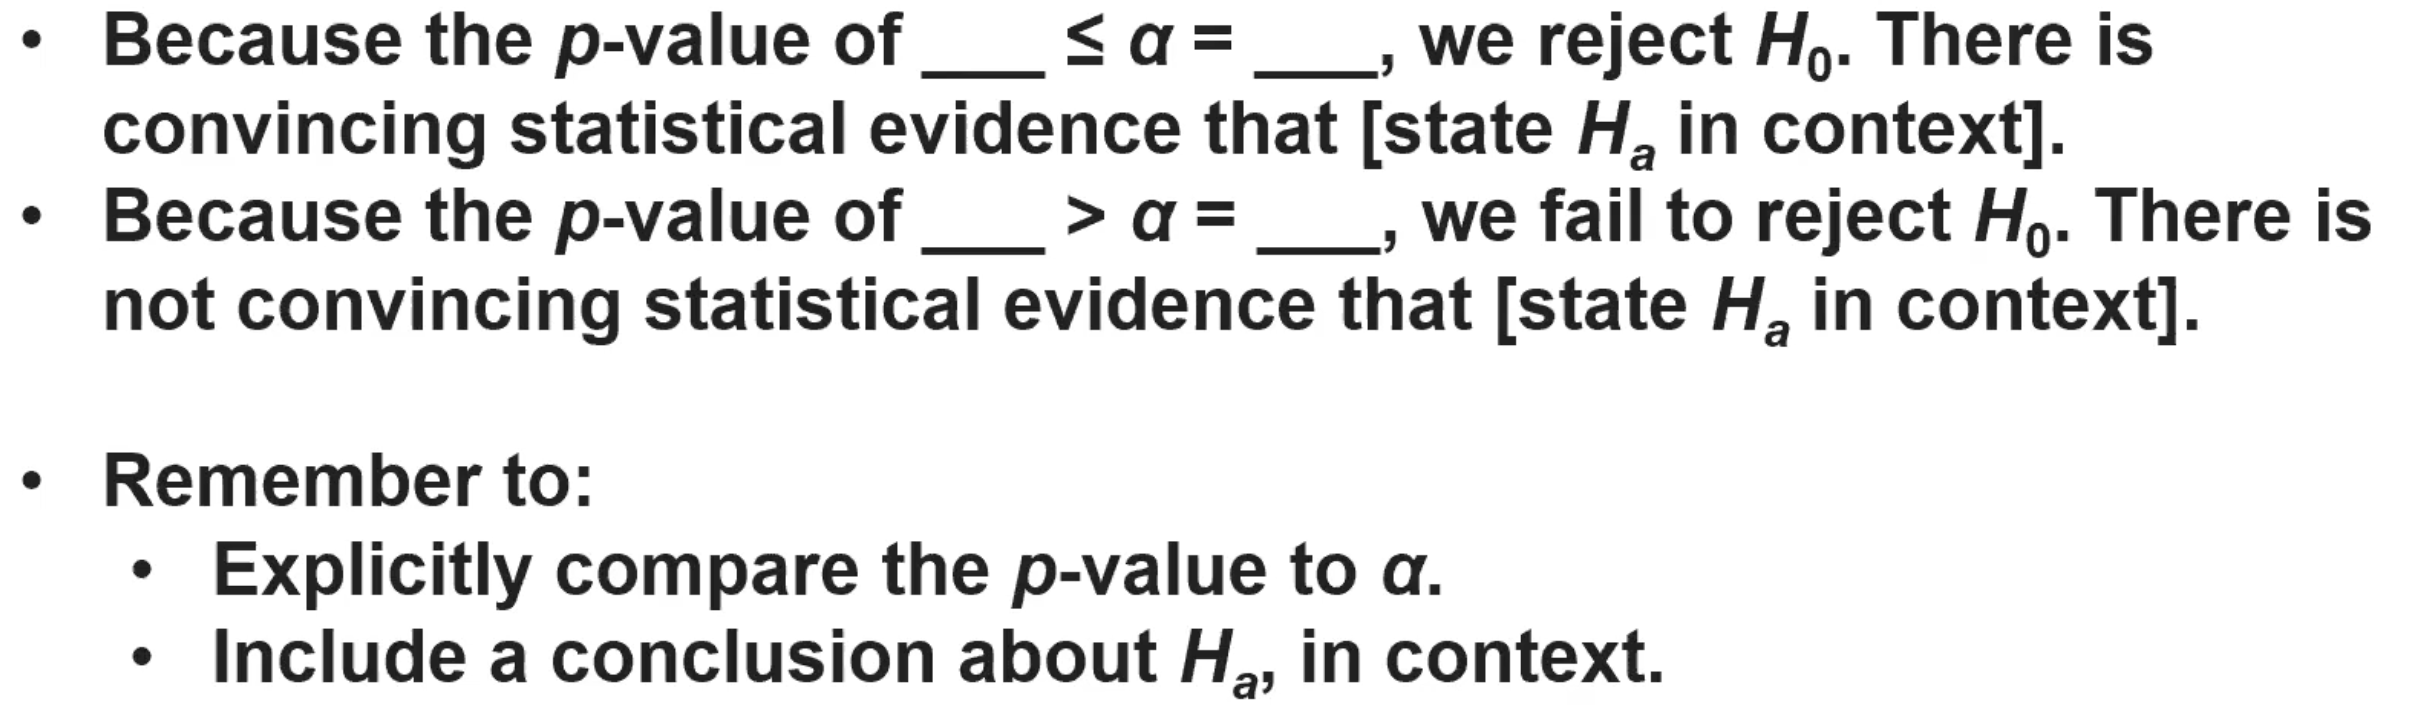
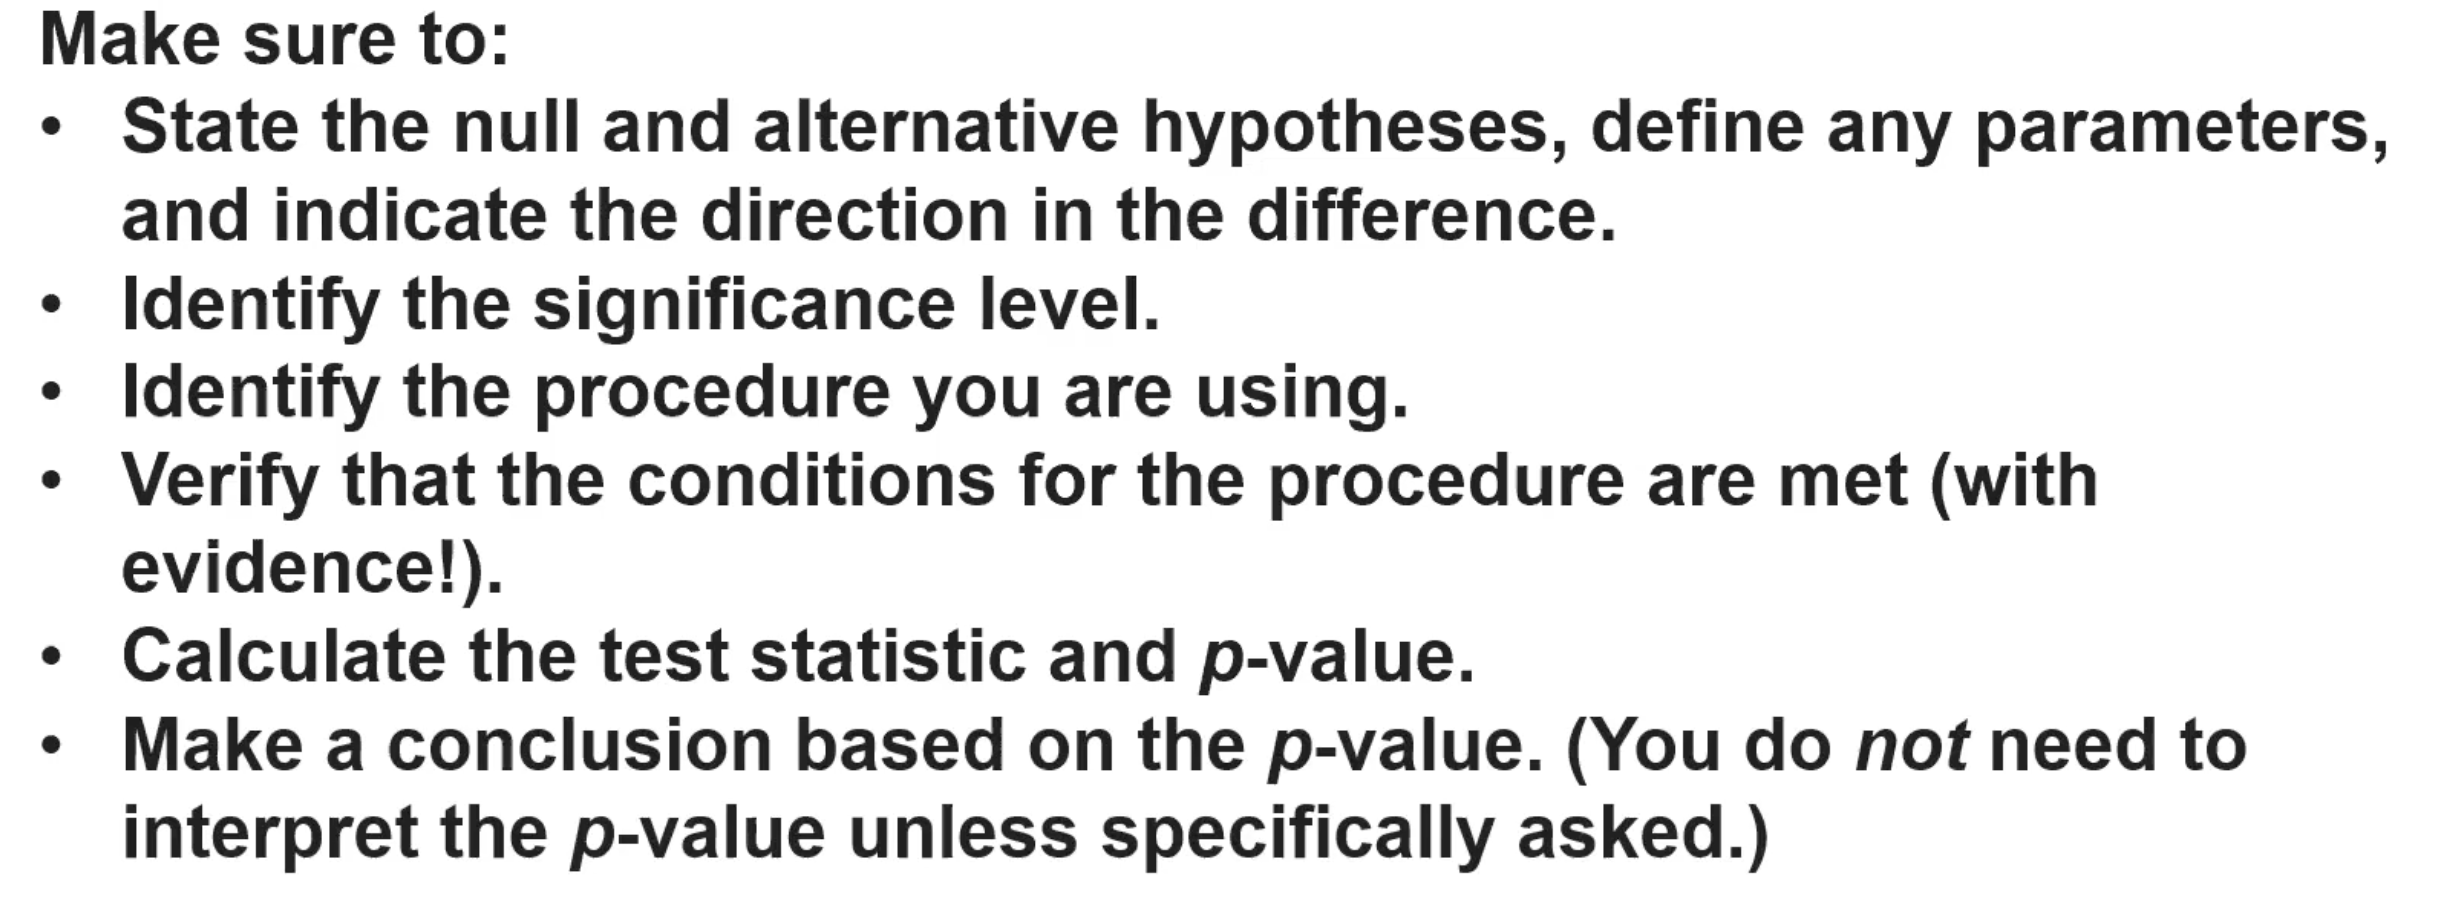
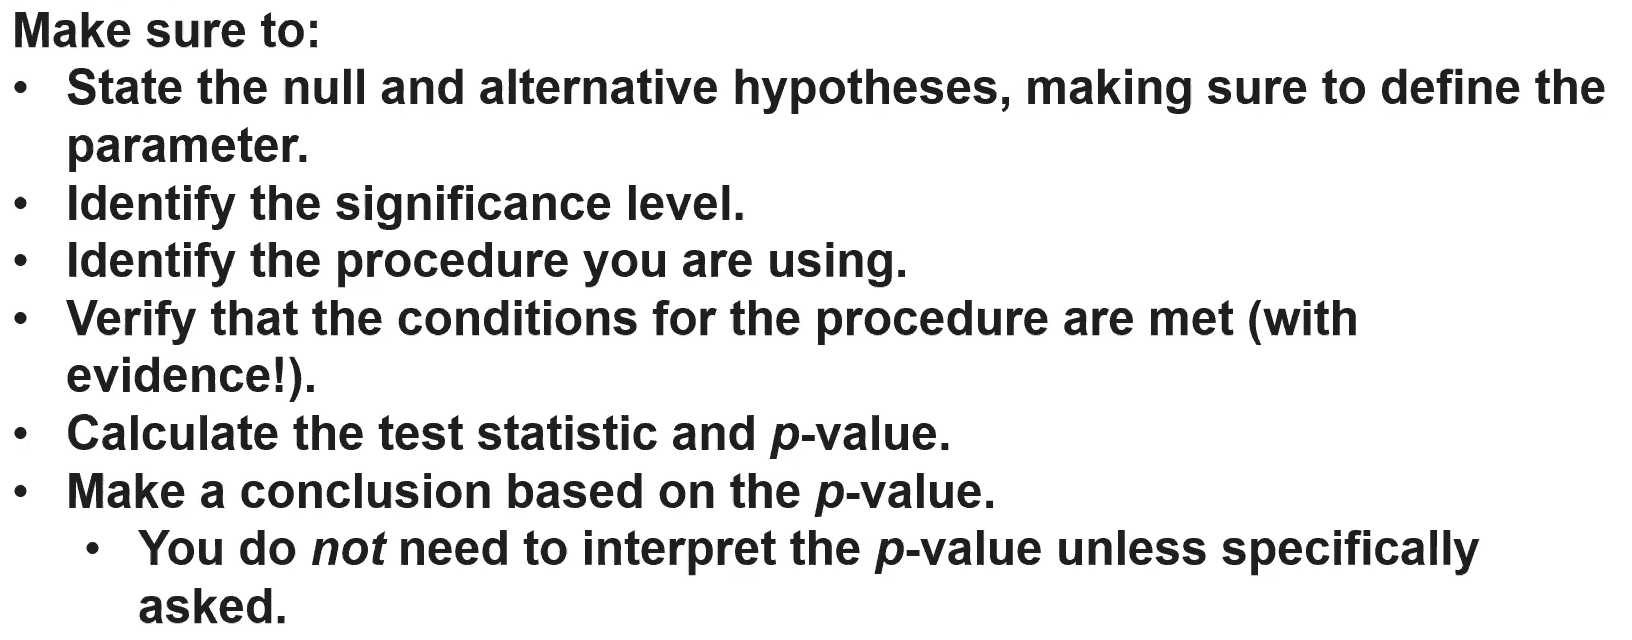
(6.6) How do we perform a significance test for a population proportion?
(6.6) What do you do if there is no stated significance level?

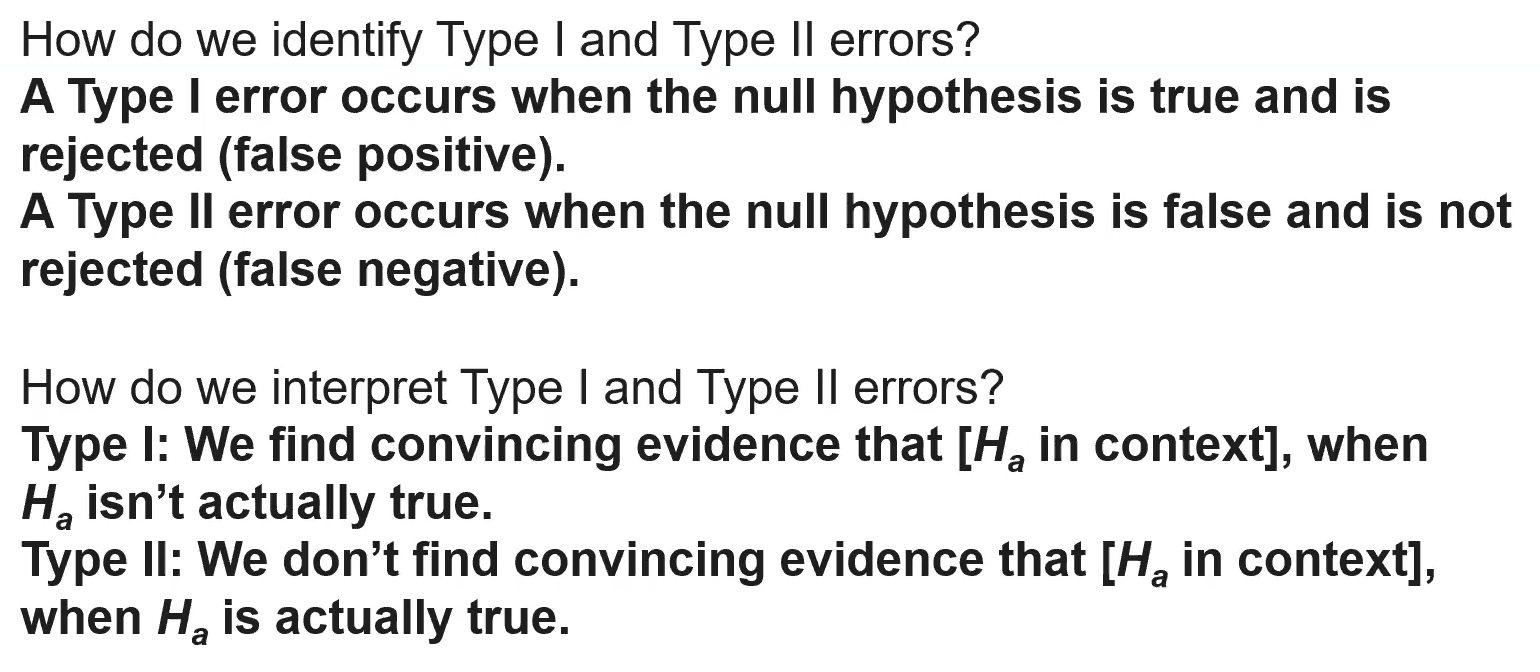
(6.7) How do we identify and interpret Type I and Type II errors?
(6.7) How do we calculate the probabilities of Type I and Type II errors?
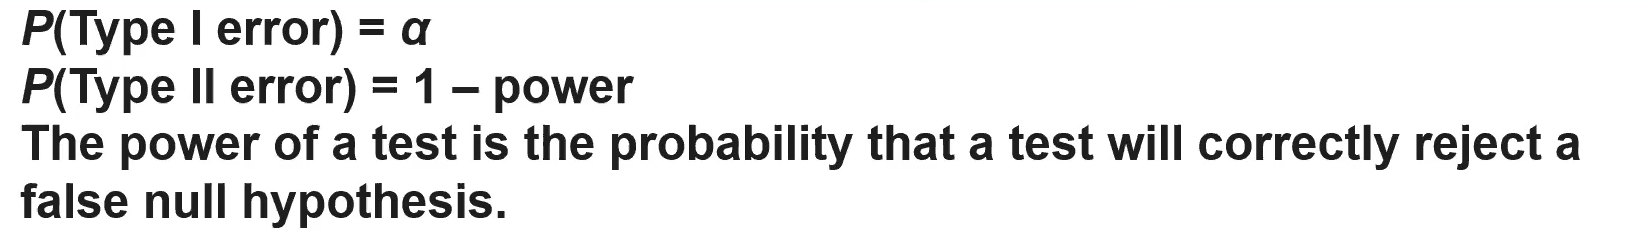
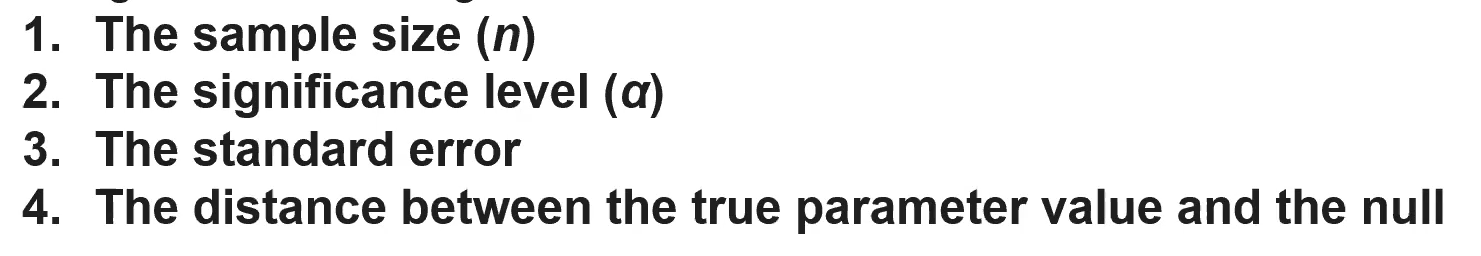
(6.7) What factors affect the power of a test and probabilities of errors in significance testing?
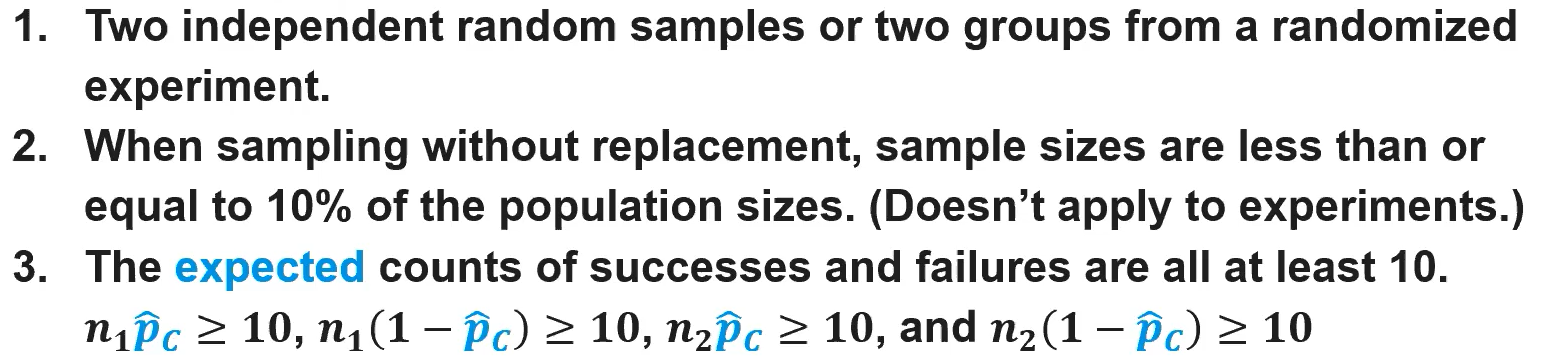
(6.8) How do we verify the conditions for calculating a confidence interval for a difference in proportions?
Two random samples or two groups from a randomized experiment
When sampling without replacement, sample sizes are less than or equal to 10% of the population sizes. (Doesn't apply to experiments.)
The counts of successes and failures are all at least 10.
n1p̂1 ≥ 10, n1(1 − p̂1) ≥ 10, n2p̂2 ≥ 10, and n2(1 − p̂2) ≥ 10
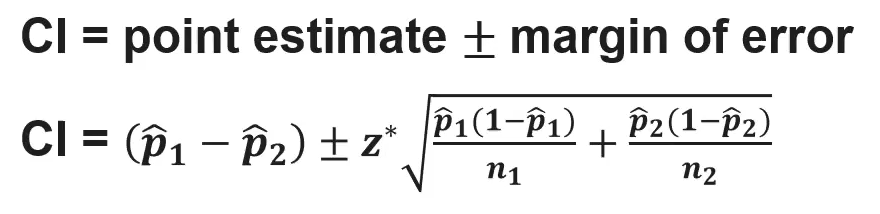
(6.8) How do we calculate a confidence interval for a difference in proportions?
(6.8) How do we interpret a confidence interval for a difference in proportions?
“We are C% confident that interval from __ to __ captures the [value to be estimated].”
Note: if the value from __ to __ falls into 0, the proportions would be the same and their difference would be the same.
(6.9) How do we construct and interpret a confidence interval for a difference in proportions?
Be sure to:
Define the difference in proportions you are trying to estimate.
Indicate the direction of the difference.
Define any subscripts you use.
Identify the procedure you are using.
Verify that the conditions for the procedure are met.
Calculate the confidence interval.
Interpret the interval in context.
(6.10) Significance Tests for a difference in proportions
(6.9) How do we verify the conditions for performing a significance test for a difference in proportions?
Note: p̂C = combined proportion of successes / combined number of observations
(6.10) How to calculate a test statistic and p-value for a significance test of a difference in proportions.
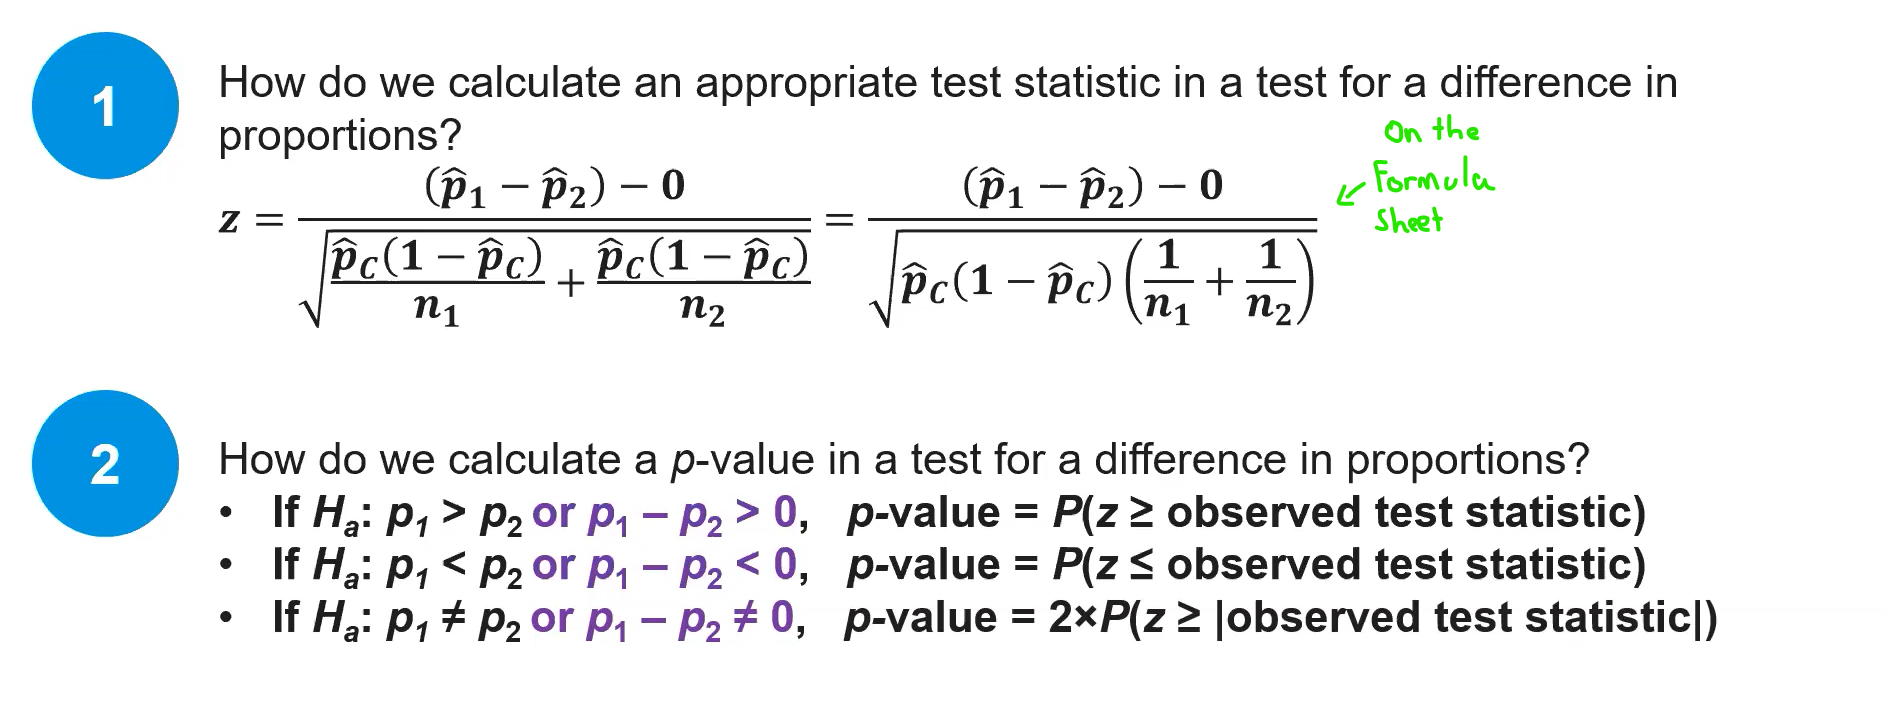
(6.11) How do we interpret and state a conclusion for a significance test for a difference in proportions?
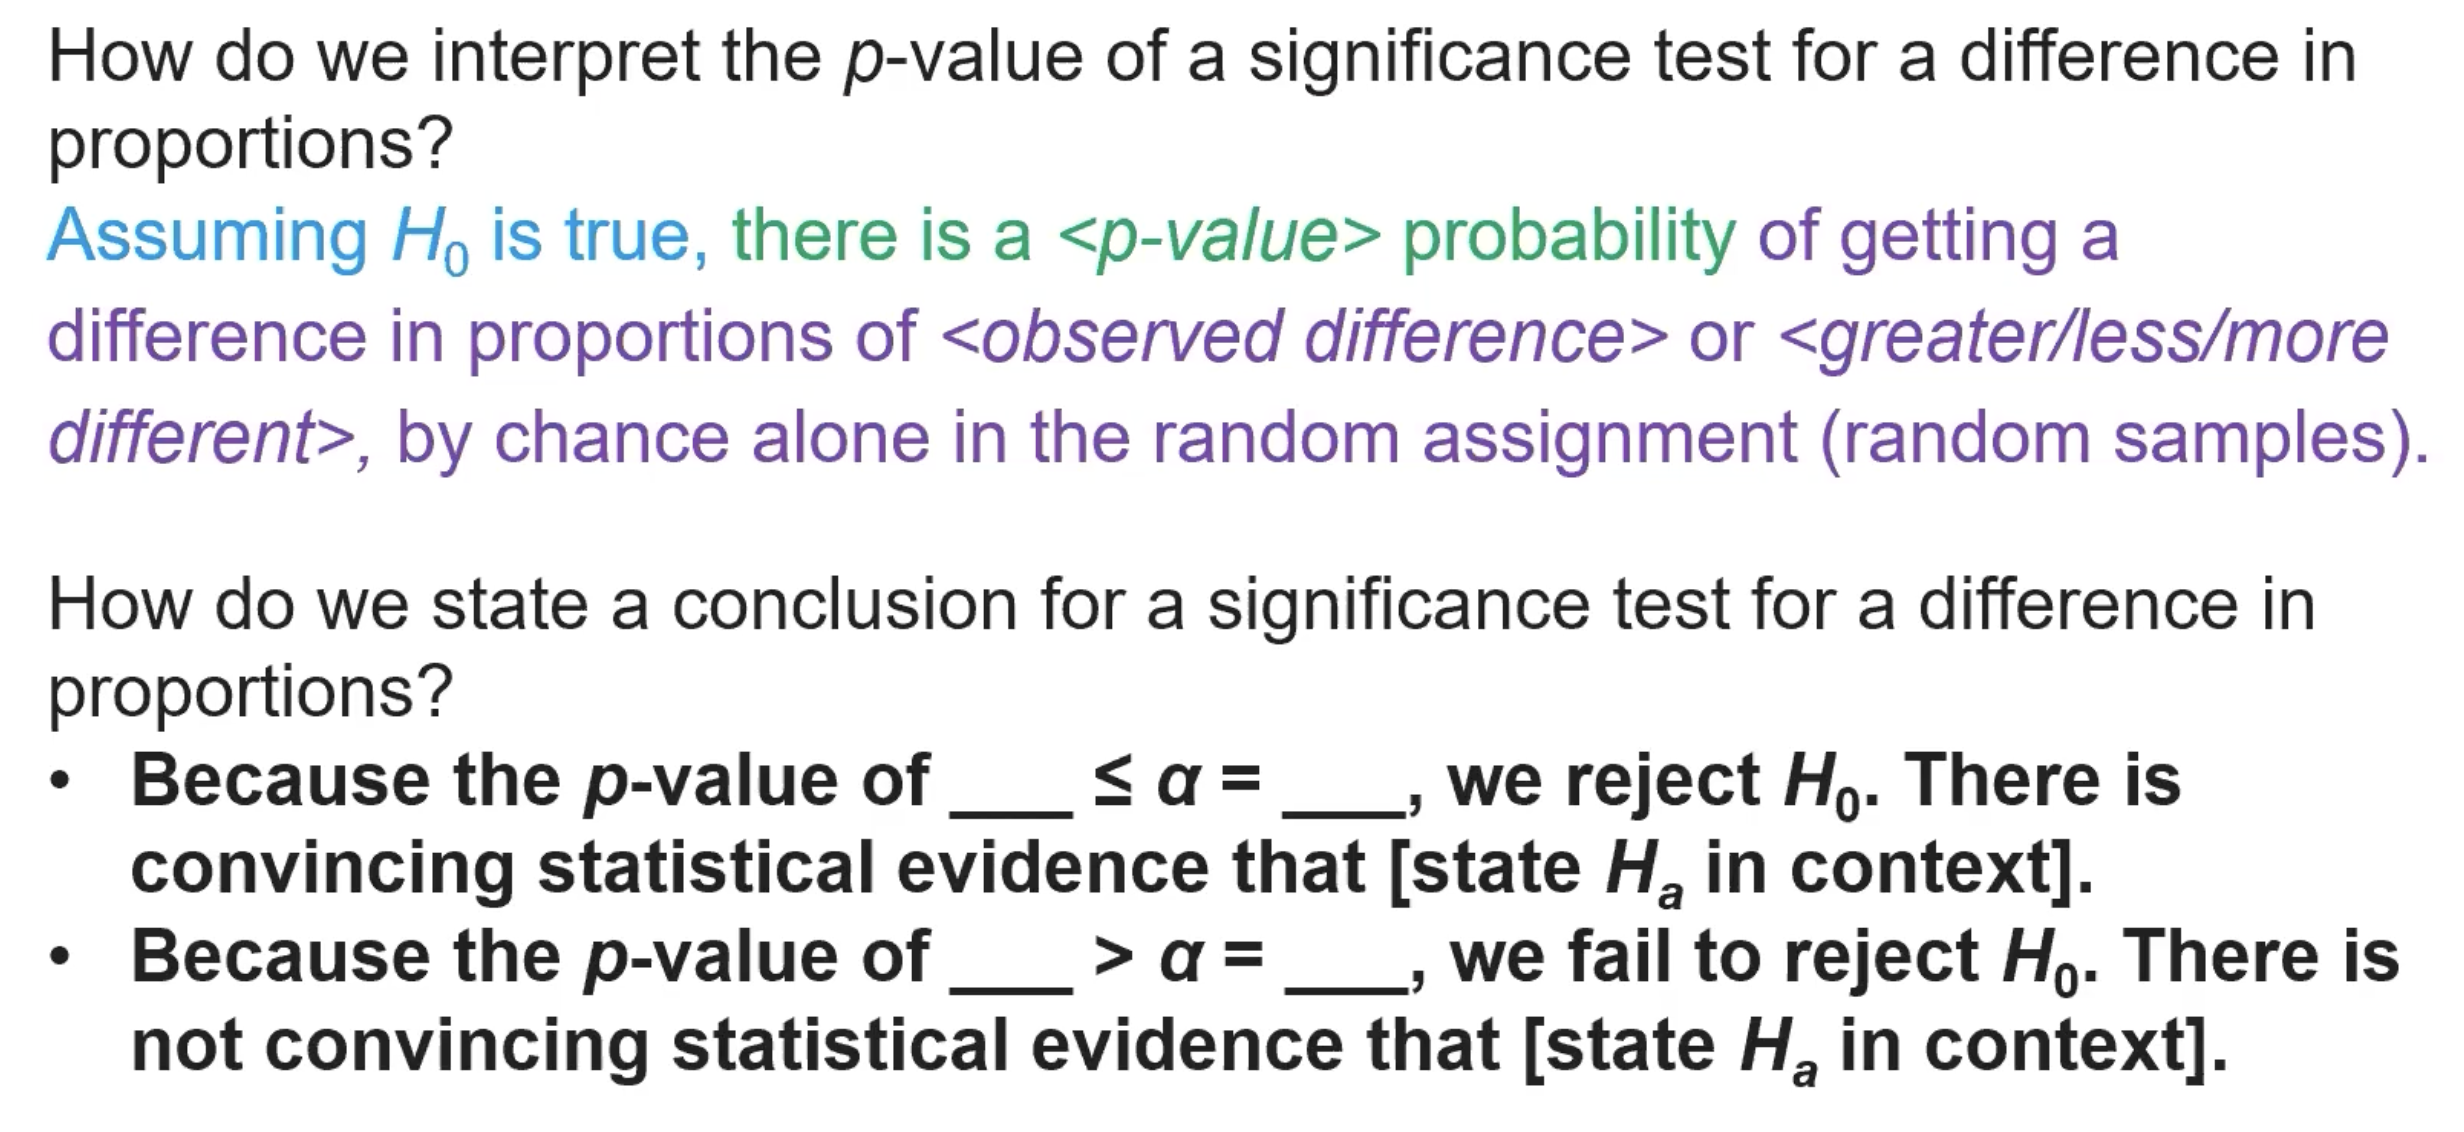
(6.11) How do we perform a complete significance test for a difference in proportions?