LEC 5: CH 6: HYPOTHESIS TESTING
1/20
There's no tags or description
Looks like no tags are added yet.
Name | Mastery | Learn | Test | Matching | Spaced |
|---|
No study sessions yet.
21 Terms
Null hypothesis
a specific statement about a population parameter made for the purposes of argument (it tells us what differences to expect from just random sampling error)
Alternative
represents all other possible parameter values except that stated in the null hypothesis.
Ex of null and alt
Example: Testing the effect of a new test drug on the recovery of patients
Null hypothesis: Recovery of patients given the test drug is the same as recovery of patients without the drug
Alternative hypothesis: Recovery of patients given the test drug is different from recovery of patients without the drug
Hypothesis testing: Rejecting the null hypothesis
If the data are “too unusual” under the null hypothesis, then we reject the null hypothesis (the data support the alternative hypothesis)
Hypothesis testing: Failing to reject the null hypothesis
If the data are not very unusual (reasonable probability of occurring) under the null hypothesis scenario, then we fail to reject the null hypothesis
Steps of a Statistical Tests
) State the hypotheses (determine a null hypothesis and alternative hypothesis)
. 2) Calculate a test statistic from the data (we’ll define this in a moment)
3) Determine the probability distribution of that test statistic under the null hypothesis (null sampling distribution).
4) Determine how probable it is to get test statistic values that are as extreme, or more extreme, than the observed test statistic under this null hypothesis (Pvalue).
5) Conclusion: If the observed test statistic, and all values more extreme than the observed test statistic, are sufficiently improbable (“weird”, unlikely) under the null hypothesis, then we reject the null hypothesis.
6) If the observed test statistic, and all values more extreme than the observed test statistic, are not sufficiently improbable relative to the null hypothesis, then we do not reject the null hypothesis.
Test statistic
a number calculated from the data that is used to evaluate how compatible the data are with the result expected under the null hypothesis
Null distribution
null distribution for a test statistic is the probability distribution of all possible outcomes when a random sample is taken from a population corresponding to the null expectation.
P-value
is the probability of getting the test statistic (as extreme, or more extreme) if the null hypothesis were true.
Calculating the P-value from the null distribution
P= 2 x Pr[observed value, or more extreme values]
![<p>P= 2 x Pr[observed value, or more extreme values]</p>](https://knowt-user-attachments.s3.amazonaws.com/cbdcb1d7-898f-451a-98e2-37fced914dfd.jpg)
Significance level alpha
The significance level, , is a probability used as a criterion for rejecting the null hypothesis. If the P-value for a test is less than or equal to alpha, null hypothesis is rejected
TYPE 1 ERROR
A Type I error is rejecting a true null hypothesis
• Probability of Type I error is (the significance level)
Type I and Type II errors
alpha determines the probability of rejecting a null hypothesis that is actually true (incorrectly supporting the alternative hypothesis)
As we decrease (probability of rejecting a true null hypothesis) we increase the probability of failing to reject a false null hypothesis (Type II error) A Type II error is failing to reject a false hypothesis
Type 2 error
Failing to reject a false hypothesis
• The probability of a Type II error is (usually not known)
Power
The power of a test is the probability that a random sample will lead to rejection of a false null hypothesis
Power = 1- B
• In designing an experiment, having more power is good (but it’s difficult to quantify)
. • Large sample size → High power
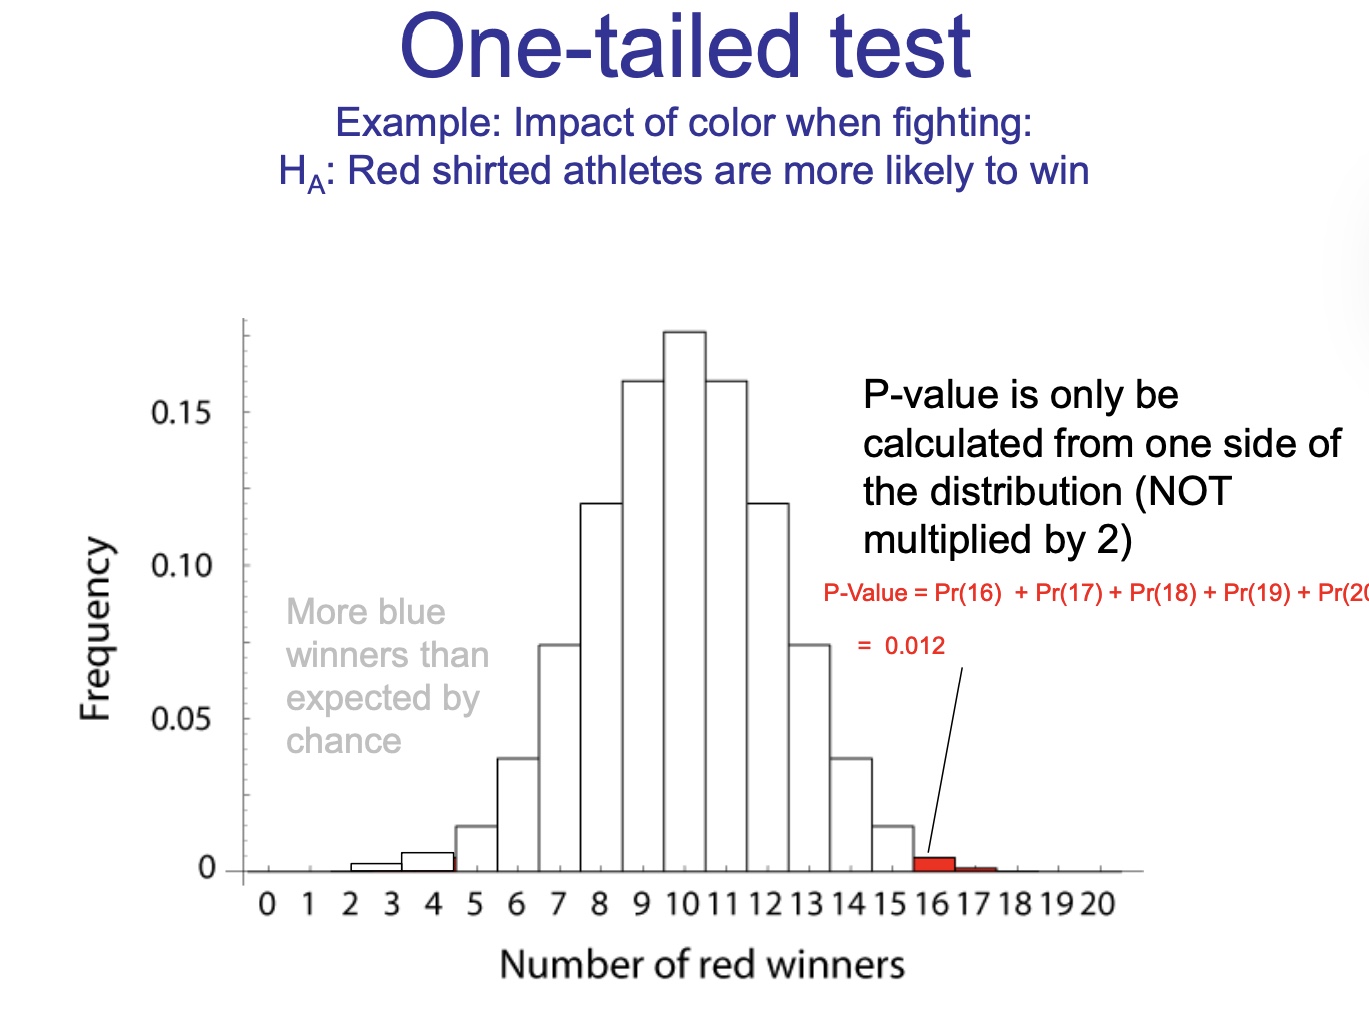
One- and two-tailed tests
• Most tests are two-tailed tests.
• This means that a deviation in either direction would reject the null hypothesis.
• Normally alpha is divided into /2 on one side and alpha/2 on the other.
One-tailed test
Only used when the other tail is makes no sense in relation to the proposed hypothesis (section 6.5 in textbook)
• In most cases, tests are typically twotailed. Use a two-tailed test unless you have very special circumstances.
Statistically significant
P ≤ a ( is our significance level, often 0.05) •
If P ≤ 0.05we “reject the null hypothesis”
• When reporting a result, give:
o The value of the test statistic (e.g., 16/20 red shirt winners)
o Sample size (or degrees of freedom – more about that in future lectures)
o The P-value
We don’t “accept the null hypothesis” After testing the null hypothesis, we:
EITHER If P ≤ 0.05 then reject Ho (significant result – it’s significantly different from the null hypothesis; the sample data support the alternative hypothesis)
OR If P > 0.05 then fail to reject Ho (nonsignificant result; the sample data are compatible or consistent with the null hypothesis)
Statistical significance ≠ Size of effect or Biological importance
A very small P-value (highly significant results) does not necessarily mean that there is a very big effect (big difference between groups).
It is possible to have a very tiny P-value, event when two groups are only slightly different from one another (e.g., if you have a very large sample size, which would give you a test with a high power)
Four steps to hypothesis tests:
state the hypothesis
ii. compute the test statistic
iii. determine the P-value
iv. draw the appropriate conclusion