AP Stats Unit 2
1/27
There's no tags or description
Looks like no tags are added yet.
Name | Mastery | Learn | Test | Matching | Spaced | Call with Kai |
|---|
No analytics yet
Send a link to your students to track their progress
28 Terms
How is 2-Variable data usually displayed?
Two-Way/Contingency table
Association
If changes in one variable lead to different distributions between different groups, the two variables are associated
Joint relative frequency
1 cell / entire table
Marginal relative frequency
entire row or column / entire table
Conditional relative frequency
total of 1 cell / its respective row or column
What acronym is appropriate to use when asked to describe scatterplots?
CDOFS:
C- Context
D- Direction
O- Outliers/Unusual features
F- Form
S- Strength
Correlation coefficient (r)
Quantifies how close data points adhere to a line of best fit / strength of a model
What is the rule about correlation and causation?
Correlation DOES NOT equal causation.
Linear regression equation
ŷ = a+bx
Extrapolation
Using a linear model to predict an x-value outside of the given set
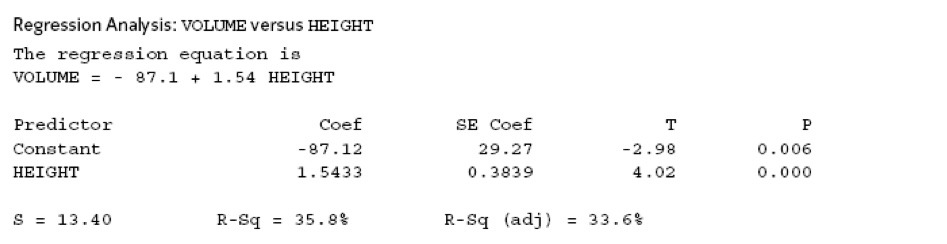
How do you read computer readouts?
a= -87.12
b= 1.5433
x= Constant
y= HEIGHT
Residual
How far a given point is from the model’s prediction
Residual plot
Judges the appropriateness of a model.
How do you know a residual plot is favorable vs not?
You want to see a random distribution with no apparent form.
Least Squares Regression Line (LSRL)
Linear equation that minimizes the sum of squared residuals. (See graphs on 2.8 notes to better understand difference)
Coefficient of determination (r²)
Percent of variation in the response variable that can be explained by the explanatory variable.
What ways can you judge if a linear model is appropriate?
YES: r, Residual scatter plot
NO: r²
Outlier
A point that doesn’t follow the general trend, and therefore impacts the model’s strength because of its large residual
High leverage point
A point with a significantly larger x-value than any other point. CAN follow the general trend, but may impact slope or y-int
If you want to make a graph for categorical subsets of a categorical data, what kinds of plots can you use?
(See 2.1-3 notes for example)
Side by side bar graphs, segmented bar graphs, mosaic plots
Where does the explanatory variable go?
x-axis
Where does the response variable go?
y-axis
What does the slope of a line say about its association
Upward slope- Positive assoc.
Downward slope- Negative assoc.
Can you accurately calculate r for a nonlinear relationship?
No
What does a positive residual indicate?
The model underestimated the response variable.
What does a negative residual indicate?
The model overestimated the response variable.
Is a residual plot appropriate to use if it fans inward/outward?
No
Define an influential point
A point that, if removed, changes the linear regression substantially