Introductory Research wk1-3
1/52
Earn XP
Description and Tags
UniSA BEHL2019
Name | Mastery | Learn | Test | Matching | Spaced | Call with Kai | Chat |
|---|
No analytics yet
Send a link to your students to track their progress
53 Terms
What is statistical thinking?
A way of understanding a complex world by describing it in relatively simple terms.
These simple terms summarise and capture essential aspects of the
structure or function (or both) of the data
We can use statistics to
describe, decide and predict.
Important statistical concepts
learning from data, aggregation, uncertainty, sampling, causality and statistics
qualitative data
Descriptive representations of information, e.g. barriers to exercise
qualitative data collection
typically, interviews and focus groups
quantitative data
Numerical representations of information, e.g. average university grade point average
quantitative data collection
typically, observational and experimental studies
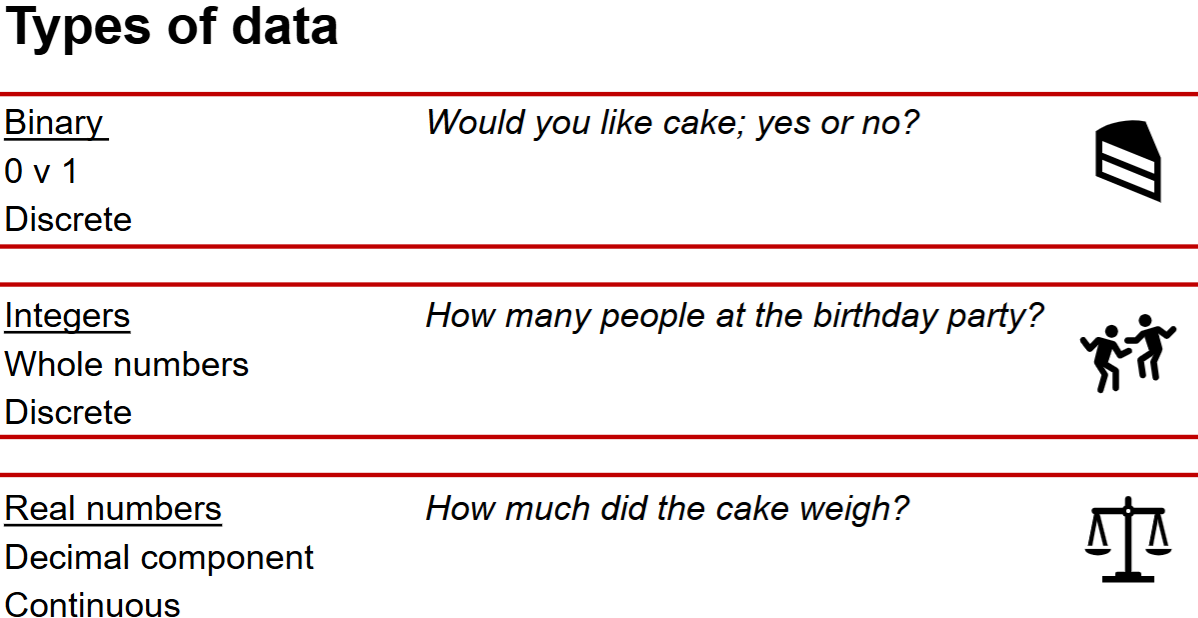
binary data
0 v 1 (yes v no), discrete
integer data
whole number, discrete
real number data
decimal component, continuous
a variable (factor) is a
measurable characteristic that must vary (have at least two possible measures)
height and sleep quality are variables
but not gender or school (these are constants)
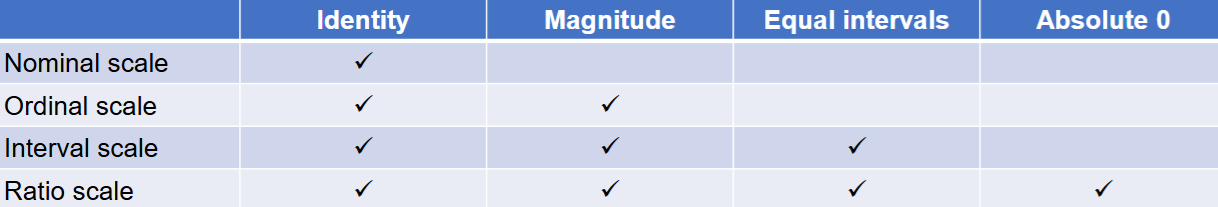
nominal scale
Each value of the variable represents something different. For example, we might ask people for their country of birth, and then code those as numbers: 1 = “Australia,” 2 = “Austria,” 3 = “Azerbaijan” and so on.
ordinal scale
Each value can be ordered in terms of their magnitude. For example, we might ask a person how good their sleep is, using a 1-7 numeric scale.
interval scale
has all of the features of an ordinal scale, but in addition, the intervals between units on the measurement scale can be treated as equal. The scale can also take on negative values
ratio scale
has all the features of an interval scale, with the difference being that the ratio scale variable has a true zero point. A standard example is physical height
identity
each value of the variable has a unique meaning
magnitude
the values of the variable reflect different magnitudes and have an ordered relationship to one another
equal intervals
units along the scale of measurement are equal to one another. This means, for example, that the difference between 1 and 2would be equal in its magnitude to the difference between 19 and 20
absolute zero
the scale has a true meaningful zero point. For example, for many measurements of physical quantities such as height or weight, this is the complete absence of the thing being measured
type ok
ok
type ok
ok
type ok
ok
cross-sectional designs
capture data at one point in time
longitudinal designs
capture data at multiple points in time
quasi-experimental designs
do not manipulate any variables, participants are subject to non-random assignment
population-based sample
representative of the population. e.g. random sample of Medicare numbers
convenience sample
not representative of the population. e.g. clinic-based or through social media advertisement
stratified sampling
based on pre-defined groups. e.g. equal numbers of 5-9, 10-14 and 15-19-year-olds.
Methods need to be appropriate to address your research aim.
Sampling biases should always be recognised and attenuated where possible.
outcome variable
is being measured in relation to the predictor; usually an exposure (e.g. risk or protective factor)
predictor variable
is a factor of interest and is being measured. Outcomes and predictors are used in observational research
you must ___ key terms
operationalise
you must ____ all key variables/factors
define
difference between research question and aim
they’re the same; one is a question
tables examples
frequency distributions (i.e., sleep hours, absolute frequency, relative frequency, percentage), cumulative distributions
most common graph
histogram
absolute frequency
exact count of times a specific data value occurs in a dataset
relative frequency
expresses this count as a proportion or percentage of the total number of observations
distribution
information on a variable
distribution properties
central tendency (median, mean, mode), how symmetrical/skewed it is on either side, how variable it is (i.e., data range, standard deviation and kurtosis) and if it's a 'normal' distribution
skew (symmetry of distribution)
positive means most values are at the lower end, negative means most are at the higher end
kurtosis (tail ends of distribution)
normal distribution/mesokurtic has a symmetrical bell-shaped curve
positive kurtosis (kleptocratic electrical distribution)
pulled up
negative kurtosis/platykurtic
pulled down
range
biggest value minus the smallest value
interquartile range (IQR)
instead of the difference between the biggest and smallest value the difference between the 25th percentile and the 75th percentile is taken
variances are completely uninterpretable
in terms of the original variable! All the numbers have been squared and they don’t mean anything anymore
statistical model
uses maths to summarise a dataset relative to multiple variables
Where descriptive statistics describe the data,
inferential statistics use statistical models
error tells us that we
don’t fully understand our outcome/dependent variable
I don’t like the p-score I got so I alter it. I leave out info that doesn’t support my hypothesis. Is this fine?
No, p-hacking is unethical and you must report all analyses.