AP Enviornmental Science College Board Unit 3
1/17
There's no tags or description
Looks like no tags are added yet.
Name | Mastery | Learn | Test | Matching | Spaced | Call with Kai |
|---|
No analytics yet
Send a link to your students to track their progress
18 Terms
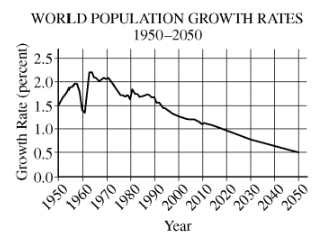
The world population growth rate in 2015 is about 1 percent. It is expected to drop to 0.5 percent by 2050, partly because of increased access to birth control in developing nations. Another likely cause for the expected decline is…
Increasing numbers of women entering the workforce
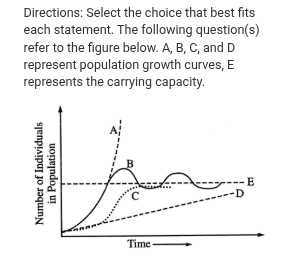
Which letter represents the maximum number of individuals that can be supported by a particular ecosystem on a long-term basis?
E
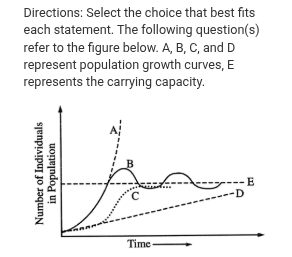
Which letter represents the population growing exponentially?
A
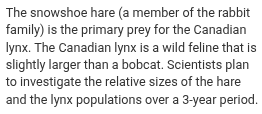
Based on predator-prey dynamics, which of the following identifies the hypothesis most likely supported by the study?
An increase in the lynx population, decrease in the hare population
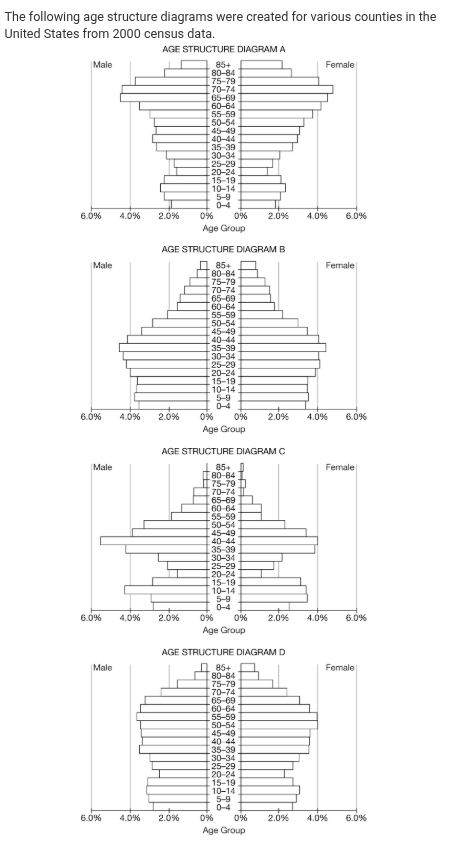
Which of the age-structure diagrams best illustrates a county that has a stable population size and slow or no population growth?
D
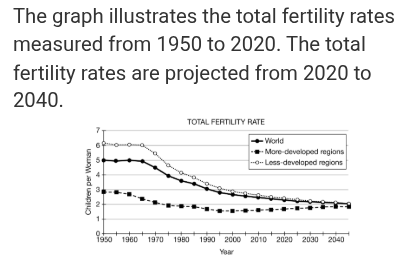
Which of the following best describes the trends seen in the total fertility rates for the world population from 1950 to the projected rates in 2040?
Total fertility rates have declined rapidly from 1960 to 2000 because women had children later in life as a result of increased educational opportunities.
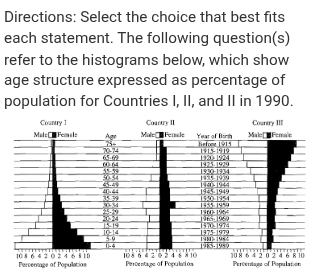
Countries undergoing rapid populations growth include which of the following?
I only
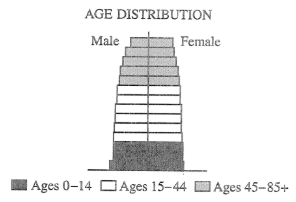
A country with an age distribution like that shown in the figure above, is most likely a country that…
Is experiencing slow or no population growth
Which of the following can be interpreted from an age-structure diagram of a country?
The relative population growth rate of the population
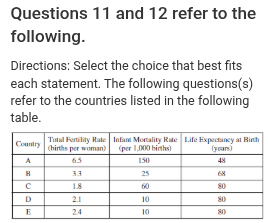
Which of the countries listed in the chart above is most likely experiencing a population decline?
C
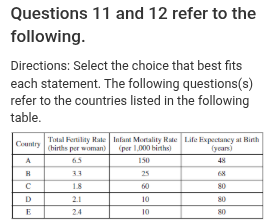
Which of the countries listed in the chart above is most likely to have limited educational opportunities for women?
A
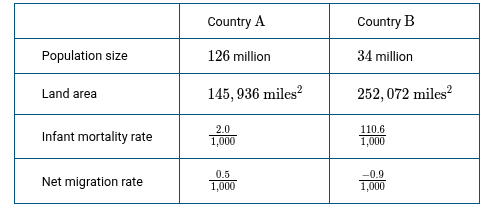
Which of the following characteristics in the table best supports the claim that country A is more developed and that country B is less developed?
Infant mortality rate
Which of the following is a true statement about the total fertility of a society?
The total fertility decreases as the society progresses through the demographic transition
In a certain country, the birth rate is high, and there are many children that are part of the workforce. The country is most likely in which of the following stages of the demographic transition?
Stage 1
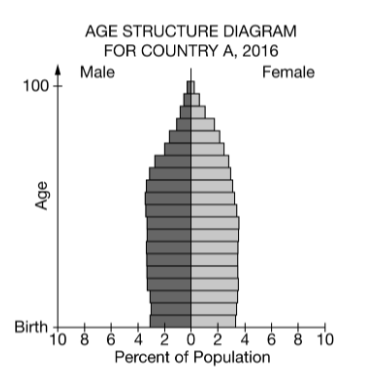
Based on the data in the age structure diagram, which of the following best describes the population of Country A?
Country A is fairly stable, and birth rates are low
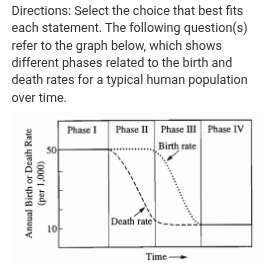
The rate of population growth starts to slow down
What is the population doubling time in years for a country with an annual growth rate of 3.5%?
70/3.5% = 20 years
The country of Sudan has an estimated annual growth rate of 2%. At this rate of growth, approximately